Pallet Pooling/Rentals Market Size and Share
Market Overview
| Study Period | 2020 - 2031 |
|---|---|
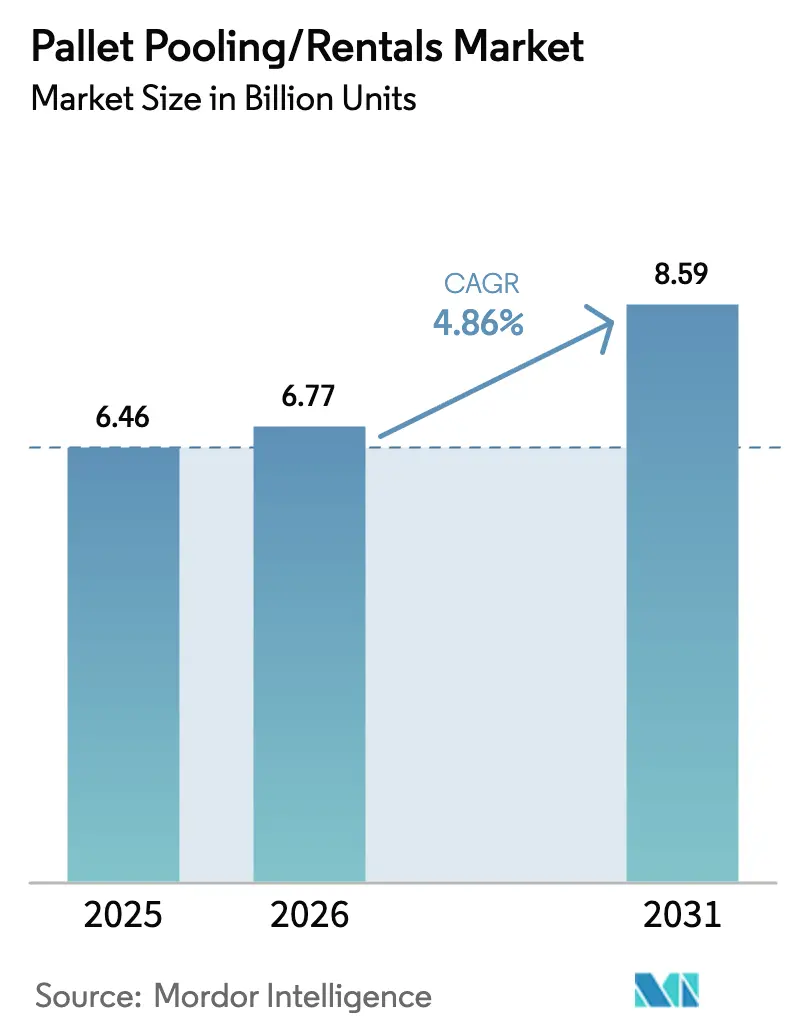
| Market Volume (2026) | 6.77 Billion units |
| Market Volume (2031) | 8.59 Billion units |
| Growth Rate (2026 - 2031) | 4.86% CAGR |
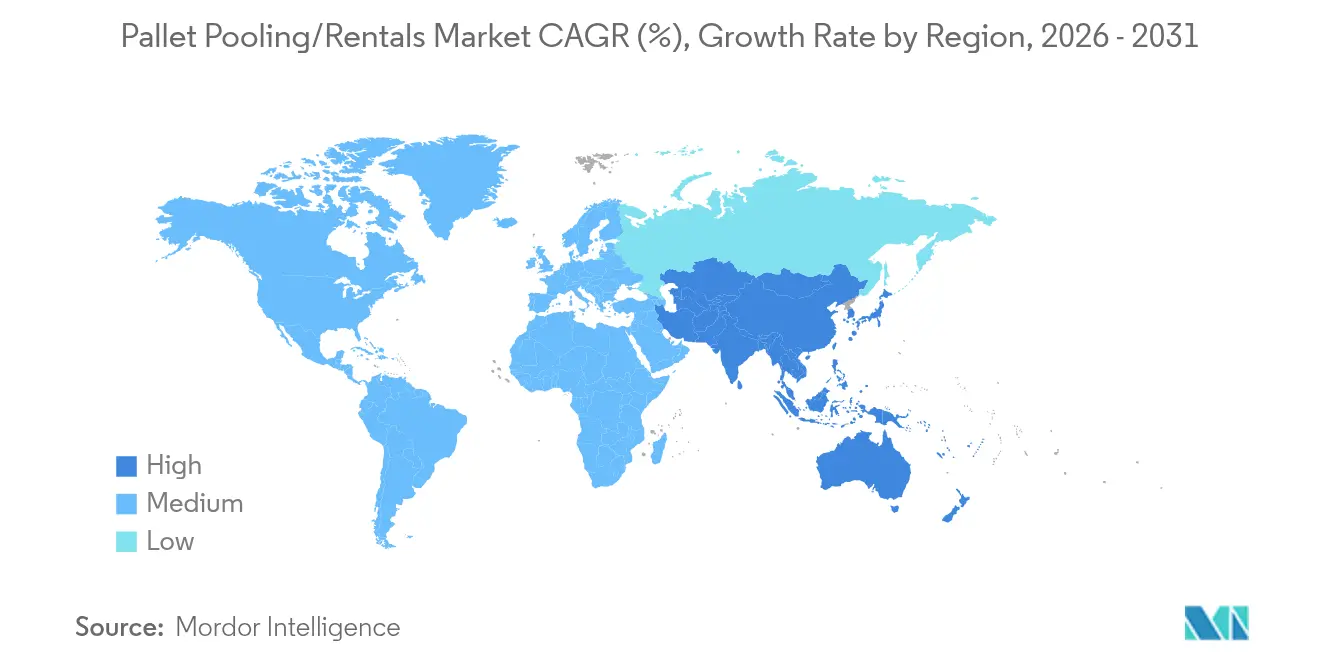
| Fastest Growing Market | Asia Pacific |
| Largest Market | North America |
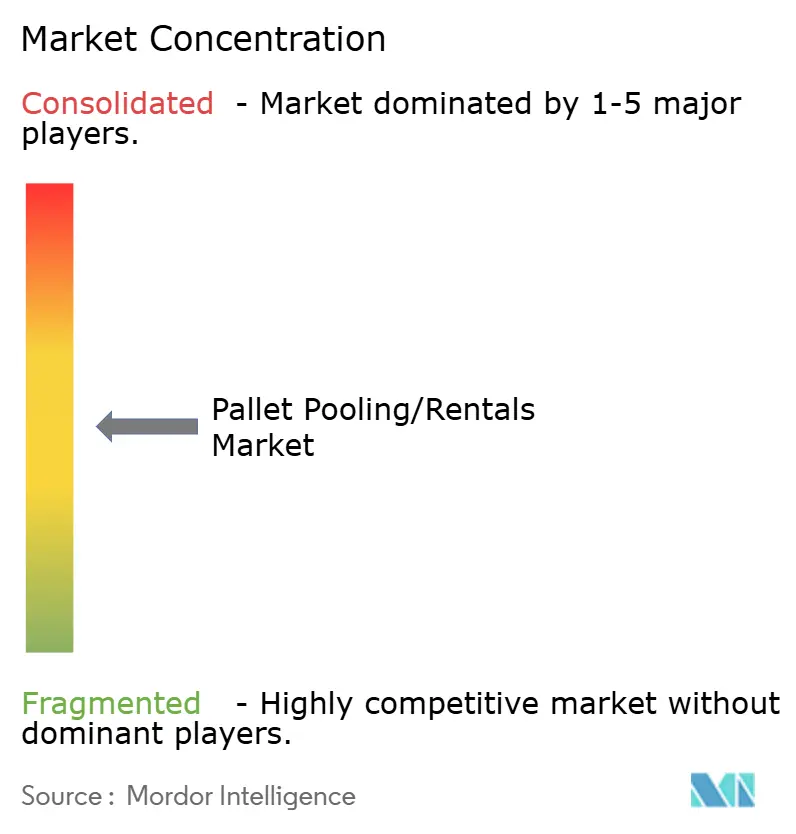
| Market Concentration | Medium |
Major Players *Disclaimer: Major Players sorted in no particular order Image © Mordor Intelligence. Reuse requires attribution under CC BY 4.0. | |
Pallet Pooling/Rentals Market Analysis by Mordor Intelligence
Pallet Pooling/Rentals market size in 2026 is estimated at 6.77 billion units, growing from 2025 value of 6.46 billion units with 2031 projections showing 8.59 billion units, growing at 4.86% CAGR over 2026-2031. Momentum reflects a continued shift from asset ownership to shared‐use models as supply chains prioritize flexibility, hygiene and lower carbon intensity. Rapid e-commerce expansion is lengthening return routes and intensifying reverse logistics complexity, which favors the scale advantages of pooled pallets. At the same time, regulatory scrutiny over food and pharmaceutical safety is accelerating the transition from wood to plastic platforms that can endure repeated wash cycles without structural loss. Network effects, IoT tracking and vendor-managed inventory programs are jointly raising asset utilization, offsetting theft-related losses and underpinning rental margins.
Key Report Takeaways
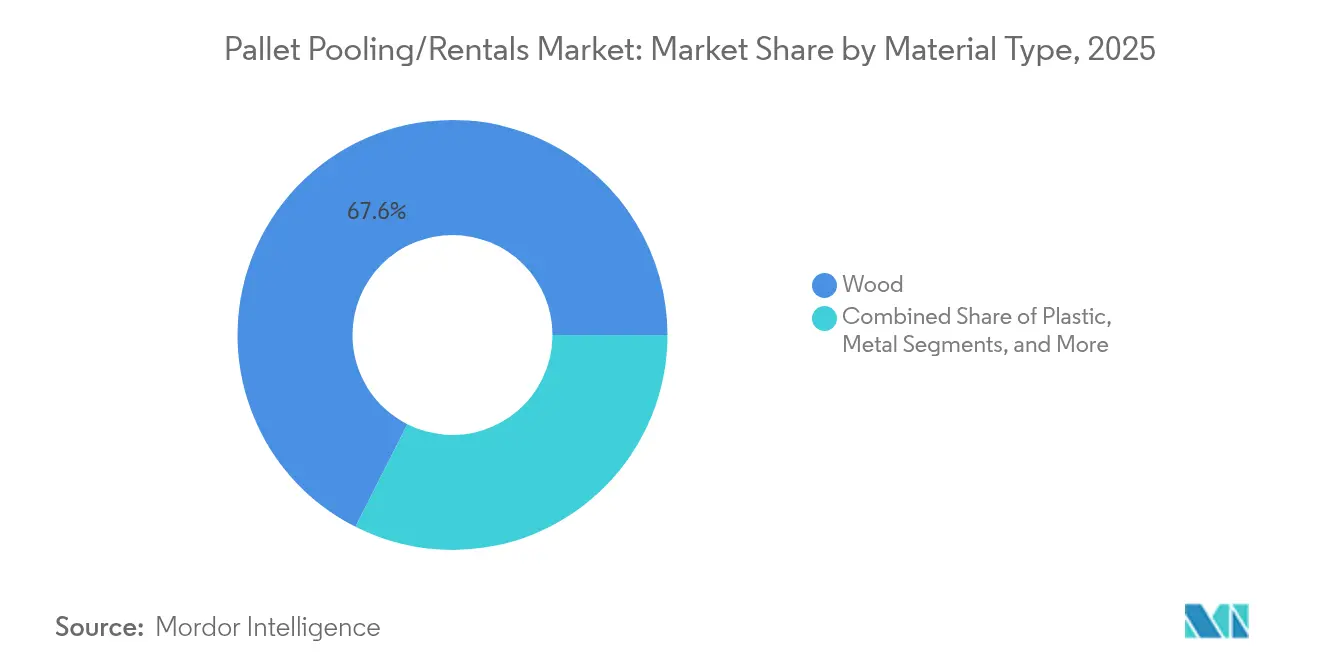
- By material type, wood commanded 67.55% of Pallet Pooling/Rentals market share in 2025, whereas plastic platforms are forecast to grow at a 6.12% CAGR through 2031.
- By service type, rental and return services held 60.65% share of the Pallet Pooling/Rentals market size in 2025, while pool management and tracking is poised for a 6.45% CAGR to 2031.
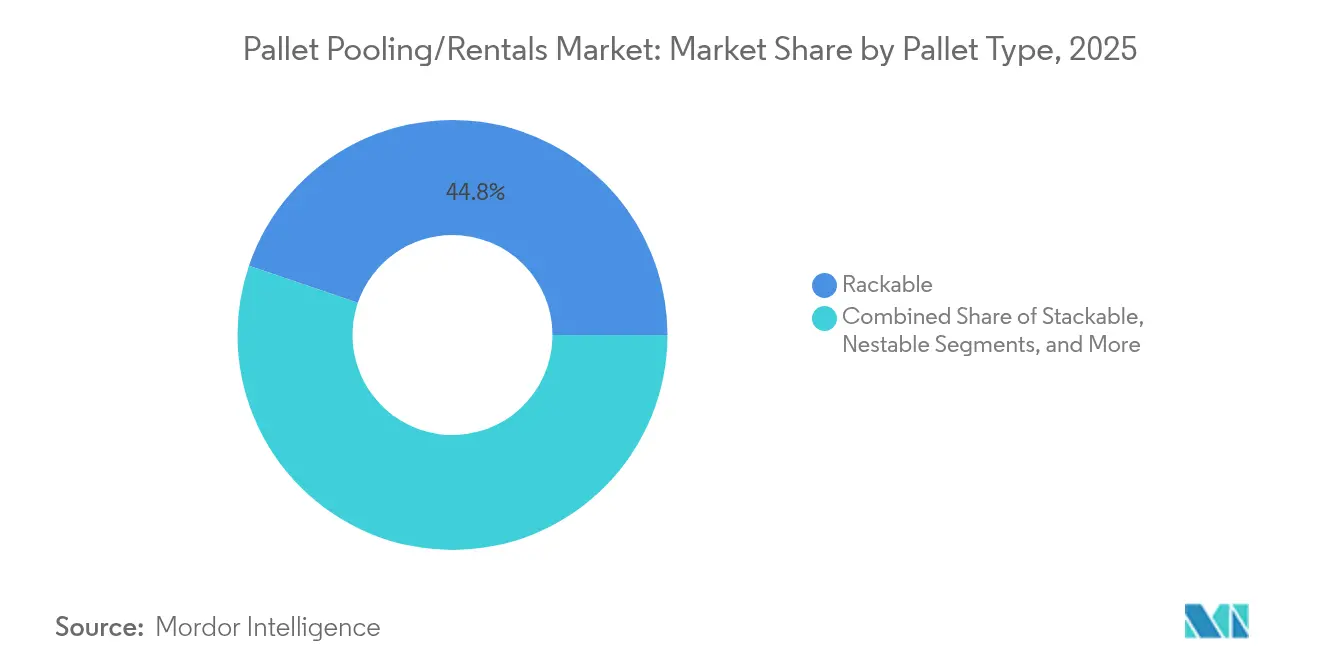
- By pallet type, rackable units accounted for 44.78% share in 2025; nestable designs are projected to expand at a 6.72% CAGR through 2031.
- By end-user industry, food and beverage led with 31.75% share in 2025; pharmaceuticals are expected to record the fastest 6.85% CAGR to 2031.
- By geography, North America captured 37.95% share in 2025, whereas Asia-Pacific is set to grow at a 7.55% CAGR over the forecast period.
Note: Market size and forecast figures in this report are generated using Mordor Intelligence’s proprietary estimation framework, updated with the latest available data and insights as of 2026.
Global Pallet Pooling/Rentals Market Trends and Insights
Drivers Impact Analysis*
| Driver | (~) % Impact on CAGR Forecast | Geographic Relevance | Impact Timeline |
|---|---|---|---|
| Rising e-commerce demand for reverse-logistics optimization | +1.2% | Global, higher in North America and EU | Medium term (2-4 years) |
| Transition to pooled plastic pallets for hygiene compliance | +0.8% | Global, led by APAC and Europe | Long term (≥ 4 years) |
| ESG and circular-economy mandates supporting reuse models | +0.6% | Europe and North America expanding to APAC | Long term (≥ 4 years) |
| Real-time IoT tracking lowering loss rates | +0.4% | Global, early adoption in developed markets | Short term (≤ 2 years) |
| Vendor-managed inventory agreements with 3PLs | +0.3% | North America and Europe, expanding globally | Medium term (2-4 years) |
| Carbon-credit monetization of reused pallets | +0.2% | Europe and North America | Long term (≥ 4 years) |
| Source: Mordor Intelligence | |||
Rising E-commerce Demand for Reverse-Logistics Optimization
The asymmetric flow of goods created by online retail generates unpredictable returns volumes that strain owned pallet fleets. Pooled solutions deliver flexible capacity across multiple fulfillment centers, thus minimizing idle inventory and smoothing seasonal peaks. CHEP’s collaboration with a leading European food manufacturer illustrates how shared pallets absorb promotional‐season spikes without forcing plants to buy surplus assets, freeing working capital for core operations. Third-party logistics providers extend this benefit by combining vendor-managed inventory with multi-client pooling networks that keep pallets circulating across adjacent routes. Reverse logistics optimization is therefore acting as an accelerator for broader adoption, with operators reporting improved asset turns in markets where e-commerce penetration is highest.[1]Brambles Ltd., “2025 Half-Year Results Presentation,” brambles.com
Transition to Pooled Plastic Pallets for Hygiene Compliance
Food safety and pharmaceutical good‐distribution-practice guidelines increasingly discourage porous surfaces that absorb moisture or harbor pathogens. Purpose-built plastic pallets, such as IFCO’s Q-Pall H1 platform, feature closed smooth decks that withstand high-pressure wash processes while meeting regional sanitization protocols. [2]IFCO Systems, “IFCO ESG Report 2024,” ifco.comHigh initial price points push users toward rental rather than ownership because pooling spreads capital cost across multiple trips. This economic logic, combined with tighter hygiene rules, supports the 6.42% CAGR forecast for plastic units despite wood’s current dominance.
ESG and Circular-Economy Mandates Spurring Reuse Models
Corporate scope-3 emissions targets have created measurable incentives to replace disposable transport packaging with reusable assets. Spanish chemical producer Ercros documented 8,580 tonnes of CO₂ savings in 2024 after lifting its share of recycled and second-hand pallets to 50% of total movements.[3]Ercros SA, “La Gestión Logística en Ercros Ahorra 8.580 t de Emisiones de CO₂ en 2024,” ercros.es Pooled providers can quantify avoided emissions per trip, offering clients verified data points for sustainability reports. In Europe, several operators are exploring carbon credit monetization based on blockchain-verified reuse cycles, thereby adding a financial return to environmental compliance.
Real-time IoT Tracking Lowering Loss Rates
Historically, annual pallet loss could exceed 10%, eroding the rental base and squeezing margins. Sensor-equipped platforms now provide continuous location data that lets operators retrieve stray assets before they leave closed loops. PALIoT and other providers also link trip data to automated carbon reporting, creating twin benefits of loss prevention and ESG accounting. Early adopters in North America report double-digit reductions in retrieval costs, encouraging wider deployment as tag prices fall and battery lives lengthen.
Restraints Impact Analysis*
| Restraint | (~) % Impact on CAGR Forecast | Geographic Relevance | Impact Timeline |
|---|---|---|---|
| Pallet theft and asset attrition | -0.7% | Global, acute in emerging markets | Short term (≤ 2 years) |
| Volatile resin and lumber costs squeezing rental margins | -0.5% | Global, regionally varied | Medium term (2-4 years) |
| Fragmented pallet standards in emerging markets | -0.4% | APAC, Latin America, Africa | Medium term (2-4 years) |
| Blockchain-based asset-ownership shifts | -0.3% | Global, advanced markets first | Long term (≥ 4 years) |
| Source: Mordor Intelligence | |||
Pallet Theft and Asset Attrition
Unauthorized resale of pooled pallets remains a costly threat, particularly in regions where informal markets flourish. CHEP continues to pursue civil and criminal action against entities that divert blue pallets into gray channels, highlighting the capital risk inherent in shared-asset models. Higher insurance premiums and security investments inflate operating costs, forcing rental price increases that can dampen uptake among cost-sensitive shippers, especially in emerging economies with weaker enforcement regimes.
Volatile Resin and Lumber Costs Squeezing Rental Margins
While pooling spreads asset cost over multiple cycles, short-term spikes in resin or lumber prices still affect replacement and expansion budgets. Timing mismatches between multi-year rental contracts and quarterly commodity swings can compress operator margins. Major players deploy hedging strategies and long-term supplier agreements, but smaller regional firms often struggle to absorb input inflation without customer turnover.
*Our forecasts treat driver/restraint impacts as directional, not additive. The impact forecasts reflect baseline growth, mix effects, and variable interactions.
Segment Analysis
By Material Type: Hygiene Focus Lifts Plastic Adoption
Wood retained 67.55% share of the Pallet Pooling/Rentals market in 2025 owing to abundant raw material supply and low upfront cost. The Pallet Pooling/Rentals market size for plastic units is projected to post a 6.12% CAGR despite higher purchase prices because they meet stringent wash-down protocols in food and pharma distribution. The durability of plastic extends asset life, lowering cost per trip over time and enabling operators to amortize smart sensor tags across more cycles.
Continued investment in lightweight resin blends and recycled content underscores plastic’s long-term appeal. IFCO’s Dora and Nestor ranges reduced tare weight without sacrificing load capacity, lessening outbound fuel burn and supporting scope-3 reduction goals. Concurrently, wood faces incremental compliance costs driven by ISPM-15 heat treatment requirements that are better absorbed within a rental fee structure than through direct ownership. Metal, corrugated and composite formats remain niche, serving high-temperature processing lines or airfreight routes where ultralight mass offsets higher material expense.


By Service Type: Tracking-Rich Solutions Gain Ground
Rental and return offerings continue to dominate with 60.65% share, reflecting user preference for simple pay-per-trip pricing. Yet demand is steadily gravitating toward pool management and tracking packages, which are forecast to grow at a 6.45% CAGR. These bundles incorporate predictive maintenance, demand forecasting and real-time telemetry, allowing shippers to adjust inventory and reorder points dynamically. The shift speaks to a broader logistics outsourcing trend whereby pallet procurement, return logistics and compliance reporting collapse into a single SLA.
Expanding data requirements under modern ESG audits are another tailwind for managed services. Customers increasingly request pallet-level carbon footprint certificates to feed scope-3 disclosures, a task simplified by integrated software dashboards that accompany tracking hardware. Repair and maintenance services remain essential by extending usable life, but technology-enabled packages capture the bulk of incremental margin because they deliver actionable visibility rather than merely functional upkeep.
By Pallet Type: Nestable Designs Accelerate
Rackable platforms held 44.78% share in 2025 because they accommodate racking systems in automated warehouses and support heavier loads. Nevertheless, nestable variants are set to record a 6.72% CAGR thanks to their ability to collapse into compact stacks during empty returns, curbing backhaul costs. That efficiency resonates with carriers facing tight capacity and fuel-linked surcharges, strengthening the business case for conversion even in traditional supply chains.
Stackable and specialty designs persist in applications that require static strength or wide deck spacing. However, the rising prevalence of urban micro-fulfillment centers favors smaller nestable SKUs that navigate tighter dock space. Operators are therefore diversifying fleets to blend durability with space efficiency, supported by IoT tags that monitor deflection and alert crews when lightweight pallets approach fatigue thresholds.
By End-User Industry: Regulated Sectors Advance
Food and beverage distributors maintained 31.75% share in 2025, leveraging pooling to guarantee cleaned pallets for cold-chain transport. Yet pharmaceuticals are positioned for 6.85% CAGR adoption, driven by traceability mandates such as the U.S. Drug Supply Chain Security Act and EU Falsified Medicines Directive. The Pallet Pooling/Rentals market share captured by regulated sectors is therefore widening as unit-level visibility becomes a compliance prerequisite rather than an operational nice-to-have.
Transportation, retail and general manufacturing provide steady baseline demand, each segment valuing pooled assets for capital avoidance and standardized dimensions that interface smoothly with automated handling lines. Automotive and electronics subsegments often specify custom pallets with reinforced edges or anti-static coatings, commanding higher rental fees that offset moderate volume growth.
Geography Analysis
North America preserved 37.95% share in 2025 on the back of dense 3PL networks, uniform pallet standards and mature reverse logistics capabilities. The region’s integrated Canada-U.S. lumber supply chain enables low repositioning costs, while heat-treatment compliance remains manageable through large commercial kilns tied to export corridors . Asset theft persists but has moderated due to IoT tags and heightened legal enforcement, allowing rental yields to stabilize.
Asia-Pacific is projected to expand at a 7.55% CAGR through 2031, buoyed by manufacturing growth in China, India and Southeast Asia alongside modernization of domestic supply chains. Fragmented dimensional norms still impede seamless cross-border pooling, prompting operators to build localized fleets that match national standards. Deployment of new depots such as Loscam’s Auckland hub demonstrates ongoing capacity additions that link domestic warehouses to maritime gateways, improving turn times across export routes.
Europe occupies a middle position: volume growth remains modest relative to APAC, yet regulatory directives on circular economy and carbon disclosure elevate pooling penetration. EPAL’s harmonization efforts underpin multi-country fleet interoperability, while strong hygiene rules in food and pharma accelerate plastic adoption. Carbon credit pilots across Germany and France further sweeten the economics of reuse, shifting corporate procurement guidelines toward rental contracts that bundle sustainability reporting and return logistics under one umbrella.

Competitive Landscape
The market shows moderate concentration, with Brambles-owned CHEP holding the largest global network while regional specialists exploit technological niches. Scale incumbents rely on asset density and multi-tenant loops to keep per-trip charges low, but must continue investing in RFID, BLE and cellular trackers to defend share against tech-centric entrants. Several mid-size operators are courting private-equity funds to bankroll fleet expansion, yet rising financing costs have pressured balance sheets, as evidenced by challenges at select North American firms.
Technology integration remains the strategic frontier. Operators deploying AI-assisted routing optimize pallet flows and reduce deadhead miles, cutting carbon intensity and improving customer retention. Vertical integration is also advancing: timber processors like James Jones and Sons and Hyne Group have acquired pallet manufacturers to secure feedstock and capture additional margin. Regulatory compliance, especially ISPM-15 certification for international shipping, now acts as a competitive moat that raises entry barriers for asset-light disruptors lacking treatment facilities.
White-space growth prospects persist in Africa, South Asia and select Latin American corridors where pooling penetration is below 10%. However, entrants must navigate theft risk, fragmented standards and infrastructure shortfalls. Partnerships with established 3PLs and fast-moving consumer goods companies are emerging as the preferred route to scale networks quickly while sharing capital burden.
Pallet Pooling/Rentals Industry Leaders
Brambles Limited (CHEP)
IFCO Systems GmbH
PECO Pallet Inc.
China Merchants Loscam International Holdings Co. Ltd.
iGPS Logistics LLC
- *Disclaimer: Major Players sorted in no particular order

Recent Industry Developments
- February 2025: IFCO Systems reported 674,333 tonnes of CO₂e avoided during 2.4 billion shipments in 2024 and introduced lightweight Dora and Nestor plastic pallets while adding automated service centers in the UK.
- February 2025: Ercros achieved 8,580 tonnes of CO₂ savings by raising recycled and second-hand pallet use to 50% of annual volumes.
- January 2025: Hyne Group acquired Express Pallets to expand timber processing and pallet manufacturing capacity in Australia.
- December 2024: BC Wood Products bought American Pallet Corporation, widening its North American production footprint.


Global Pallet Pooling/Rentals Market Report Scope
Pallet pooling and rentals have become increasingly popular as useful management methods for pallets globally. Advanced tracking technologies, such as RFID and barcodes, propel the pallet pooling and rental market. They facilitate real-time monitoring of pallets, leading to improved efficiency, reduced losses, and enhanced inventory management throughout the supply chain.
The pallet pooling/rentals market is segmented by pallet type (plastic, wood, cardboard, metal), end-user industry (transportation & warehousing, food & beverages, pharmaceuticals, retail, manufacturing, other end-user industries), and geography (North America [United States and Canada], Europe [France, Germany, Italy, Spain, United Kingdom, and Rest of Europe], Asia-Pacific [China, India, Japan, Australia & New Zealand, and Rest of Asia Pacific], Latin America [Brazil, Mexico, Argentina and Rest of Latin America], and Middle East & Africa [United Arab Emirates, Saudi Arabia, South Africa, Egypt, and Rest of Middle East & Africa]). The report offers market sizes and volume forecasts for all the above segments.
| Wood |
| Plastic |
| Metal |
| Corrugated Paper/Composite |
| Rental and Return |
| Repair and Maintenance |
| Pool Management and Tracking |
| Nestable |
| Rackable |
| Stackable |
| Other Pallet Types |
| Transportation and Warehousing |
| Food and Beverages |
| Pharmaceuticals |
| Retail and E-commerce |
| Manufacturing |
| Other End-user Industries |
| North America | United States | |
| Canada | ||
| Mexico | ||
| South America | Brazil | |
| Argentina | ||
| Chile | ||
| Rest of South America | ||
| Europe | United Kingdom | |
| Germany | ||
| France | ||
| Spain | ||
| Italy | ||
| Rest of Europe | ||
| Asia-Pacific | China | |
| India | ||
| Japan | ||
| Australia | ||
| South Korea | ||
| Vietnam | ||
| Rest of Asia-Pacific | ||
| Middle East and Africa | Middle East | Saudi Arabia |
| United Arab Emirates | ||
| Turkey | ||
| Rest of Middle East | ||
| Africa | South Africa | |
| Nigeria | ||
| Egypt | ||
| Rest of Africa | ||
| By Material Type | Wood | ||
| Plastic | |||
| Metal | |||
| Corrugated Paper/Composite | |||
| By Service Type | Rental and Return | ||
| Repair and Maintenance | |||
| Pool Management and Tracking | |||
| By Pallet Type | Nestable | ||
| Rackable | |||
| Stackable | |||
| Other Pallet Types | |||
| By End-user Industry | Transportation and Warehousing | ||
| Food and Beverages | |||
| Pharmaceuticals | |||
| Retail and E-commerce | |||
| Manufacturing | |||
| Other End-user Industries | |||
| By Geography | North America | United States | |
| Canada | |||
| Mexico | |||
| South America | Brazil | ||
| Argentina | |||
| Chile | |||
| Rest of South America | |||
| Europe | United Kingdom | ||
| Germany | |||
| France | |||
| Spain | |||
| Italy | |||
| Rest of Europe | |||
| Asia-Pacific | China | ||
| India | |||
| Japan | |||
| Australia | |||
| South Korea | |||
| Vietnam | |||
| Rest of Asia-Pacific | |||
| Middle East and Africa | Middle East | Saudi Arabia | |
| United Arab Emirates | |||
| Turkey | |||
| Rest of Middle East | |||
| Africa | South Africa | ||
| Nigeria | |||
| Egypt | |||
| Rest of Africa | |||


Key Questions Answered in the Report
What is the projected volume of the Pallet Pooling/Rentals market by 2031?
It is expected to reach 8.59 billion units based on a 4.86% CAGR forecast.
Which material category is expanding fastest within pooled pallets?
Plastic pallets are forecast to grow at a 6.12% CAGR due to hygiene and durability benefits.
Which region offers the highest growth opportunity for pooling operators?
Asia-Pacific leads with a 7.55% CAGR driven by manufacturing expansion and supply-chain modernization.
How are IoT technologies benefiting pallet pooling?
Real-time tracking reduces theft, improves asset turns and supplies verified data for ESG reporting.
Why is the pharmaceutical sector adopting pooled pallets rapidly?
Strict traceability and sanitization regulations make standardized, reusable plastic pallets preferable over owned wood fleets.
Page last updated on:


