Packaging Coatings Market Size and Share
Market Overview
| Study Period | 2021 - 2031 |
|---|---|
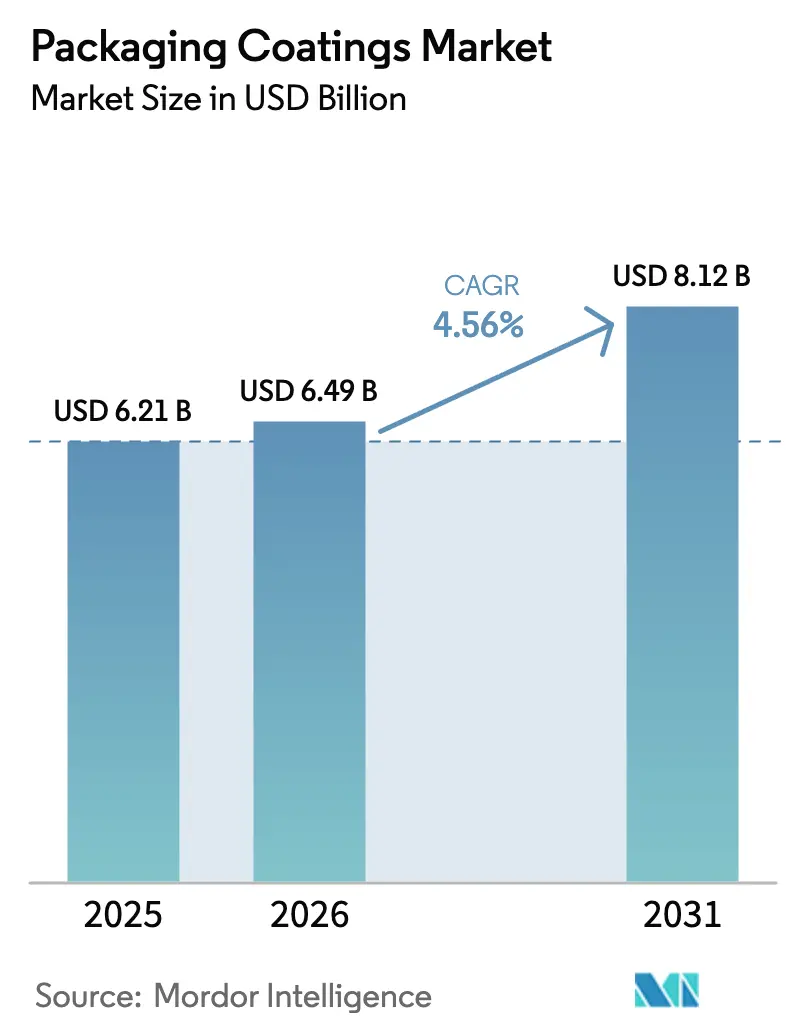
| Market Size (2026) | USD 6.49 Billion |
| Market Size (2031) | USD 8.12 Billion |
| Growth Rate (2026 - 2031) | 4.56% CAGR |
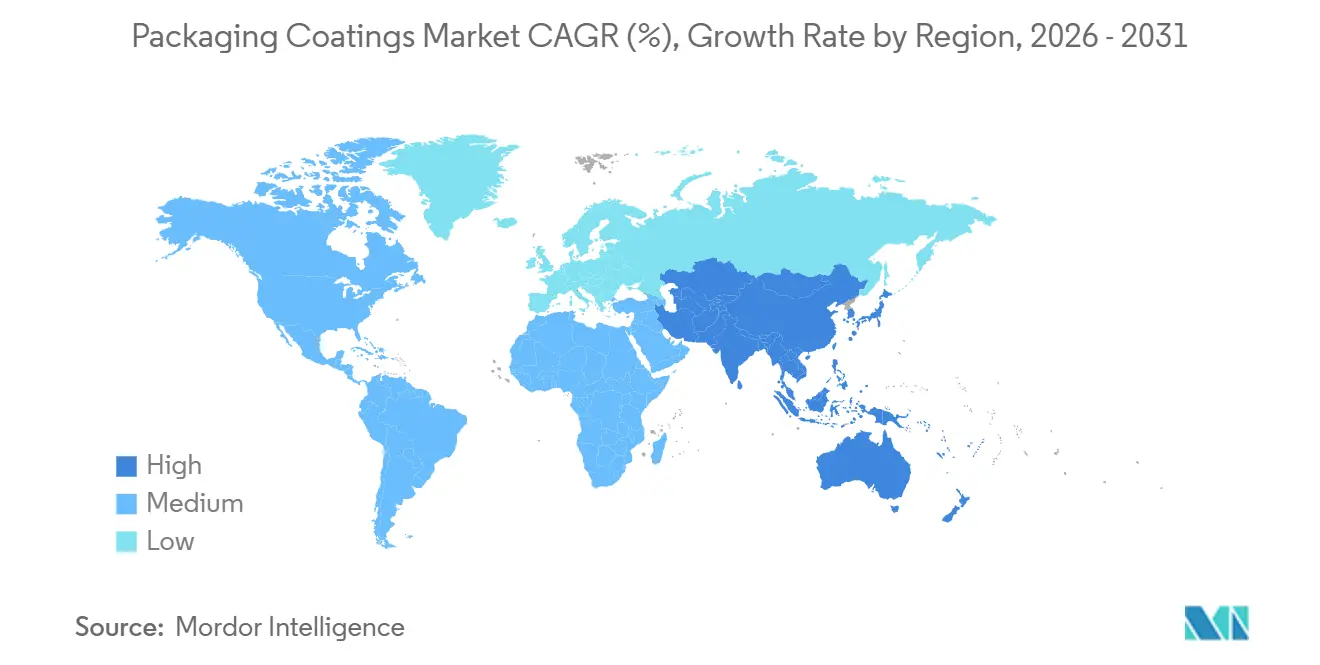
| Fastest Growing Market | Asia Pacific |
| Largest Market | Asia Pacific |
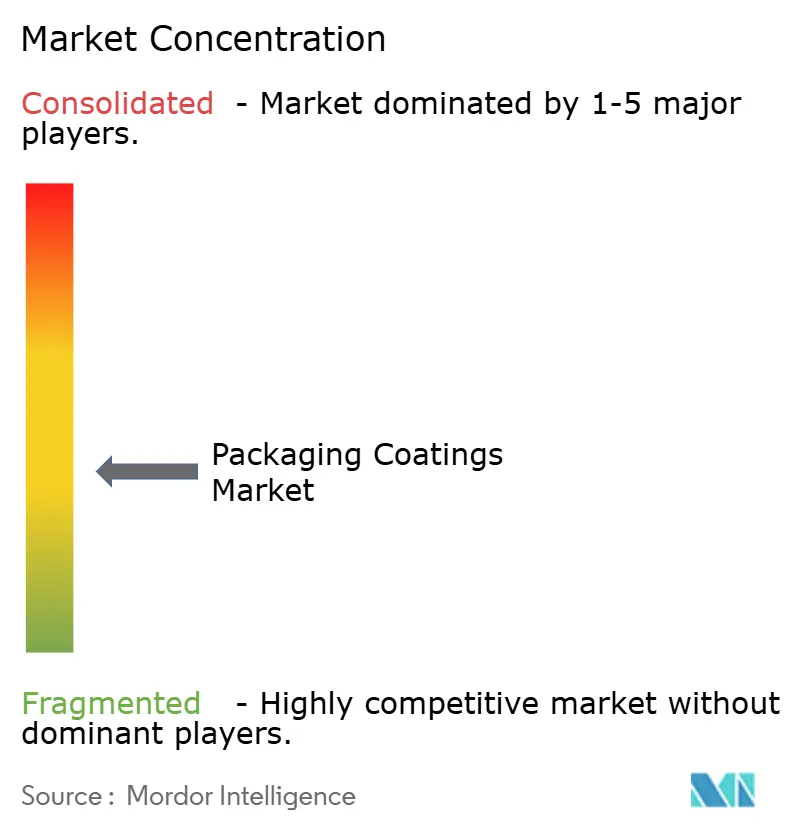
| Market Concentration | Medium |
Major Players *Disclaimer: Major Players sorted in no particular order Image © Mordor Intelligence. Reuse requires attribution under CC BY 4.0. | |
Packaging Coatings Market Analysis by Mordor Intelligence
The Packaging Coatings Market size is expected to grow from USD 6.21 billion in 2025 to USD 6.49 billion in 2026 and is forecast to reach USD 8.12 billion by 2031 at a 4.56% CAGR over 2026-2031. The upswing is tied to BPA-free mandates that accelerate resin reformulations, an expanding craft beverage sector that relies on UV-curable finishes, and e-commerce logistics that demand scuff-resistant caps and closures. Epoxy chemistries still dominate because of their proven adhesion and barrier properties, yet polyester and acrylic systems are absorbing share as regulators tighten migration limits. Water-based and powder formulations are advancing as solvent-based lines face stricter VOC ceilings, while rad-cure platforms gain traction by cutting oven energy use up to 85%. Asia-Pacific remains both the manufacturing engine and the fastest-growing consumer region, supported by large-scale aluminum canstock projects in China, India, and Vietnam.
Key Report Takeaways
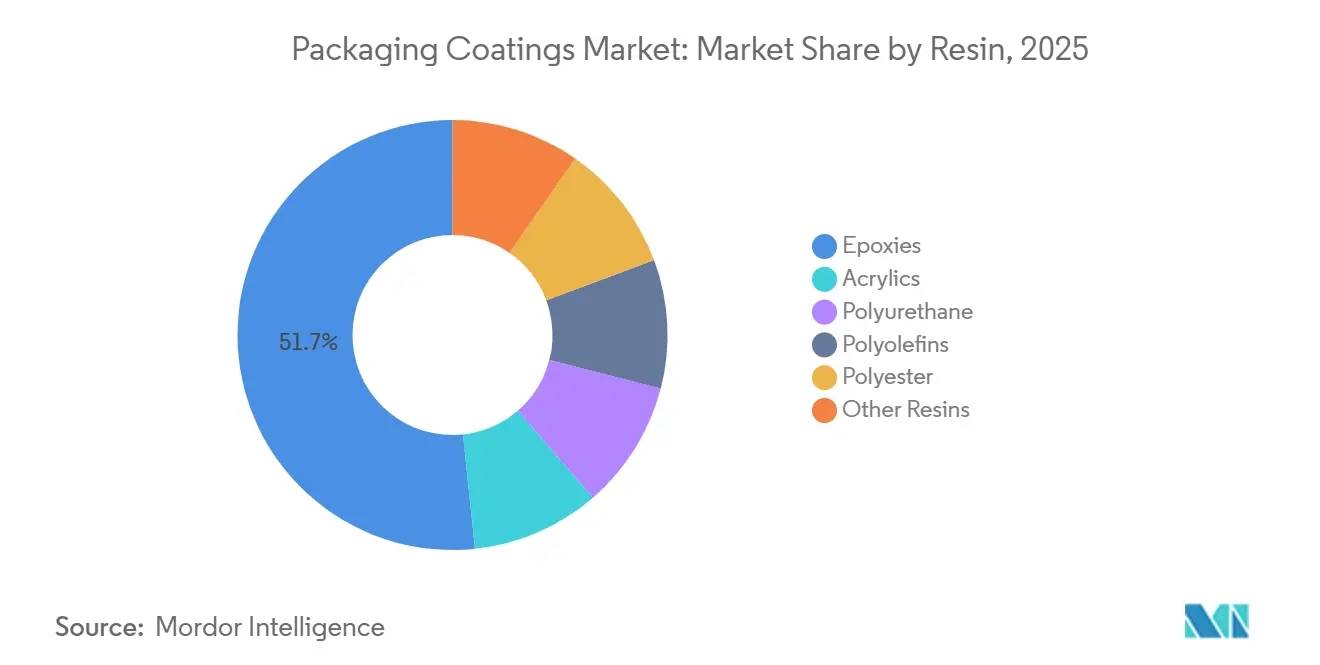
- By resin type, epoxies led with 51.67% of the packaging coatings market share in 2025; epoxies are projected to post the fastest 4.81% CAGR through 2031.
- By coating technology, water-based systems held 43.44% revenue share in 2025, while UV-curable solutions are set to expand at a 5.11% CAGR to 2031.
- By packaging type, rigid (cans, caps & closures) captured 60.54% revenue in 2025; flexible (pouches, films, sachets) is forecast to post the highest 4.86% CAGR to 2031.
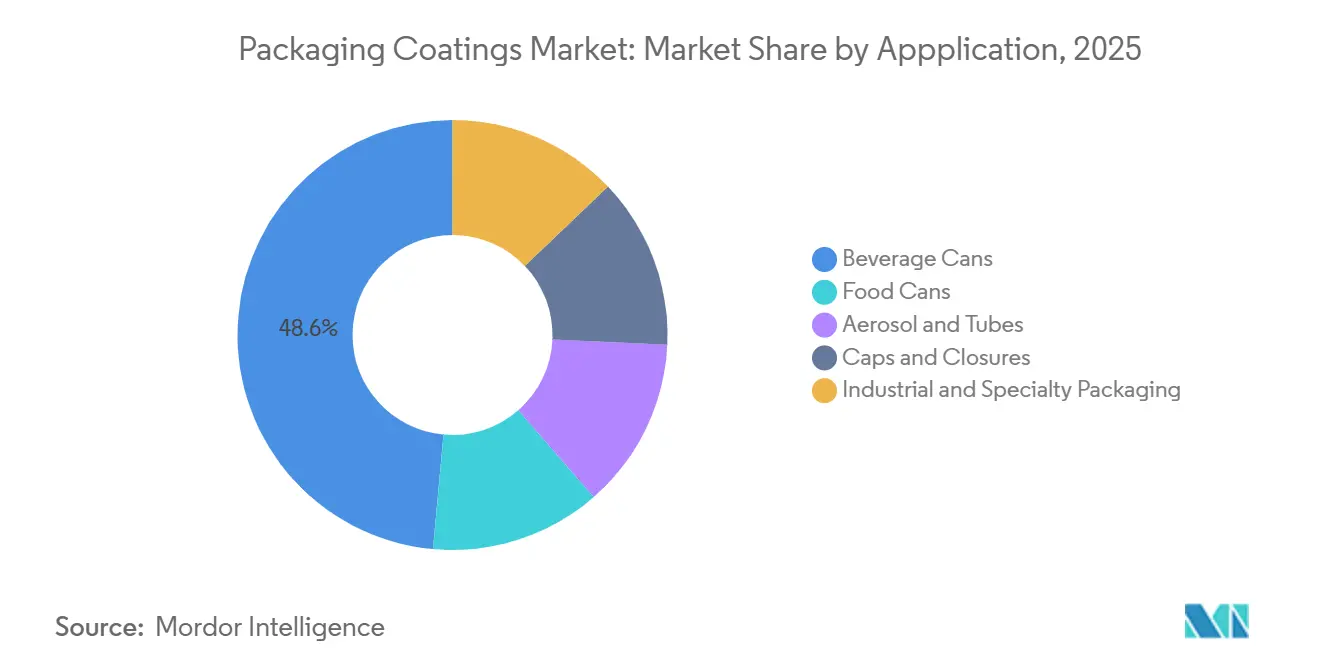
- By application, beverage cans accounted for 48.56% share of the packaging coatings market size in 2025 and are growing at a 4.99% CAGR through 2031.
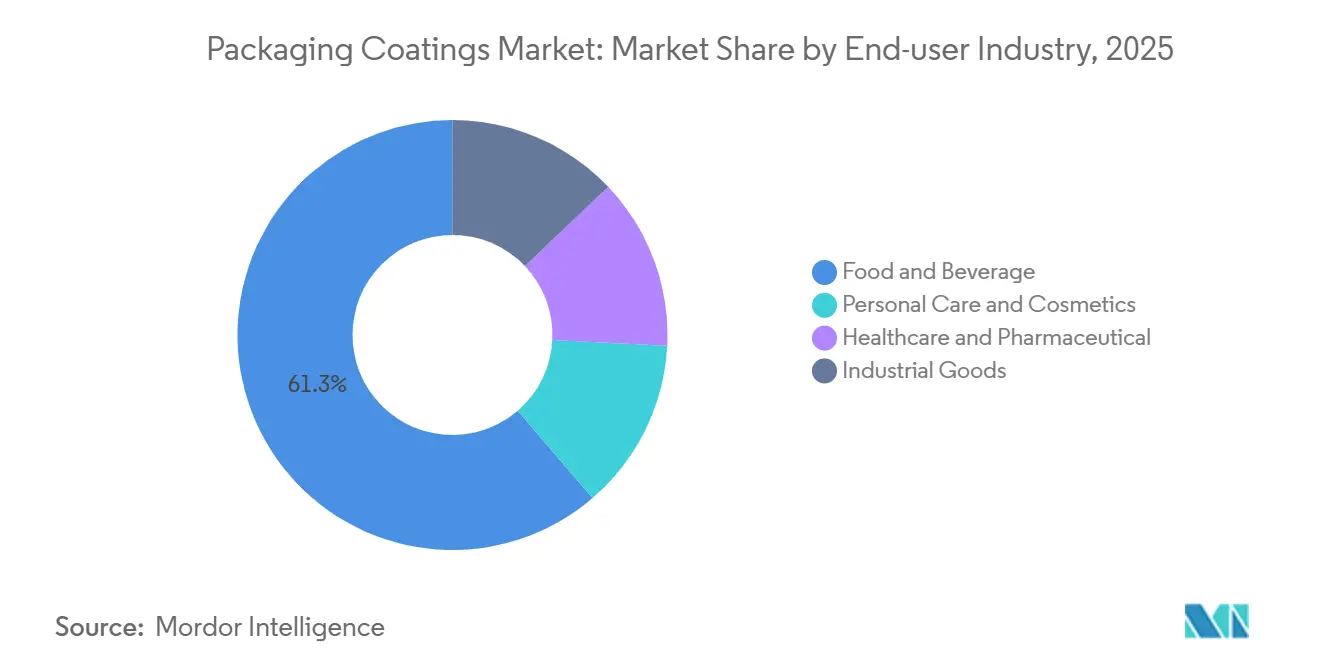
- By end-user industry, food and beverage captured 61.29% revenue in 2025; healthcare and pharmaceutical are forecast to post the highest 5.35% CAGR to 2031.
- Regionally, Asia-Pacific controlled 43.75% revenue in 2025 and is expanding at a 4.79% CAGR to 2031.
Note: Market size and forecast figures in this report are generated using Mordor Intelligence’s proprietary estimation framework, updated with the latest available data and insights as of January 2026.
Global Packaging Coatings Market Trends and Insights
Drivers Impact Analysis*
| Driver | (~) % Impact on CAGR Forecast | Geographic Relevance | Impact Timeline |
|---|---|---|---|
| BPA-free can-lining mandates in North America and Europe | +1.2% | North America, Europe | Short term (≤ 2 years) |
| Craft beverage boom spurring UV-curable varnish demand | +0.9% | Global, with concentration in North America, Europe, Asia-Pacific | Medium term (2-4 years) |
| E-grocery logistics fueling scuff-resistant cap/closure coats | +0.7% | Global, led by North America, Europe, urban Asia-Pacific | Medium term (2-4 years) |
| Rise of refill-ready metal packaging | +0.6% | Europe, North America, emerging in Asia-Pacific | Long term (≥ 4 years) |
| Direct-to-shape inkjet print adoption raising low-temp cure needs | +0.5% | Global, early adoption in Europe and North America | Long term (≥ 4 years) |
| Source: Mordor Intelligence | |||


BPA-Free Can-Lining Mandates
The European Union’s Regulation 2024/3190 prohibits BPA in food-contact coatings from January 20, 2025, setting transitional deadlines that end in July 2026 for beverage cans and January 2028 for other metal formats [1] European Commission, “Regulation (EU) 2024/3190 on Bisphenol A in Food-Contact Materials,” europa.eu. Canmakers are replacing legacy epoxy-phenolic liners with acrylic, polyester, and polyolefin chemistries that match barrier performance without bisphenol building blocks. AkzoNobel invested EUR 32 million in January 2024 to scale bisphenol-free capacity, illustrating how incumbents treat compliance as a competitive lever rather than a cost burden. In the United States, state-level restrictions and voluntary brand-owner phase-outs by Coca-Cola and PepsiCo are harmonizing North American practices with EU norms. Compressed reformulation windows of 12–18 months reward suppliers that provide rapid product qualification and online technical service.
Craft Beverage Boom Spurring UV-Curable Varnish Demand
Independent breweries and premium ready-to-drink cocktails favor aluminum cans for recyclability and full-surface graphics, creating demand for UV-curable exterior varnishes that harden in under one second and do not require thermal ovens. A Coors Brewing study logged energy savings of 14,000 MMBtu per billion cans when switching from thermal to UV curing[2]Miltec UV, “Energy Savings of UV-Cure Varnish in Beverage Cans,” milteclighting.com. PPG’s DuraNEXT portfolio, launched in July 2024, extends electron-beam and UV chemistries from wood and coil coatings into metal packaging, offering solvent-free basecoats that cure at ambient temperature. Faster changeovers suit craft producers that run short batches and multiple SKUs, while Ball Corporation’s Graphics Centers of Excellence validate UV varnish designs for brand differentiation.
E-Grocery Logistics Fueling Scuff-Resistant Cap/Closure Coats
Automated fulfillment exposes metal closures to robotic handling that legacy coatings cannot withstand. PPG’s iSense Gloss system enhances abrasion resistance, curbing returns linked to scratched lids. Henkel’s BONDERITE cleaners and sealants balance adhesion and mechanical stability at high line speeds. As caps represent 12–15% of rigid-format volume yet carry brand-critical graphics, performance failures directly affect consumer perception. Suppliers are responding with high-solids formulations that boost dry-film thickness per pass without adding weight.
Rise of Refill-Ready Metal Packaging
EU circular-economy targets require reusable packaging, prompting the development of metal containers built for 20+ wash cycles. Siegwerk’s CIRKIT portfolio, launched in April 2024, offers oxygen-barrier and de-inking primers that preserve can integrity across repeated alkaline washdowns. Siegwerk’s August 2025 purchase of Allinova strengthens its water-based dispersion range for refill systems. Japan’s UACJ partners with Suntory to prototype 100% recycled-content cans, demanding coatings that tolerate varied alloy surfaces. Though refillables still account for below 2% of metal packaging volume, legislative pull and brand commitments foreshadow broader uptake.
Restraints Impact Analysis*
| Restraint | (~) % Impact on CAGR Forecast | Geographic Relevance | Impact Timeline |
|---|---|---|---|
| Epoxy resin price volatility | -0.8% | Global, acute in Europe and North America | Short term (≤ 2 years) |
| Weak recycling streams limiting bio-barrier uptake | -0.5% | Global, most pronounced in emerging markets | Medium term (2-4 years) |
| VOC-emission compliance costs | -0.4% | North America, Europe, expanding to Asia-Pacific | Short term (≤ 2 years) |
| Source: Mordor Intelligence | |||
Epoxy Resin Price Volatility
US spot epoxy prices climbed 2.18% in January 2025, while EU quotes rose after anti-dumping duties of up to 40.8% on Chinese imports. Annual supply contracts leave canmakers exposed when resin costs spike mid-year, compressing margins. Although BPA-free acrylics and polyesters lessen epoxy exposure, those chemistries face their own feedstock swings. Large suppliers hedge by vertically integrating or signing multi-year feedstock deals, but smaller firms struggle to finance such strategies.
Weak Recycling Streams Limiting Bio-Barrier Uptake
Bio-based coatings from tomato pomace or soybean oils exhibit competitive barrier performance, yet municipal recycling systems cannot easily de-coat bio-films from aluminum scrap. The United Kingdom’s Recyclability Assessment Methodology classifies hard-to-recycle coatings as red, discouraging brand adoption. Until plasma or enzymatic de-coating becomes commercial, bio-barriers will remain confined to controlled loops such as refillables.
*Our forecasts treat driver/restraint impacts as directional, not additive. The impact forecasts reflect baseline growth, mix effects, and variable interactions.
Segment Analysis
By Resin: Epoxies Retain Dominance Amid Regulatory Pressure
Epoxies held 51.67% of the packaging coatings market size in 2025 and are forecast to post a 4.81% CAGR through 2031. Their entrenched status stems from unmatched adhesion to aluminum and steel, plus decades of migration data that lower recall risk. Suppliers are reformulating around bisphenol-S or non-bisphenol backbones to comply with EU rules without sacrificing performance. Acrylics, led by PPG’s INNOVEL PRO, are gaining beverage-can share through lower migration and platinum-level material-health certifications. Polyesters are gaining traction in retort food and healthcare packaging thanks to thermal stability and low extractables, while polyurethanes fill niche roles in collapsible tubes that demand high flexibility.
Acrylics and polyesters will chip away at epoxies as bans widen, yet cost-performance trade-offs keep epoxies relevant in industrial and paint-can applications. Market participants expect resin portfolios to fragment along application lines: epoxies for high-corrosion environments, acrylics for soft-drink and beer cans, polyesters for medical cans, and polyurethanes for personal-care aerosols.


By Coating Technology: Water-Based Systems Lead, UV-Curable Grows Fastest
Water-based chemistries captured 43.44% share of the packaging coatings market size in 2025, owing to two decades of VOC curbs. These dispersions cure at 150–200°C, leveraging surfactant-stabilized polymer particles that coalesce as water evaporates. Solvent-based systems retreat to niche aerosol uses where rapid flash-off is essential. Powder coatings, exemplified by PPG’s Hoba line for monobloc aerosols, deliver zero VOCs but require high cure temperatures, limiting use to caps and thicker-gauge cans.
UV-curable and electron-beam platforms represent the fastest-growing slice, advancing at 5.11% CAGR as canmakers chase energy savings and faster changeovers. Their sub-second cure eliminates ovens, trimming floor space, and carbon output. Adoption is strongest in craft beverages, personal-care aerosols, and digitally printed cans, where thermal exposure must be minimized.
By Packaging Type: Rigid Formats Dominate While Flexible Gains Ground
Rigid formats, beverage cans, caps, and closures, held 60.54% of market volume in 2025, powered by recyclability rates exceeding 70% in several major economies. Massive investments such as Baosteel Packaging’s 800 million-can plant in Vietnam and AGI Greenpac’s 950 million-can facility in India underpin volume growth and reinforce regional supply chains. Caps and closures command premium pricing due to tamper-evidence and e-grocery durability requirements.
Flexible metal packaging, though smaller, is growing at a 4.86% CAGR as brands pursue light-weighting and refill-ready pouch systems. Polyurethane and acrylic coatings that maintain flexibility during form-fill-seal operations are critical. Siegwerk’s CIRKIT barrier layers aim to make laminated pouches compatible with mechanical or chemical recycling, yet broad infrastructure gaps temper near-term penetration.
By Application: Beverage Cans Lead, Aerosol and Tubes Diversify
Beverage cans accounted for a 48.56% share of the packaging coatings market size in 2025 and will expand at a 4.99% CAGR through 2031. Craft beer, energy drinks, and hard seltzers drive SKU proliferation that favors high-definition graphics and rapid varnish curing. Food cans remain a bedrock for acidic and retort foods, leveraging non-BPA internal sprays optimized for pH extremes.
Aerosol cans and aluminum tubes diversify growth through personal-care, household, and pharmaceutical launches that demand coatings resistant to hydrocarbon propellants and sterilization. Sherwin-Williams’ valPure polyester line and Sonoco’s high-impact lithography provide aesthetic and functional upgrades that command higher margins than commodity beverage cans.
By End-User Industry: Food & Beverage Dominate, Healthcare Accelerates
Food and beverage producers consumed 61.29% of coating volumes in 2025, reflecting staple demand for canned foods and carbonated drinks. BPA bans intensify cooperation among canmakers, coatings suppliers, and brand owners to validate acrylic and polyester liners.
Healthcare and pharmaceuticals represent the fastest-growing end-use at 5.35% CAGR as unit-dose aerosol inhalers and tamper-evident tubes proliferate. Coatings must endure gamma or EO sterilization without leaching, steering buyers toward polyester and acrylic chemistries that meet FDA 21 CFR 175.300 and ISO 11607. Personal-care, cosmetics, and industrial goods round out demand with specialized needs for tactile finishes or chemical resistance.
Geography Analysis
Asia-Pacific accounted for 43.75% of the market in 2025 and is projected to advance at a 4.79% CAGR to 2031. China’s tightening VOC rules are escalating the shift to powder and water-based lines, while Vietnam and India host mega-scale can plants that anchor regional supply. Japan’s recycle rate of 73.9% and collaborations on 100% recycled-content cans position the nation as a circular-economy test bed. Southeast Asian markets including Indonesia, Thailand, and Malaysia benefit from rising disposable incomes and multinational beverage expansions.
North America’s demand is propelled by a flourishing craft beverage ecosystem and statewide VOC norms stricter than federal thresholds. Investments in UV-curable lines and technical service hubs support rapid SKU turnover. Mexico’s cost advantages under USMCA are spurring coatings production for both domestic and US export channels.
Europe’s share is driven by Regulation 2024/3190, which bans BPA and accelerates polyester and acrylic adoption. AkzoNobel’s EUR 32 million bisphenol-free capacity expansion exemplifies supplier readiness. The U.K.’s recyclability scoring system pressures brands to select coatings compatible with closed-loop metal recovery, further reshaping the regional product mix.

Regulatory Landscape
Regulatory attention is increasingly focused on food-contact safety, chemical restrictions, and packaging circularity, with the EU setting compliance timelines that flow directly into can, closure, and paperboard coating formulations. Regulation (EU) 2024/3190 prohibits BPA in food-contact coatings from January 20, 2025, with transitional deadlines ending in July 2026 for beverage cans and January 2028 for other metal formats. This sequencing accelerates substitution toward BPA-non-intent acrylic, polyester, and polyolefin systems.
In parallel, the Packaging and Packaging Waste Regulation (PPWR), Regulation (EU) 2025/40, applies from August 12, 2026 and adds manufacturer-facing obligations such as Declaration of Conformity and heightened scrutiny of substances used in packaging, reinforcing documentation and traceability requirements across the coatings supply base. Beyond BPA, compliance is tightening around restricted substances and additive packages used in packaging coatings. REACH Annex XVII restrictions taking effect in 2026, including curbs on certain phthalates and PFAS-related chemistries referenced in regulatory updates, further narrow the formulation toolbox and increase the need for SVHC communication across imported packaging components. In the United States, the FDA Food Contact Notification pathway continues to shape market access for new polymer systems used in food-contact coatings, with multiple FCNs becoming effective in 2026 for materials used in coated food-contact articles. This supports commercialization of alternative chemistries and keeps qualification and migration-testing central in brand-owner and canmaker purchasing decisions.
Value Chain Analysis
The value chain runs from upstream feedstocks and additives, including epoxy, acrylic, polyester, and polyolefin resins, crosslinkers, pigments, surfactants, and specialty additives, to formulation and coating manufacture by coatings suppliers. These layers are then applied at converters and canmakers, including via spray, roller, or coil-coating lines, before qualification by brand owners and packers under food-contact and recyclability requirements. EU PPWR (Regulation (EU) 2025/40), applicable from August 12, 2026, is becoming a structural input into this chain because it increases compliance workload, including documentation, substance limits, and recyclability constraints, that flows from brand owners to coating formulators and upstream raw-material suppliers. That shifts value toward validated low-migration, PFAS-alternative, and BPA-non-intent platforms.
Operationally, the chain remains sensitive to petrochemical-linked cost movements and qualification lead times. Volatility in key raw materials and intermediates restricts pricing agility for smaller formulators, while larger players rely on technical service, labs, and broader portfolios to speed customer approvals when reformulations are triggered by rules such as BPA bans and REACH restrictions. Innovation and scale infrastructure also sit inside the chain. For example, Dow operates a packaging science and sustainability center in Midland, Michigan focused on packaging-related materials work, while converters and brand owners increasingly request supplier data packs, including migration, recyclability compatibility, and declarations, to keep packaging lines running through regulatory transition windows.
Competitive Landscape
The Packaging Coatings market is moderately fragmented. Regional specialists such as Siegwerk and DIC are expanding through targeted investments: Siegwerk’s INR 350 crore upgrade of its Indian Graphics Innovation and Competence Center boosts color-matching speed for short runs, while DIC’s HACCP-certified Jakarta plant focuses on direct food-contact coatings for Southeast Asia. White-space lies in healthcare packaging and refillable metal formats, segments that couple stringent regulatory demands with above-average margins. Suppliers adept at integrating low-migration chemistries, sterilization resistance, and circular-design principles are poised for premium growth.
Packaging Coatings Industry Leaders
Akzo Nobel N.V.
PPG Industries, Inc.
The Sherwin-Williams Company
Axalta Coating Systems, LLC
Kansai Paint Co., Ltd.
- *Disclaimer: Major Players sorted in no particular order

Market Opportunities and Future Outlook
A primary opportunity sits in reformulation and requalification programs tied to EU compliance milestones, particularly the PPWR application date of August 12, 2026 and the BPA prohibition timeline under Regulation (EU) 2024/3190 with the July 2026 beverage-can transition endpoint. These dates are pushing active product substitution toward BPA-non-intent and PFAS-alternative systems in metal packaging, and toward functional barrier coatings that help preserve recyclability in fiber-based formats. Named capacity and capability moves reinforce this whitespace: Sherwin-Williams completed a major expansion at its Tournus, France site to increase output of valPure V70 non-BPA epoxy coatings, and PPG introduced new PVC-NI interior-coating capability for pet food can applications in the United States, underscoring the premium attached to compliant, performance-validated interior systems.
A second opportunity involves faster-to-qualify, lower-energy curing and precision development platforms that cut changeover time for short runs while meeting tightening chemical and migration expectations. Evonik upgraded UV-curable coating equipment at its Shanghai Innovation Park in June 2026 to improve formulation-testing precision and to support LED curing technology adoption, aligning with the market shift toward rad-cure and other energy-efficient pathways highlighted by canmakers and craft beverage requirements. On the packaging-user side, expansion in higher-regulation end uses supports specialty coatings demand: Amcor opened a USD 35 million healthcare packaging facility in Subang Jaya, Malaysia (April 2026) featuring coating technology upgrades, creating a concrete pull for low-extractables, sterilization-tolerant, and traceable coating systems used in medical and pharmaceutical packaging components.
Recent Industry Developments
- April 2026: PPG launched PPG NUTRISHIELD MAX PPG7590, described as the first aluminum coil-applied, single-component, PVC-NI interior coating for pet food cans in the United States. The launch broadens compliant interior-lining options for sensitive food applications and supports coil-coating productivity by simplifying application and curing workflows.
- November 2025: AkzoNobel introduced its Accelshield BPAni coatings range to the Brazilian beverage market. The move expands regional availability of bisphenol-free can-lining solutions and strengthens supplier positioning as brand owners and canmakers standardize BPA-non-intent specifications across geographies.
- October 2024: Sherwin-Williams completed a major expansion at its Tournus, France manufacturing site, increasing production capacity by around 70% to produce valPure V70 non-BPA epoxy coatings. The added capacity tightens supply assurance in Europe during BPA transition timelines and supports faster customer qualification by increasing local manufacturing scale.


Research Methodology Framework and Report Scope
Market Definition and Coverage
This market covers protective and functional coatings that are applied on packaging surfaces to improve barrier performance, chemical resistance, and appearance, across rigid and flexible packaging formats. Values are measured in revenue terms for coatings used on packaging substrates.
Scope exclusions: We exclude standalone printing inks with no protective layer role, lamination adhesives, and architectural or decorative paint demand that is not tied to packaging use.
Segmentation Overview
- By Resin
- Epoxies
- Acrylics
- Polyurethane
- Polyolefins
- Polyester
- Other Resins
- By Coating Technology
- Water-based
- Solvent-based
- Powder
- UV curable
- By Packaging Type
- Rigid (Cans, Caps and Closures)
- Flexible (Pouches, Films, Sachets)
- By Application
- Food Cans
- Beverage Cans
- Aerosol and Tubes
- Caps and Closures
- Industrial and Specialty Packaging
- By End-User Industry
- Food and Beverage
- Personal Care and Cosmetics
- Healthcare and Pharmaceutical
- Industrial Goods
- By Geography
- Asia-Pacific
- China
- India
- Japan
- South Korea
- Indonesia
- Malaysia
- Thailand
- Vietnam
- Rest of Asia-Pacific
- North America
- United States
- Canada
- Mexico
- Europe
- Germany
- United Kingdom
- France
- Italy
- Spain
- Nordics
- Turkey
- Russia
- Rest of Europe
- South America
- Brazil
- Argentina
- Colombia
- Rest of South America
- Middle East and Africa
- Qatar
- United Arab Emirates
- Nigeria
- Egypt
- South Africa
- Rest of Middle East and Africa
- Asia-Pacific
Data Sources, Market Sizing, and Validation
Desk Research
Desk research starts with public packaging activity indicators, which helps set realistic demand pools before revenue is modeled. We mainly lean on sources such as national statistics agencies for manufacturing output, customs and trade statistics for coated-material flows, and trade bodies that publish packaging production trends for metal cans and flexible packaging. Regulatory and safety direction (for example, migration limits and BPA-related updates) is also tracked through official regulator publications.
To make the inputs usable for sizing, public company annual reports, investor presentations, and credible press are reviewed for coating mix, end-market exposure, and any capacity or expansion mentions. Patent databases are used to map where technology is moving, including water-based and UV/EB-curable systems and alternatives to legacy chemistries. An import-export shipment-level database is also used selectively to sanity-check major cross-border movements of relevant chemical and coating categories. The sources listed here are illustrative only, and many other public and paid references were also consulted to collect, cross-check, and clarify data points.
Primary Interviews and Surveys
Primary work is used to pressure-test the desk assumptions with people who see pricing, specification shifts, and packaging format changes in real time. We speak with a balanced mix of coating formulators, packaging converters, brand-facing packaging teams, and distribution side experts across APAC, EMEA, and the Americas, so the model reflects different substrate mixes, regulatory constraints, and adoption speed for water-based and rad-cure systems.
Distribution of primary research fieldwork respondents
| Company type | Respondent position | Region |
|---|---|---|
| Top tier: 31% | CXOs: 12% | APAC: 45% |
| Mid tier: 53% | Functional/Unit leaders: 35% | EMEA: 31% |
| Smaller Players: 16% | Managers: 53% | Americas: 24% |
Market-Sizing & Forecasting
The sizing starts with a top-down build where packaging output signals are reconstructed into coating demand pools, and then value is formed using practical pricing logic by substrate and technology. For packaging coatings, the key demand anchors used in our model include metal can production trends, flexible packaging film and paperboard output, the mix shift toward BPA-free or low-migration systems, and the pace of water-based and UV/EB adoption in packaging lines. When these demand indicators are translated into realistic coating consumption, the market total is priced in USD only after that step.
Selective bottom-up checks are then used to corroborate and adjust totals, such as sampled average selling prices by coating type, supplier revenue exposure to packaging, and channel checks on typical coating weights and specification upgrades. Where bottom-up signals are incomplete, gaps are handled by applying conservative penetration ranges agreed in interviews, followed by sensitivity checks so no single assumption drives the full outcome.
For forecasting, scenario analysis is used and is linked to a small set of variables that experts could validate, such as packaging volume growth, substitution away from solvent-based systems, regulatory tightening that accelerates reformulation cycles, and input-cost pass-through patterns that influence realized pricing. The final forecast path is reviewed against the observed pace of technology transitions in packaging coatings, so the curve stays realistic rather than being purely trend-fitted.
Data Validation & Update Cycle
Validation happens in several steps so that outliers are caught early. Model outputs are compared against independent signals such as packaging production changes, trade movement direction, and the implied coating spend per unit of packaging, and then the largest variances are investigated until the story and math agree.
Before sign-off, the work is reviewed by another analyst, and any large swings versus the prior edition or against major public indicators triggers re-checks and, where needed, quick re-contacts with primary respondents. Reports are refreshed annually, with interim updates when material events occur, such as a major regulatory change or a sharp shift in feedstock pricing. Right before delivery, a final sweep is done so clients receive the most current view that can be supported by traceable inputs.
Mordor Intelligence's Packaging Coatings Market Estimate Compared With Other Published Estimates
Published market sizes for packaging coatings often differ because each publisher draws the line around what counts as a packaging coating, and then applies a different pricing and base-year approach. Some studies also choose a different time window for "current year," which can shift values even if the long-term growth rate looks similar.
The table shows a noticeable spread versus the baseline, and in Mordor Intelligence's model, only coatings that serve a protective or functional role on packaging substrates are counted, while printing inks without that protective function and lamination adhesives are kept outside the scope. Differences also come from how average selling prices are progressed (flat versus step-ups from reformulation and compliance shifts) and from currency timing, since some publishers use a single conversion point while others blend multi-month averages.
Benchmark comparison
| Source | Market Size | Gaps in Research Methodology |
|---|---|---|
| Mordor Intelligence | USD 6.21 B (2025) | |
| Trade Journal A | USD 4.41 B (2025) | Uses a narrower revenue pool that appears closer to flexible packaging coatings only, and applies base-year pricing that is less sensitive to compliance-led reformulation premiums. |
| Global Consultancy B | USD 5.51 B (2025) | Anchors the model on a 2024 base and carries forward a smoother pricing curve, which can understate step changes from technology shifts and regulatory-driven product upgrades. |
Taken together, the comparison points to scope boundaries and price progression as the two practical reasons estimates diverge the most. By keeping demand anchors tied to packaging output and then cross-checking with interview-backed pricing and penetration ranges, the resulting number remains transparent and repeatable for planning use.


Key Questions Answered in the Report
What is the current and future value of the packaging coatings market?
The Packaging Coatings Market size is expected to grow from USD 6.21 billion in 2025 to USD 6.49 billion in 2026 and is forecast to reach USD 8.12 billion by 2031 at a 4.56% CAGR over 2026-2031.
Which resin type holds the largest share in packaging coatings?
Epoxy chemistries commanded 51.67% of global share in 2025 thanks to proven adhesion and barrier performance.
Why are UV-curable coatings gaining popularity in metal packaging?
UV systems cure in under one second, cut oven energy use by up to 85%, and suit the short runs common in craft beverages and customized cans.
Which region leads demand for packaging coatings?
Asia-Pacific generated 43.75% of the global market in 2025 and is on track to expand at a 4.79% CAGR through 2031.
How will BPA regulations affect the coatings supply chain?
EU and state-level bans are accelerating a shift from epoxy-phenolic liners to acrylic and polyester alternatives, prompting sizable supplier investments in bisphenol-free capacity.
Page last updated on:


