
OT Asset Intelligence Market Size and Share
Market Overview
| Study Period | 2021 - 2032 |
|---|---|
| Market Size (2027) | USD 5.58 Billion |
| Market Size (2032) | USD 13.64 Billion |
| Growth Rate (2027 - 2032) | 19.56 % |
| Fastest Growing Market | Asia-Pacific |
| Largest Market | North America |
| Market Concentration | Medium |
Major Players *Disclaimer: Major Players sorted in no particular order Image © Mordor Intelligence. Reuse requires attribution under CC BY 4.0. | |
OT Asset Intelligence Market Analysis by Mordor Intelligence
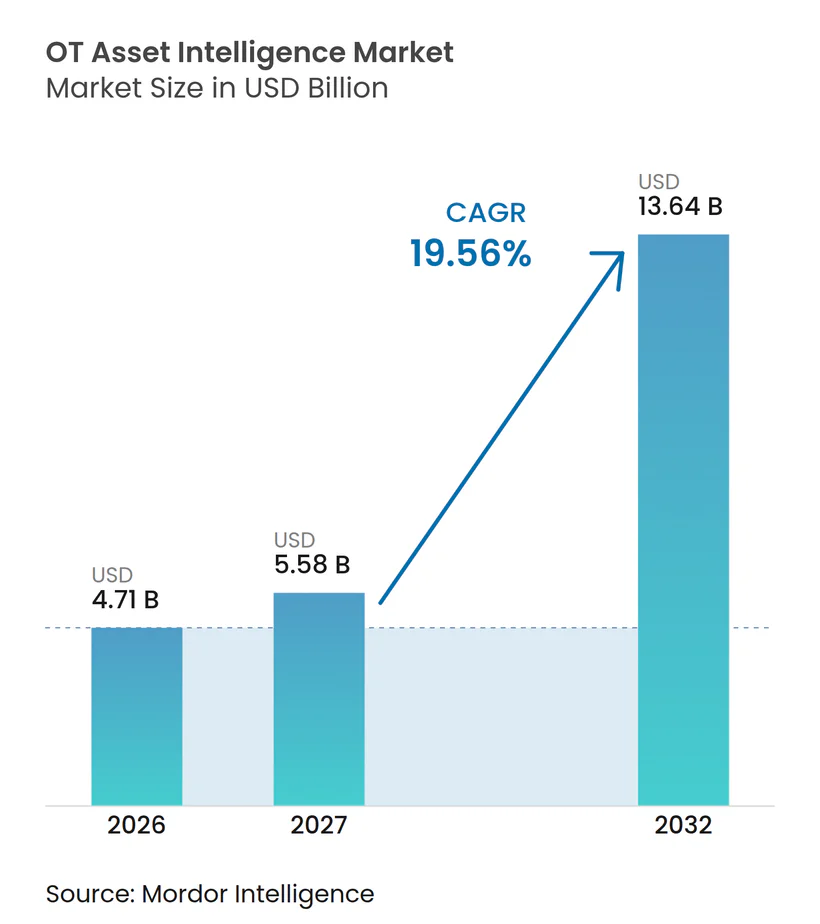
The OT asset intelligence market size is USD 4.71 billion in 2026 and is forecast to reach USD 13.64 billion by 2032, growing at a CAGR of 19.56% from 2027 to 2032. Demand is rising because connected industrial assets are joining enterprise networks faster than many operators can identify, document, and protect them. The OT asset intelligence market supports continuous device discovery, asset context, and risk prioritization, where procurement teams report weak confidence in OT and IoT threat detection. Asset visibility is becoming a practical requirement for network segmentation, incident response, vulnerability management, and evidence of compliance. Competitive activity is also moving the OT asset intelligence market toward broader security, automation, and workflow platforms, while industrial buyers continue to balance cloud analytics against plant-level control and data requirements.
Key Report Takeaways
- By component, software held 67.18% of the OT asset intelligence market share in 2026, while services are projected to expand at a 21.15% CAGR through 2032.
- By deployment mode, on-premises held 65.29% of the OT asset intelligence market share in 2026, while cloud is projected to expand at a 21.48% CAGR through 2032.
- By application, asset inventory management held 51.49% of the OT asset intelligence market share in 2026, while threat detection and response is projected to expand at a 20.86% CAGR through 2032.
- By organization size, large enterprises held 71.10% of the OT asset intelligence market share in 2026, while small and medium enterprises are projected to expand at a 21.81% CAGR through 2032.
- By end-user industry, industrial manufacturing held 28.41% of the OT asset intelligence market share in 2026, while water and wastewater is projected to expand at a 20.19% CAGR through 2032.
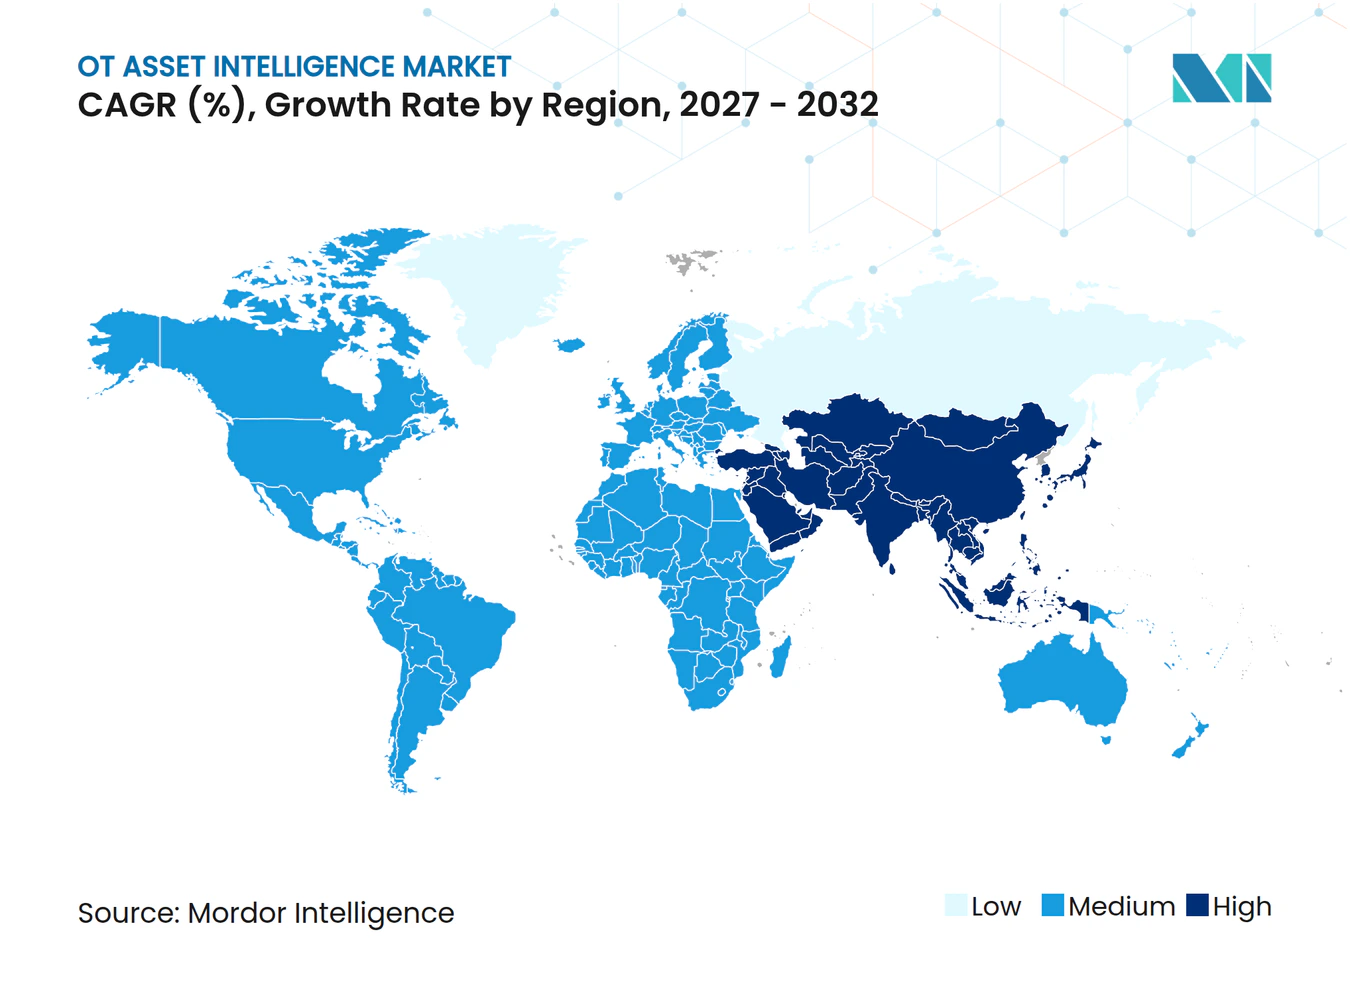
- By geography, North America held 35.66% share in 2026, while Asia-Pacific is projected to expand at a 20.54% CAGR through 2032.
Note: Market numbers in this report are based on Mordor Intelligence's proprietary estimation framework, which combines nine months of actuals with Q4 projections for base year 2026.
Global OT Asset Intelligence Market Trends and Insights
Drivers Impact Analysis*
| Driver | (~) % Impact on CAGR Forecast | Geographic Relevance | Impact Timeline |
|---|---|---|---|
| IT-OT Convergence and Connected Industrial Assets | +5.2% | Global | Long term (≥ 4 years) |
| Cyberattacks Against Critical Infrastructure | +4.8% | North America and Europe, with spillover to Asia-Pacific and Middle East | Short term (≤ 2 years) |
| Regulatory Mandates for Continuous Asset Visibility | +3.6% | North America and Europe primarily, national mandates emerging in Asia-Pacific | Medium term (2-4 years) |
| Industrial Digital Transformation and Predictive Maintenance | +3.1% | Asia-Pacific core, followed by North America and Europe | Long term (≥ 4 years) |
| Protocol-Aware Discovery of Legacy and Unmanaged Assets | +2.0% | Global, most acute in brownfield-heavy Europe and North America | Medium term (2-4 years) |
| Asset Contextualization for Safer Brownfield Modernization | +1.5% | North America and Europe, with early gains in Japan, South Korea, and Germany | Long term (≥ 4 years) |
| Source: Mordor Intelligence | |||
IT-OT Convergence and Expansion of Connected Industrial Assets
IT-OT convergence makes a dependable asset inventory necessary before organizations can segment networks, prioritize vulnerabilities, report compliance, or respond to incidents. ISACA stated that the combined IT-OT market is on track to reach USD 1 trillion by 2030, underscoring the scale of integration across manufacturing, oil and gas, utilities, and transportation. Trustwave found that people outside line-specific OT engineering teams often do not fully understand the function of OT assets. Field engineers, original equipment manufacturers, and remote-monitoring projects can add devices without a complete, up-to-date baseline. The OT asset intelligence market, therefore, addresses a gap that grows as plants connect more controllers, distributed control systems, human-machine interfaces, and edge gateways.
Escalating Cyberattacks Against Critical Infrastructure
OT-focused threats are shifting from opportunistic access toward deliberate disruption of industrial operations. Dragos identified 26 OT-focused threat groups worldwide and reported that 11 were active during 2025, including SYLVANITE, AZURITE, and PYROXENE. The same report identified 119 ransomware groups targeting industrial organizations in 2025, up from 80 in 2024, while attacks against industrial organizations increased by 64% year over year. CISA reported Iranian-affiliated actors modifying programmable logic controller logic to turn off shutdown and alarm functions and falsify human-machine interface displays at United States water, energy, and government facilities. These events make complete asset records essential because a device cannot be patched, segmented, or recovered if it has not been identified.
Regulatory Mandates for Continuous Asset Visibility
Regulatory requirements are shifting OT asset intelligence from a voluntary security practice toward a documented compliance obligation. NERC’s 2026 CIP Roadmap noted that much generation, transmission, and grid-balancing OT remains outside medium- and high-impact CIP coverage. The roadmap supported work on internal network security monitoring through CIP-015-2, which was filed with FERC in February 2026. ENISA’s 2025 guidance directs entities to use automated discovery and asset-tracking tools and recognizes configuration settings for asset-management tools as evidence of compliance. These requirements broaden demand among industrial firms that need evidence for NIS2, IEC 62443, ISO 27001, and related procurement reviews.
Industrial Digital Transformation and Predictive Maintenance
Predictive maintenance relies on a continuous, accurate, and contextualized record of operational assets. IBM’s Maximo Application Suite AI Service Component version 9.2.0 and Siemens’ Industrial Copilot depend on asset information such as firmware versions, calibration histories, and communication paths. Industrial AI programs also require reliable operational data before their outputs can support plant decisions. Industrial operators cannot apply these tools effectively when their device data is incomplete or disconnected across plant systems. The OT asset intelligence market provides asset-level information that links maintenance priorities to equipment condition and role. This need creates demand beyond cybersecurity programs because uptime, safer operations, and maintenance planning also require an established data foundation.
Restraints Impact Analysis*
| Restraint | (~) % Impact on CAGR Forecast | Geographic Relevance | Impact Timeline |
|---|---|---|---|
| High Brownfield Integration and Deployment Costs | -1.8% | Global, most acute in Middle East and Africa, South America, and cost-constrained Asia-Pacific markets | Long term (≥ 4 years) |
| Operational Disruption Risk During Discovery Deployment | -1.2% | Global | Medium term (2-4 years) |
| Proprietary Protocol and Interoperability Fragmentation | -0.9% | Global, amplified in legacy-heavy Europe and North America | Long term (≥ 4 years) |
| Incomplete Ownership of Plant-Level Asset Data | -0.6% | Global, most acute in Middle East and Africa and South America | Medium term (2-4 years) |
| Source: Mordor Intelligence | |||
High Brownfield Integration and Deployment Costs
Existing industrial facilities can require substantial work before asset intelligence tools deliver full coverage. Older control assets often run on serial connections or proprietary protocols, making integration more demanding than deployment in a new facility. The supplied analysis placed the fully loaded cost for an 8-machine retrofit across 2 production lines at USD 150,000 to USD 250,000 for the first site. This cost includes hardware, software licenses, and integration labor, while original equipment manufacturer contracts can limit changes to network topology. Long project timelines and limited OT security budgets can delay purchasing decisions before operators reach a return-on-investment discussion.
Operational Disruption Risk During Discovery Deployment
Active scanning can pose operational concerns in environments with older programmable logic controllers and network modules. Many facilities continue to carry live production traffic on serial DNP3, Modbus, and unauthenticated CIP connections. NIST identified safe, non-disruptive OT asset discovery as a technical challenge that still requires reference architectures.[1] Passive discovery reduces the chance of disruption, but it can miss devices that do not generate network traffic. Coordination with plant operations teams adds time to deployments because production continuity remains their primary responsibility.
*Our forecasts treat driver/restraint impacts as directional, not additive. The impact forecasts reflect baseline growth, mix effects, and variable interactions.
Segment Analysis
By Component: Software Leads as Services Scale Rapidly
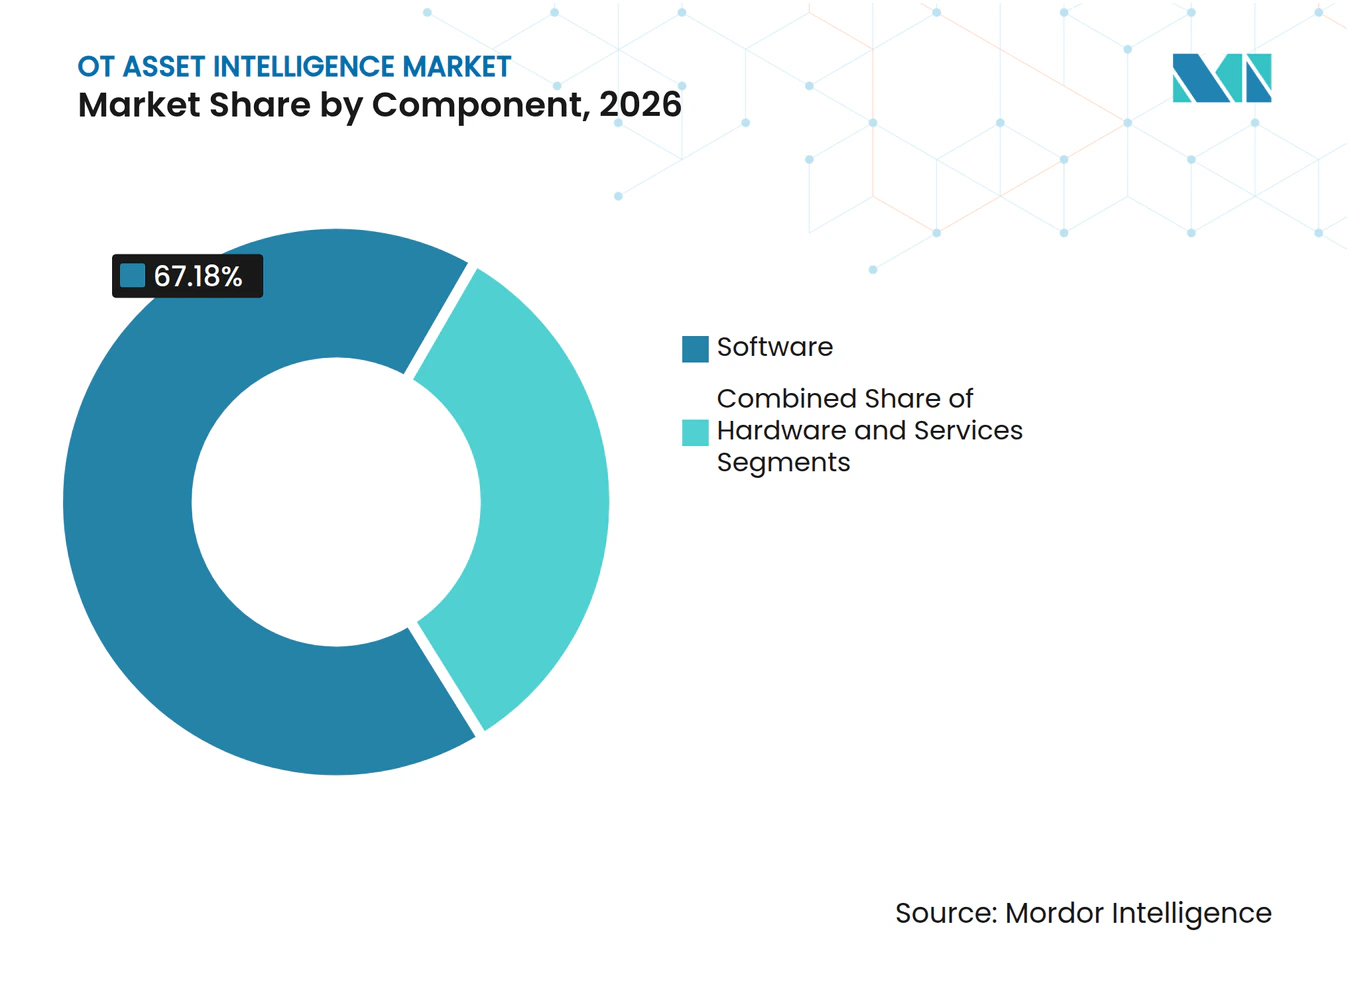
Software held 67.18% of the OT asset intelligence market share in 2026. This position reflects demand for platforms that provide continuous asset context, vulnerability enrichment, and threat correlation. Subscription delivery lets providers update device fingerprint libraries, protocol parsers, and threat indicators without a site visit. That capability matters in plants where maintenance and system-change windows occur only at scheduled intervals. Hardware remains relevant for passive network taps and industrial security sensors in air-gapped or segmented environments.
Services are projected to expand at a 21.15% CAGR from 2027 to 2032, the fastest rate within the component split. Organizations use service providers for discovery, system integration, and ongoing monitoring when they lack expertise in OT protocols. Forescout reported that 49% of respondents identified vulnerability prioritization as their most labor-intensive security task. Claroty introduced Claire in May 2026 as a cyber-physical systems-native AI security agent that links real-time asset context with threat intelligence.[2] The release shows how the category is extending from passive inventory toward operational intelligence.



By Deployment Mode: On-Premises Anchors as Cloud Gains Momentum
On-premises deployments accounted for 65.29% of the OT asset intelligence market size in 2026. Data sovereignty rules, original equipment manufacturer conditions, and air-gap policies can prevent operational data from leaving the plant. Energy, oil and gas, and defense-adjacent manufacturing often maintain this approach because they manage sensitive production systems. The share indicates that migration timing remains a major constraint even where cloud capabilities are available. Hybrid architectures are gaining relevance because they retain raw operational data on-site while directing selected metadata and telemetry to cloud analytics.
Cloud deployment is projected to expand at a 21.48% CAGR from 2027 to 2032. The cloud option can provide centralized analytics for large, multi-site OT estates without requiring every operating site to rebuild its networks. Forescout’s March 2026 4D Platform update added cloud-native, agentless segmentation for hybrid IT, OT, IoT, and IoMT environments. The company stated that the platform supported identity- and attribute-driven zone modeling without network redesign. This approach can reduce onboarding time while preserving plant-level restrictions.
By Application: Inventory Management Underpins All Else as Threat Response Scales
Asset inventory management accounted for 51.49% of the OT asset intelligence market size in 2026. An accurate device register is required before vulnerability assessment, compliance reporting, and detection workflows can work reliably. CISA’s asset inventory guidance describes inventory as a foundation for cybersecurity practices across critical infrastructure. Inventory tools record the identity, role, connection, and exposure of controllers and related assets. This use case remains central because it establishes the baseline for all subsequent security decisions.
Threat detection and response is projected to expand at a 20.86% CAGR from 2027 to 2032. Dragos stated that 25% of ICS vulnerabilities had incorrect CVSS scores, underscoring the need to assess exposure in an asset’s operating context. Vulnerability assessment and compliance management evolve alongside inventory, as regulations require documented evidence of risk and remediation. Network monitoring, anomaly detection, and secure remote access are increasingly included in broader platforms. Forescout found that 57% of respondents used more than 3 separate visibility tools, creating pressure to reduce fragmented tool sets.
By Organization Size: Large Enterprises Dominate as SMEs Enter at Scale
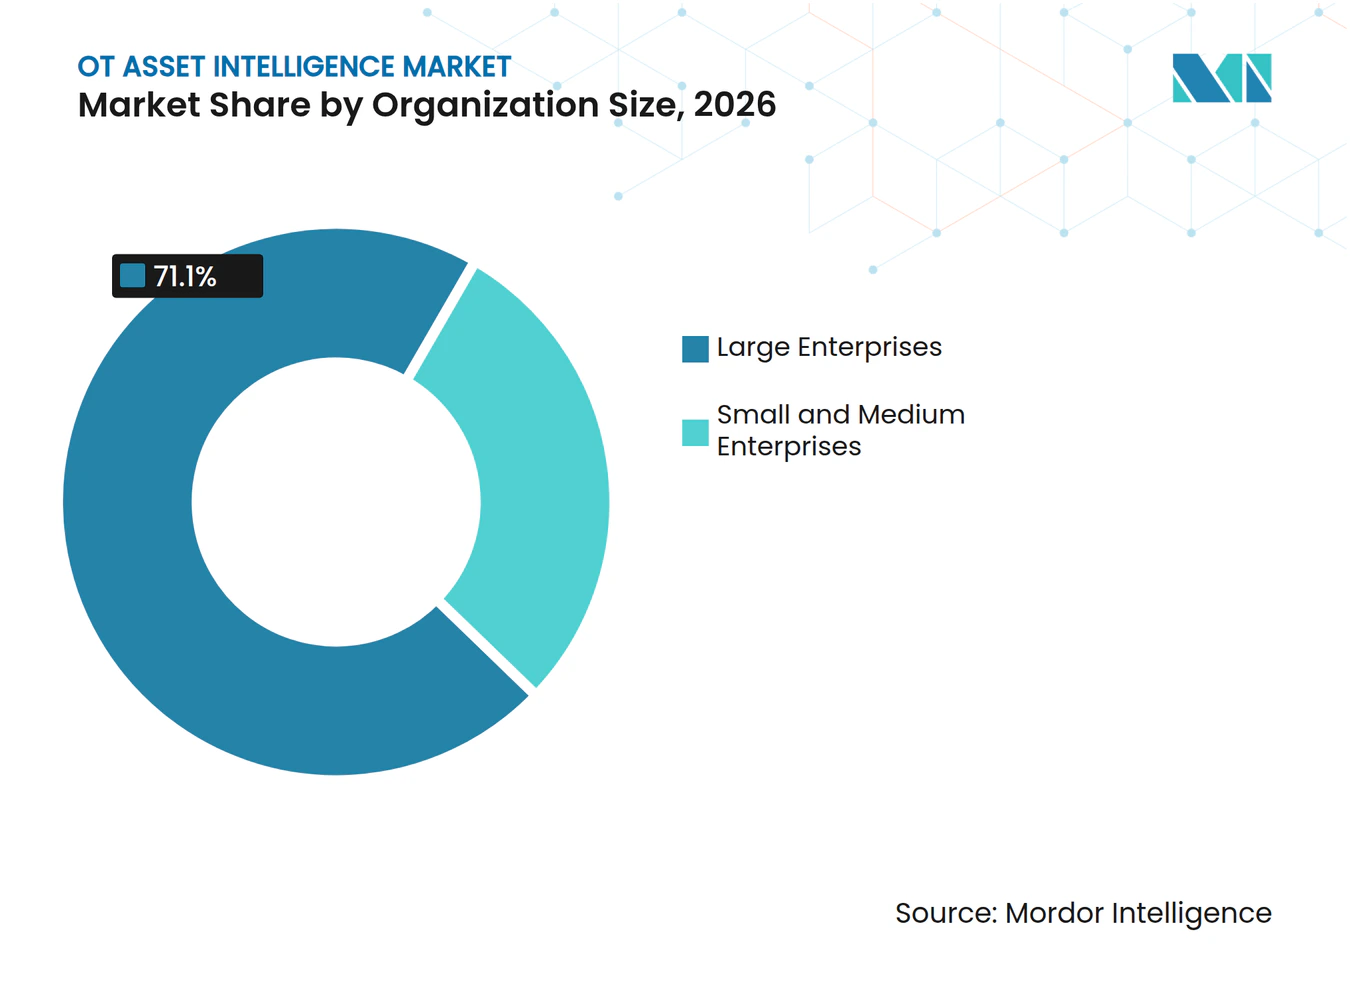
Large enterprises held 71.10% of the market share in 2026. Multi-site OT estates, dedicated cybersecurity budgets, and formal governance structures support deployment across varied industrial environments. Large operators also have a stronger need to coordinate visibility across plants, networks, and security teams. Their scale supports purchases of integrated platforms and specialized managed services. The OT asset intelligence industry, therefore, has its largest installed base among organizations with complex operational footprints.
Small and medium enterprises are projected to expand at a 21.81% CAGR from 2027 to 2032. Supply-chain obligations under NIS2 can bring OT-dependent suppliers into security programs before they would otherwise invest in them. This is especially relevant for price-sensitive industrial companies that need a practical starting point for asset discovery. Tenable launched VM-Native OT Discovery in April 2026 within Tenable One, describing it as providing OT and IoT discovery without additional IT overhead. Lower-friction tools can help smaller operators adopt visibility capabilities without a large infrastructure project.

By End-User Industry: Manufacturing Anchors Demand as Water Sector Accelerates
Industrial manufacturing accounted for 28.41% of the market share in 2026. Manufacturers operate dense populations of OT devices and face direct financial consequences when production stops unexpectedly. Industry 4.0 programs are also connecting production systems with enterprise processes at a faster pace. Mitsubishi Electric completed its acquisition of Nozomi Networks in 2025 at a USD 950 million valuation, linking OT visibility with industrial automation capabilities. Manufacturing, therefore, remains the largest end-user base for the OT asset intelligence market.
Water and wastewater are projected to expand at a 20.19% CAGR from 2027 to 2032. The FBI and EPA warned in July 2026 that malicious actors were targeting internet-facing programmable logic controllers in water and wastewater systems. CISA issued related guidance for the sector on the same date. Energy and utilities, oil and gas, and transportation and logistics also create demand because their assets are highly critical. Healthcare, life sciences, chemicals, and petrochemicals drive demand, while passive discovery helps preserve process safety.
Geography Analysis
North America held 35.66% of the OT asset intelligence market share in 2026. The region combines dense critical infrastructure, mature cybersecurity procurement, and compliance obligations that make asset visibility a practical requirement. FERC approved 11 modified NERC CIP reliability standards in March 2026, supporting utility modernization around virtualization and new technologies. NERC also identified a large population of generation and transmission OT outside higher-impact CIP coverage. The United States leads regional demand, while Canada’s energy sector contributes additional opportunities.
Europe is shaped by NIS2 requirements that cover energy, transport, water, and manufacturing environments. ENISA guidance links risk-management evidence with asset discovery and tracking practices.[3] Germany’s manufacturing and chemical sectors are major country-level sources of demand because compliance requires reliable asset records. The June 30, 2026, audit deadline accelerated procurement among small and medium-sized industrial enterprises. The United Kingdom, France, and Italy make up the next tier of European demand, supported by sector-specific security requirements.
Asia-Pacific is projected to expand at a 20.54% CAGR from 2027 to 2032. China’s Industrial Internet of Things program, India’s expansion of smart manufacturing, and Japan’s factory-security focus support regional demand. South Korea’s semiconductor and automotive clusters and Australia’s energy and mining sectors also require stronger OT visibility. South America’s opportunity is linked to Brazil’s energy and agribusiness systems. Saudi Arabia and the United Arab Emirates support demand in the Middle East through oil and gas modernization, while South Africa and Nigeria lead early adoption in energy and utilities across Africa.
Competitive Landscape
Market Concentration
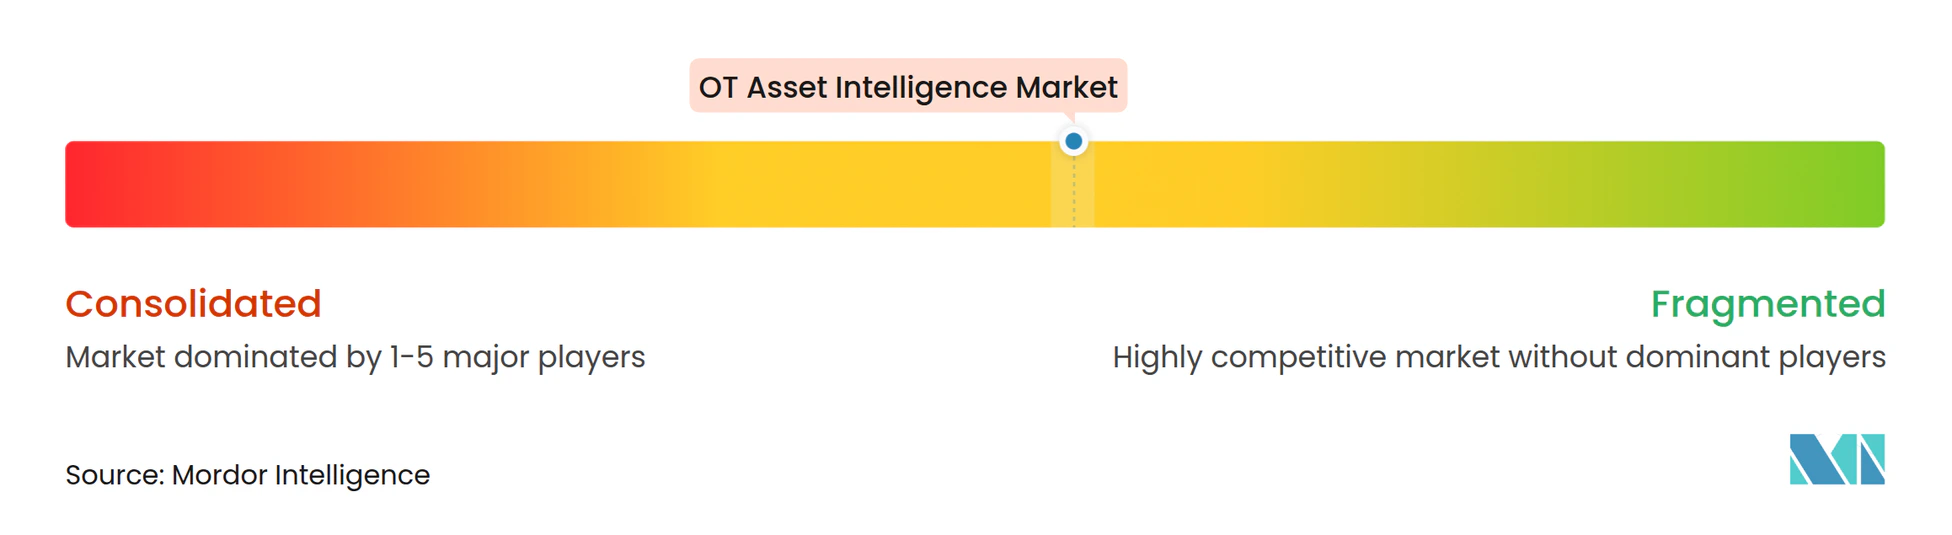
The OT asset intelligence market is consolidating as larger companies bring visibility into broader technology portfolios. ServiceNow announced an agreement to acquire Armis for USD 7.75 billion, adding asset intelligence to its workflow platform. Mitsubishi Electric acquired Nozomi Networks for USD 950 million, linking OT visibility with industrial automation. Accenture announced agreements for a majority stake in Dragos and to acquire runZero and NetRise for a combined enterprise value of USD 4.175 billion.[4] These transactions indicate that asset intelligence is increasingly bundled with workflow automation, industrial automation, and professional services.
Claroty and the Dragos portfolio are key specialist platforms in the upper end of the category. Claroty secured USD 150 million in Series F funding in January 2026 and reported an 80% increase in valuation since its March 2024 financing. TXOne Networks, Radiflow, OPSWAT, Industrial Defender, SIGA OT Solutions, and OTbase compete by focusing on vertical markets and specific OT deployment needs. Forescout positions asset intelligence as an entry point into broader network security and zero-trust access. Providers that combine visibility with prioritization and operational workflows can address buyer demand for fewer disconnected tools.
Recent transactions make direct company-share comparisons less useful because platform ownership is changing quickly. The draft does not provide a combined share for leading suppliers, so no concentration calculation based on actual supplier share is available. Buyers can choose among specialist OT vendors, broader security suppliers, industrial automation companies, and services-led providers. This variety preserves competitive choice, even as high-value acquisitions increase the resources behind leading platforms. Companies must still show safe discovery, coverage of legacy protocols, and practical integration with plant operations to win deployments.
OT Asset Intelligence Industry Leaders
-
Claroty Ltd.
-
Nozomi Networks Inc.
-
Forescout Technologies, Inc.
-
Dragos, Inc.
-
Armis, Inc.
- *Disclaimer: Major Players sorted in no particular order
Recent Industry Developments
- September 2026: Dragos completed the acquisitions of runZero and NetRise following Accenture's close of its majority investment. The combined platform now spans IT, OT, cloud, software supply chain, and firmware visibility, with runZero extending asset inventory management and NetRise adding firmware-level risk surfacing for NERC CIP, NIS2, and TSA compliance.
- September 2026: Nozomi Networks launched Nozomi Compass, an OT-native asset and service management platform bridging AI-speed vulnerability discovery with the manual OT remediation workflows that follow. The platform replaces IT-oriented ticketing tools with OT-native workflows, enabling asset and service management without operational disruption.
- June 2026: Accenture announced agreements to acquire a majority stake in Dragos and 100% stakes in runZero and NetRise, with a combined enterprise value of USD 4.175 billion. The combined entity reported USD 208 million in annual recurring revenue as of June 2026, up 53% year over year, with Dragos retaining its vendor-neutral product roadmap.
- June 2026: Schneider Electric entered a definitive agreement to acquire Cognite Holding B.V. in an all-cash transaction valued at USD 3.1 billion. Cognite's Atlas AI platform generated USD 170 million in revenue in 2025 with 36% ARR growth, providing the industrial data contextualization layer that underpins advanced OT asset analytics.
Global OT Asset Intelligence Market Report Scope
The OT Asset Intelligence Market comprises revenue generated by software, hardware, and services that enable discovery, inventory, monitoring, contextualization, and management of operational technology assets across industrial environments. These solutions enable organizations to gain visibility into connected and unmanaged OT assets, assess vulnerabilities, support compliance initiatives, and improve operational security. The market encompasses technologies for identifying and classifying industrial devices, control systems, networks, and field assets. OT asset intelligence solutions help organizations maintain accurate asset inventories and support digital transformation initiatives. Demand is driven by increasing IT-OT convergence and the need for continuous asset visibility across critical infrastructure and industrial operations.
The OT Asset Intelligence Market Report is Segmented by Component (Software, Hardware, and Services), Deployment Mode (On-Premises, Cloud, and Hybrid), Application (Asset Inventory Management, Vulnerability Assessment, Compliance Management, Threat Detection and Response, and Other Applications), Organization Size (Large Enterprises, and Small and Medium Enterprises), End-User Industry (Industrial Manufacturing, Energy and Utilities, Oil and Gas, Transportation and Logistics, Healthcare and Life Sciences, Chemicals and Petrochemicals, Water and Wastewater, and Other End-User Industries), and Geography (North America, South America, Europe, Asia-Pacific, Middle East, and Africa). The Market Forecasts are Provided in Terms of Value (USD).
| Software |
| Hardware |
| Services |
| On-Premises |
| Cloud |
| Hybrid |
| Asset Inventory Management |
| Vulnerability Assessment |
| Compliance Management |
| Threat Detection and Response |
| Other Applications |
| Large Enterprises |
| Small and Medium Enterprises |
| Industrial Manufacturing |
| Energy and Utilities |
| Oil and Gas |
| Transportation and Logistics |
| Healthcare and Life Sciences |
| Chemicals and Petrochemicals |
| Water and Wastewater |
| Other End-User Industries |
| North America | United States |
| Canada | |
| Mexico | |
| South America | Brazil |
| Argentina | |
| Rest of South America | |
| Europe | Germany |
| United Kingdom | |
| France | |
| Italy | |
| Russia | |
| Rest of Europe | |
| Asia-Pacific | China |
| Japan | |
| India | |
| South Korea | |
| Rest of Asia-Pacific | |
| Middle East | Saudi Arabia |
| United Arab Emirates | |
| Rest of Middle East | |
| Africa | South Africa |
| Nigeria | |
| Rest of Africa |
| By Component | Software | |
| Hardware | ||
| Services | ||
| By Deployment Mode | On-Premises | |
| Cloud | ||
| Hybrid | ||
| By Application | Asset Inventory Management | |
| Vulnerability Assessment | ||
| Compliance Management | ||
| Threat Detection and Response | ||
| Other Applications | ||
| By Organization Size | Large Enterprises | |
| Small and Medium Enterprises | ||
| By End-User Industry | Industrial Manufacturing | |
| Energy and Utilities | ||
| Oil and Gas | ||
| Transportation and Logistics | ||
| Healthcare and Life Sciences | ||
| Chemicals and Petrochemicals | ||
| Water and Wastewater | ||
| Other End-User Industries | ||
| By Geography | North America | United States |
| Canada | ||
| Mexico | ||
| South America | Brazil | |
| Argentina | ||
| Rest of South America | ||
| Europe | Germany | |
| United Kingdom | ||
| France | ||
| Italy | ||
| Russia | ||
| Rest of Europe | ||
| Asia-Pacific | China | |
| Japan | ||
| India | ||
| South Korea | ||
| Rest of Asia-Pacific | ||
| Middle East | Saudi Arabia | |
| United Arab Emirates | ||
| Rest of Middle East | ||
| Africa | South Africa | |
| Nigeria | ||
| Rest of Africa | ||
Key Questions Answered in the Report
What is the OT asset intelligence market size?
The OT asset intelligence market size is USD 4.71 billion in 2026 and is forecast to reach USD 13.64 billion by 2032, at a 19.56% CAGR from 2027 to 2032.
Why do industrial organizations use OT asset intelligence?
It provides a current record of devices and their context, supporting segmentation, vulnerability prioritization, compliance evidence, and incident response.
Which component leads OT asset intelligence adoption?
Software leads with 67.18% share in 2026 because platforms can update asset context and security information continuously.
Which end-user sector is growing fastest?
Water and wastewater is projected to expand at a 20.19% CAGR through 2032, supported by heightened concern over exposed control systems.
Why do many plants retain on-premises deployment?
On-premises deployment held 65.29% share in 2026 because air-gap policies, data rules, and equipment conditions can limit cloud connectivity.
What is driving adoption among small and medium enterprises?
Small and medium enterprises are projected to grow at a 21.81% CAGR as supply-chain obligations increase the need for practical asset discovery.