
OT Attack Surface Management Market Size and Share
Market Overview
| Study Period | 2021 - 2032 |
|---|---|
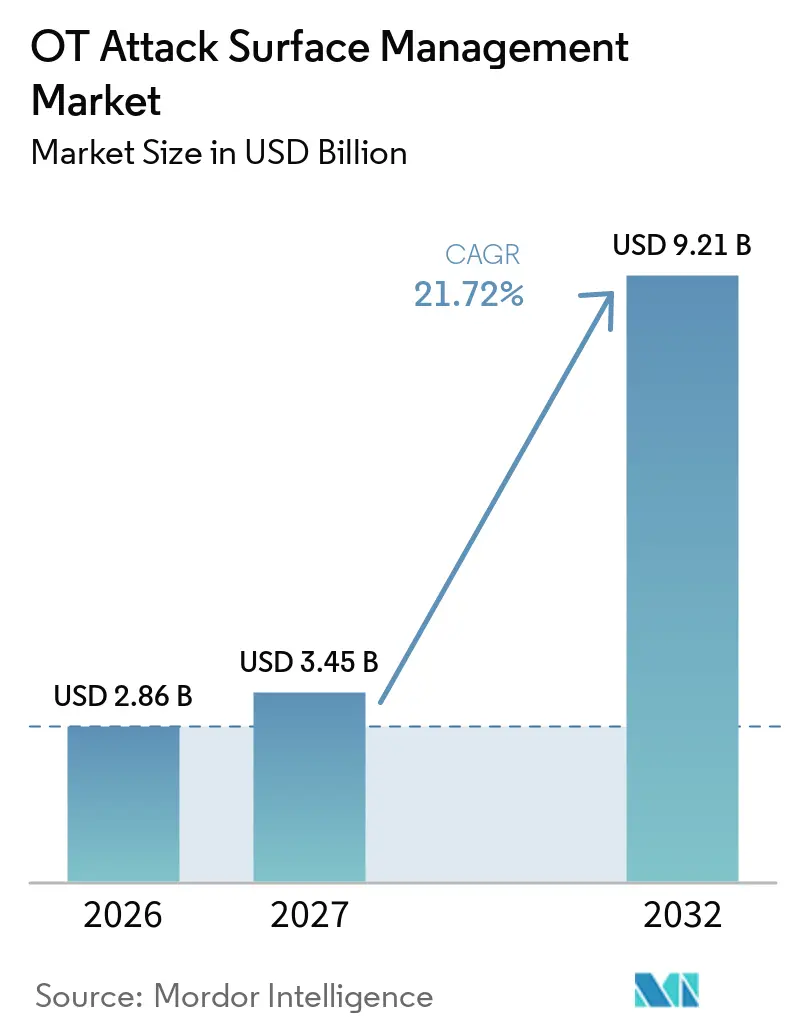
| Market Size (2027) | USD 3.45 Billion |
| Market Size (2032) | USD 9.21 Billion |
| Growth Rate (2027 - 2032) | 21.72 % |
| Fastest Growing Market | Asia-Pacific |
| Largest Market | North America |
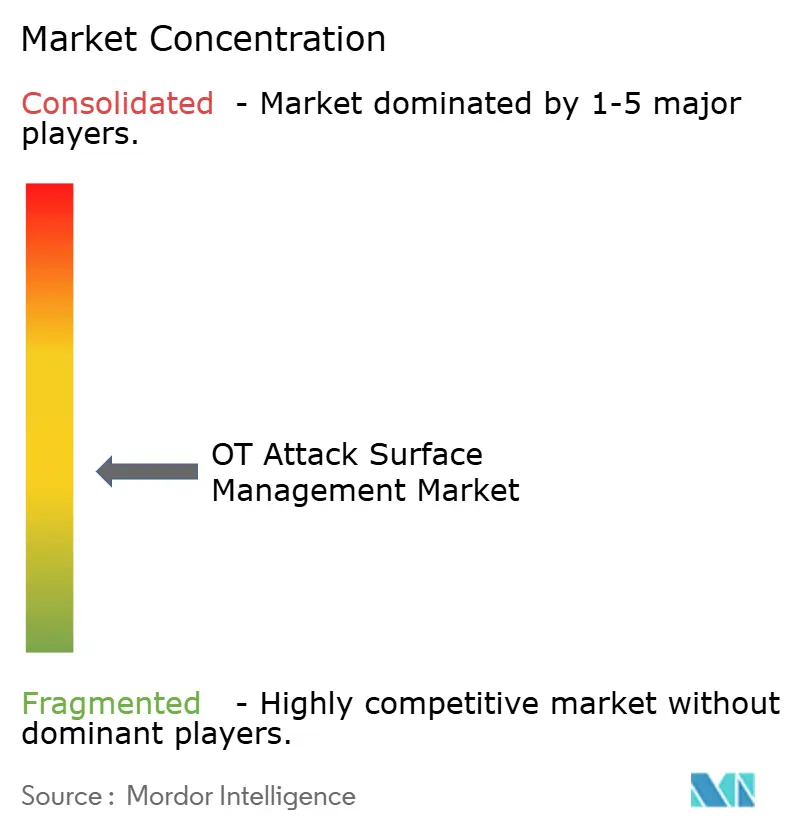
| Market Concentration | Medium |
Major Players *Disclaimer: Major Players sorted in no particular order Image © Mordor Intelligence. Reuse requires attribution under CC BY 4.0. | |
OT Attack Surface Management Market Analysis by Mordor Intelligence
The OT attack surface management market size is valued at USD 2.86 billion in 2026 and is forecast to reach USD 9.21 billion by 2032, expanding at a CAGR of 21.72% from 2027 to 2032. The OT attack surface management market is growing as IT and OT networks become more connected, widening the set of industrial assets that can be reached through a cyber incident. Many facilities still lack a current view of devices, owners, software, and communications across plant networks. This makes discovery and inventory a practical starting point for the OT attack surface management market because organizations cannot secure equipment they have not identified. Regulatory requirements, insurer documentation needs, and growing industrial connectivity are bringing security, engineering, and compliance teams into the same procurement process. Vendors are responding through platform combinations, cloud delivery options, and tools that connect asset data to remediation and compliance records.
Key Report Takeaways
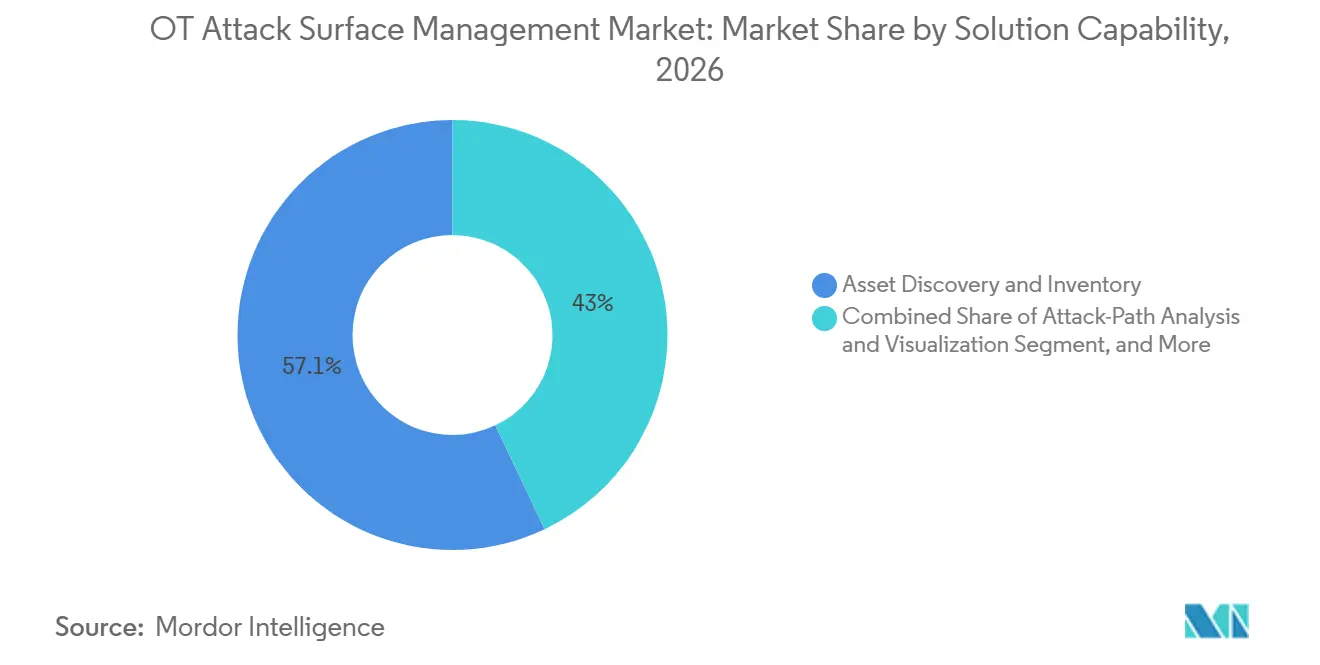
- By solution capability, asset discovery and inventory held 57.05% of the OT attack surface management market revenue in 2026, while attack-path analysis and visualization are projected to expand at a 23.56% CAGR through 2032.
- By deployment mode, on-premises held 66.81% of the OT attack surface management market revenue in 2026, while cloud is projected to expand at a 23.89% CAGR through 2032.
- By asset type, industrial control systems held 42.18% of the OT attack surface management market revenue in 2026, while industrial IoT and sensors are projected to expand at a 23.20% CAGR through 2032.
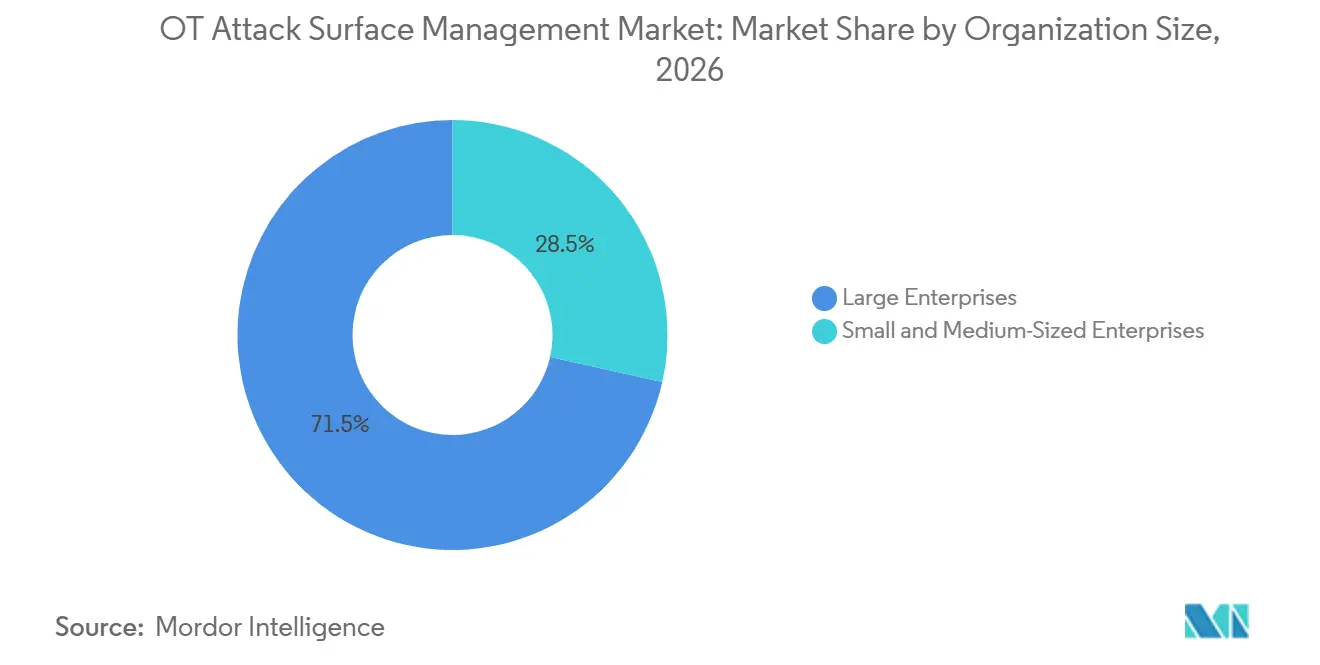
- By organization size, large enterprises held 71.49% of the OT attack surface management market revenue in 2026, while small and medium-sized enterprises are projected to expand at a 24.15% CAGR through 2032.
- By end-use industry, industrial manufacturing held 29.11% of the OT attack surface management market revenue in 2026, while government and public administration is projected to expand at a 22.49% CAGR through 2032.
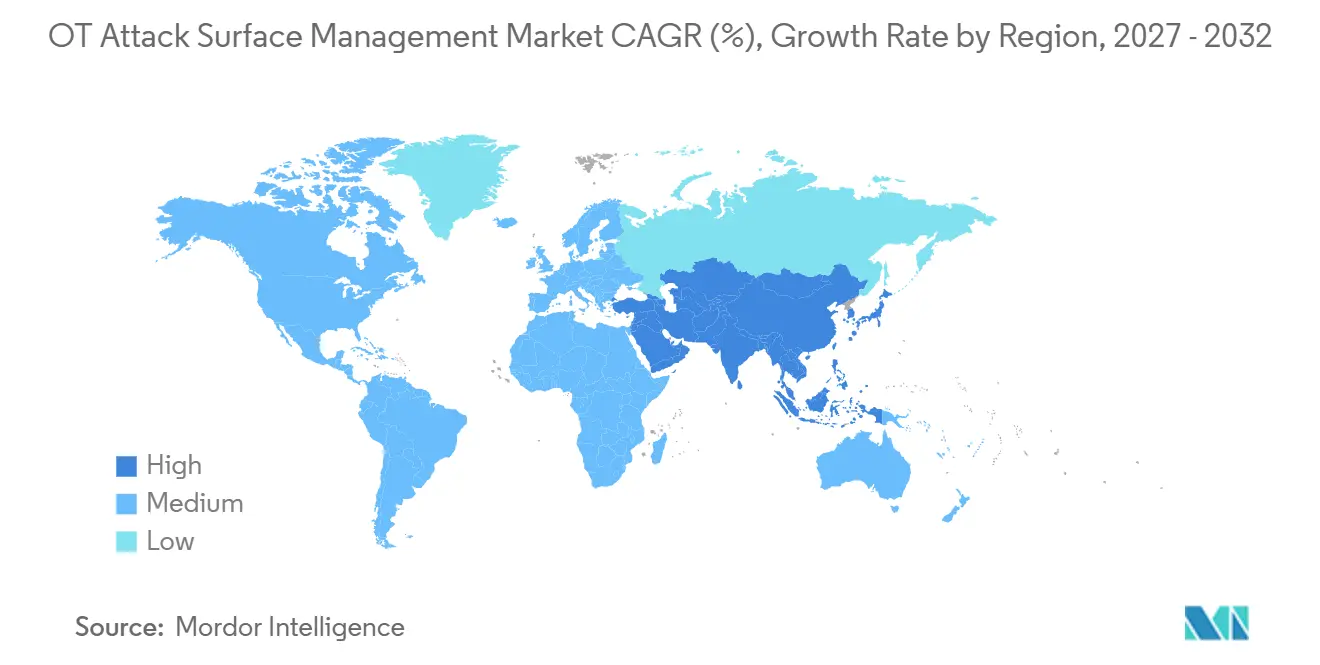
- By geography, North America held 36.19% of revenue in 2026, while Asia-Pacific is projected to expand at a 22.81% CAGR through 2032.
Note: Market numbers in this report are based on Mordor Intelligence's proprietary estimation framework, which combines nine months of actuals with Q4 projections for base year 2026.
Global OT Attack Surface Management Market Trends and Insights
Drivers Impact Analysis*
| Driver | (~) % Impact on CAGR Forecast | Geographic Relevance | Impact Timeline |
|---|---|---|---|
| IT-OT Convergence Expanding Unmanaged Asset Exposure | +6.5% | Global, concentrated in North America, Europe, and Asia-Pacific industrial corridors | Short term (≤ 2 years) |
| Critical-Infrastructure Regulation Mandating Continuous OT Visibility | +5.2% | North America, Europe, and Asia-Pacific | Medium term (2-4 years) |
| Industrial Digitalization Increasing Connected Asset Density | +4.0% | Asia-Pacific, North America, Europe, Middle East, and Africa | Medium term (2-4 years) |
| Insurance and Audit Requirements Requiring Evidence-Grade Asset Inventories | +2.1% | Global, most acute in North America and Europe | Short term (≤ 2 years) |
| Safe Active Discovery Improving Coverage Beyond Passive Monitoring | +1.0% | Global, especially large distributed energy and utility estates | Medium term (2-4 years) |
| AI-Assisted Asset Contextualization Reducing OT Exposure-Management Workload | +0.9% | Global, with faster adoption in North America and Europe | Long term (≥ 4 years) |
| Source: Mordor Intelligence | |||
IT-OT Convergence Expanding Unmanaged Asset Exposure
IT and OT convergence has reduced the separation that once limited access to plant systems. The OT attack surface management market benefits when operators need to identify links among remote access tools, cloud services, engineering workstations, and controllers. TXOne Networks reported that 96% of OT security incidents in 2025 began with an IT-level compromise, which highlights the importance of securing the pathway into operations. Claroty reported that more than 12% of industrial organizations had OT assets communicating with malicious domains. ISACA noted that connected environments inherit risks from remote access, cloud use, and diverse IoT protocols that many legacy systems were not designed to handle. CISA also warned in May 2025 that exposed assets and default credentials can allow less sophisticated actors to target OT systems.
Critical-Infrastructure Regulation Mandating Continuous OT Visibility
Regulation is shifting from perimeter controls toward ongoing internal visibility and evidence that controls are operating. This supports the OT attack surface management market because asset records, network monitoring, and audit trails are required together. FERC approved NERC CIP-015-1 in June 2025, and the standard requires internal network security monitoring for specified bulk electric system cyber systems. The standard took effect on September 2, 2025, with compliance dates of October 1, 2028, and October 1, 2030. FERC approved CIP-015-2 in August 2026 to extend monitoring to electronic and physical access control systems outside the security perimeter. Japan’s Ministry of Economy, Trade, and Industry also issued OT security guidelines for semiconductor device factories in June 2025, connecting plant practices with NIST CSF 2.0 and related frameworks.
Industrial Digitalization Increasing Connected Asset Density
Industrial digitalization is adding sensors, historians, edge devices, and soft PLCs to operating environments. Each added device increases the need for discovery, classification, and monitoring in the OT attack surface management market. Fortinet reported that 40% of surveyed organizations had ICS systems less than 5 years old in 2026, compared with 20% in 2025. Forescout found that 44% of industrial organizations reported real-time cyber visibility, while nearly 60% could not reliably detect OT and IoT threats. CISA’s asset inventory guidance outlines a process for owners and operators to document the criticality, functions, and dependencies of their OT assets. The guidance reinforces that a manually maintained asset list cannot keep pace with a changing industrial estate.
Insurance and Audit Requirements Requiring Evidence-Grade Asset Inventories
Insurance and audit processes are placing more weight on documented asset control. The OT attack surface management market offers a way to convert discovery data into records that support underwriting and compliance reviews. Insurers are increasingly expecting documented asset inventories, including firmware versions, patch status, and compensating controls, at the time of a loss. This need is particularly relevant for operators facing both insurance renewal and formal obligations under NERC CIP, NIS2, or ISO 27001. A single inventory that supports multiple review processes can reduce duplicate evidence-gathering. The value is strongest where utility, chemical, and other critical infrastructure operators must demonstrate controls to several external parties.
Restraints Impact Analysis*
| Restraint | (~) % Impact on CAGR Forecast | Geographic Relevance | Impact Timeline |
|---|---|---|---|
| Legacy Protocol and Safety Constraints Limiting Active Discovery | -2.8% | Global, most severe in brownfield energy, chemical, and water sectors | Long term (≥ 4 years) |
| Incomplete Asset Ownership Data Slowing Exposure Remediation | -1.6% | Global, concentrated in large multi-site enterprises | Medium term (2-4 years) |
| Operational Downtime Sensitivity Extending Deployment Cycles | -1.2% | Global, particularly continuous-process industries | Medium term (2-4 years) |
| Shortage of OT-Cybersecurity Specialists Increasing Total Cost of Ownership | -0.9% | Global, most acute in Asia-Pacific and South America | Long term (≥ 4 years) |
| Source: Mordor Intelligence | |||
Legacy Protocol and Safety Constraints Limiting Active Discovery
Legacy protocols such as Modbus, DNP3, PROFIBUS, and proprietary vendor protocols were not designed for active security scanning. A probe can cause device hangs, communication disruption, or unexpected state changes in a safety-critical setting. NIST’s NCCoE stated that OT estates include proprietary protocols that do not apply to standard IT asset management approaches.[1] The same project description noted that legacy configuration collection can require manual physical inspection. Passive monitoring does not identify equipment that generates no traffic, which leaves dark assets, air-gapped equipment, and infrequently communicating controllers less visible. This constraint makes physical walk-downs necessary in some energy, chemical, and water installations, extending deployment time and cost.
Incomplete Asset Ownership Data Slowing Exposure Remediation
Discovery alone does not resolve a vulnerability unless a person or team has responsibility for the affected asset. Unclear ownership between IT and OT teams remains a practical barrier to remediation after inventory is complete. Claroty identified unclear ownership as one of the main customer challenges in its January 2026 funding announcement. NIST’s 2026 OT asset management project includes tracking responsibility from specification and procurement through decommissioning. Without accountable owners, identified vulnerabilities can remain unresolved, reducing the operational value of exposure-management tools. It can also discourage investment in more advanced attack paths and visualization functions when basic findings are not being acted on.
*Our forecasts treat driver/restraint impacts as directional, not additive. The impact forecasts reflect baseline growth, mix effects, and variable interactions.
Segment Analysis
By Solution Capability: Discovery Anchors Revenue While Attack-Path Intelligence Leads Growth
Asset discovery and inventory accounted for 57.05% of the OT attack surface management market share in 2026. It is the first capability required before operators can map vulnerabilities, communication paths, and system ownership. CISA identified gaps in asset inventory as a material weakness in OT environments and published guidance on building a complete, usable inventory. Exposure and vulnerability management, along with network and communication monitoring, become more important once an organization has a stable asset record. These functions allow operators to move from a device list toward prioritization and continuous oversight. Other capabilities, such as reporting modules and integration middleware, support the workflow but are often incorporated into broader platforms.
Attack-path analysis and visualization are projected to grow at a 23.56% CAGR from 2027 to 2032. The OT attack surface management market size for this capability is driven by users who need to understand whether a group of connected weaknesses could impact a physical process. Peer-reviewed research published in 2026 found that attack-graph-based OT risk assessment improved the prediction of adversary paths compared with assessments based solely on vulnerability scores. Claroty introduced its CPS Library in August 2025 and launched Claroty Claire in May 2026 to add asset context to vulnerability and exposure data. Dragos introduced EmberAI in 2026 to help analysts query assets and translate advisories into site-specific assessments.[2] As ISA/IEC 62443-based risk assessment practices mature, documented path analysis can serve security, engineering, and compliance teams together.

By Deployment Mode: On-Premises Dominates While Cloud Architecture Accelerates
On-premises deployment represented 66.81% of revenue in 2026. Many OT environments prioritize deterministic performance, air-gap separation, and restricted data movement, which limits the use of cloud connectivity in sensitive sites. Nuclear, defense-related, and classified industrial facilities may require local processing due to data-sovereignty rules. Local platforms can therefore remain necessary even when enterprise security programs use cloud tools elsewhere. Hybrid models provide an intermediate option through plant-level collectors and centrally managed analytics. This approach can preserve local operational controls while allowing multi-site oversight.
Cloud deployment is projected to grow at a 23.89% CAGR from 2027 to 2032. The OT attack surface management market benefits from cloud delivery, where hardware costs, specialist staffing requirements, and software update delays create barriers for smaller teams. CISA issued 2,155 CVEs across 508 ICS advisories in 2025, which shows the operational value of timely intelligence and platform updates. Claroty’s xDome and TXOne management platforms show how local data collection can be combined with centrally available risk analytics. Cloud options are particularly relevant to logistics, food and beverage, and mid-market manufacturing sites where continuity requirements are less restrictive than in core utility operations. Small and medium-sized enterprises can use the model to obtain capabilities that would be difficult to maintain entirely on-site.
By Asset Type: ICS Dominates While Industrial IoT Expands the Exposure Surface
Industrial control systems held 42.18% of revenue in the asset type segment in 2026. These systems translate digital commands into physical actions and therefore have direct operational importance. Claroty identified more than 111,000 known exploitable vulnerabilities across nearly 1 million OT devices in manufacturing, logistics, and natural resources organizations. The company reported that 68% of those vulnerabilities were linked to active ransomware groups. SCADA systems, PLCs, remote terminal units, and distributed control systems have established passive-monitoring coverage, but legacy protocols can still limit active discovery. Chemical, oil, and gas facilities give particular attention to distributed control systems because a compromise can affect high-consequence processes.
Industrial IoT and sensors are projected to grow at a 23.20% CAGR from 2027 to 2032. IIoT deployments can add endpoints more rapidly than traditional OT categories, and many of these endpoints arrive without a security agent or an established asset profile. Wireless connectivity and consumer-grade firmware may also sit outside the visibility of passive Ethernet monitoring. Tenable launched VM-Native OT Discovery in April 2026 to use protocol-aware handshakes for PLCs, HMIs, IoT devices, and shadow IT assets. Research on converged factory networks also found that IIoT endpoints can appear early in multistage attack paths. The combination of rapid endpoint growth and incomplete legacy coverage makes this asset category a major source of unmet demand.
By Organization Size: Large Enterprises Lead While SMEs Drive the Next Growth Phase
Large enterprises accounted for 71.49% of revenue in 2026. They operate large OT estates and often face the most demanding audit and regulatory timelines. NERC CIP, NIS2 essential-entity requirements, and pipeline security directives can apply most directly to operators with critical assets or greater scale. Dragos reported that only 30% of OT networks had adequate visibility, even though large organizations typically have larger budgets and more internal resources to address the problem. Claroty stated that it served 24 of the Fortune 100 as of January 2026, showing where adoption has concentrated among major critical-infrastructure operators. Distributed sites and varied asset owners can still make remediation difficult, even for these well-resourced customers.
Small and medium-sized enterprises are projected to grow at a 24.15% CAGR from 2027 to 2032. NIS2 extends compliance requirements across 18 sectors, bringing more mid-market operators into formal cybersecurity timelines. SaaS delivery reduces the upfront infrastructure and specialist staffing burden that had kept many smaller firms outside the OT attack surface management market. Radiflow introduced Radiflow360 in 2025 with asset mapping and risk scoring for mid-market industrial operators. These buyers remain price-sensitive and are more likely to favor automated discovery with a short time-to-value. Vendors that limit the need for extended professional services can be better positioned with this group.
By End-Use Industry: Manufacturing Anchors Demand While Government Urgency Accelerates
Industrial manufacturing represented 29.11% of revenue in 2026. It has a large population of connected production assets, aging equipment, and shared IT and OT systems. Dragos reported that manufacturing accounted for more than two-thirds of ransomware victims across industrial organizations in 2025. The report also found inadequate IT and OT segmentation in nearly half of the manufacturing assessments. Energy and utilities, as well as oil and gas, remain major users because NERC CIP and pipeline security directives require defined monitoring and inventory capabilities. Chemicals, water, wastewater, transportation, and logistics have their own operational constraints and compliance needs.
Government and public administration are projected to grow at a 22.49% CAGR from 2027 to 2032. A July 2026 advisory from CISA and other federal agencies warned that Iranian-affiliated actors were exploiting internet-connected OT devices, including PLCs, across critical infrastructure. The Operational Technology Cybersecurity Coalition called for a CISA binding operational directive on baseline OT security for federal civilian agencies in October 2026. Claroty’s 2026 partnership with Carahsoft targeted state, local, and federal agencies with OT security offerings. Threat activity, policy attention, and lower baseline maturity are creating a stronger procurement case across public-sector facilities.
Geography Analysis
North America accounted for 36.19% of revenue in 2026, the largest share of the OT attack surface management market among regions. FERC’s approval of CIP-015-1 created a procurement cycle for internal network monitoring at relevant bulk electric system entities. CIP-015-2, approved in 2026, broadened that effort to access-control systems outside the electronic security perimeter. The TSA Pipeline-2021-02F Security Directive added a related requirement for liquid and gas pipeline operators in 2025. The United States leads regional demand, while Canada is adopting aligned practices.
Europe is an important OT attack surface management market, as NIS2 requirements have led many industrial operators to establish asset inventories in 2025 and 2026. Germany, the United Kingdom, and France are the main demand centers due to their industrial bases, energy infrastructure, and enforcement bodies. The United Kingdom’s Cyber Security and Resilience Bill adds accountability and incident-reporting expectations for infrastructure service providers.[3] South America is earlier in adoption, and multinational manufacturers are applying common OT security practices at sites in Brazil and Argentina.
Asia-Pacific is projected to grow at a 22.81% CAGR from 2027 to 2032. This OT attack surface management market combines rapid digitalization, a large manufacturing base, and increasingly formal security requirements. Japan’s 2025 semiconductor factory guidelines provide procurement and audit direction for a broad supply chain. China, India, and South Korea are adding connected industrial devices faster than security tooling is deployed. The Middle East and Africa are at earlier stages, with Saudi Arabia, the UAE, South Africa, and Nigeria serving as key entry points.
Competitive Landscape
The OT attack surface management market is moderately concentrated at the top tier and fragmented below it. Acquisitions in 2025 and 2026 changed the structure of the leading vendor group. Accenture agreed in June 2026 to acquire a majority stake in Dragos and acquire runZero and NetRise, with the transactions closing by September 2026. The combined approach links OT threat intelligence, exposure management, and device firmware visibility. Mitsubishi Electric completed its acquisition of Nozomi Networks in January 2026, placing OT security software under a large industrial equipment provider.
In the OT attack surface management market, differentiation depends on OT asset data, operating context, and evidence that can be used without manual rework. Claroty raised USD 150 million in Series F funding in January 2026 and introduced Claroty Claire in May 2026.[4] TXOne launched Sennin in April 2026 to connect risk assessment with governance and remediation workflows. Tenable released VM-Native OT Discovery in April 2026 as part of Tenable One.
The OT attack surface management market still has room for vendors that validate segmentation controls and address transportation environments beyond fixed industrial facilities. Shift5 received NIAP certification in November 2025 for full-drive encryption for classified OT edge environments. Armexa and Emerson entered into a December 2025 collaboration to provide OT cybersecurity services for DeltaV users. IEC 62443 alignment remains a way for buyers to compare capabilities and deployment practices.
OT Attack Surface Management Industry Leaders
-
Armis Security, Ltd.
-
Claroty Ltd.
-
Dragos, Inc.
-
Nozomi Networks Inc.
-
Xage Security, Inc.
- *Disclaimer: Major Players sorted in no particular order
Recent Industry Developments
- September 2026: Dragos, Inc. officially completed the acquisitions of NetRise and runZero following the close of Accenture's majority investment on September 16-17, 2026. The combined platform now provides asset visibility from the industrial network layer through to device firmware and software supply chain, supporting compliance documentation for NERC CIP, NIS2, and TSA directives.
- September 2026: TXOne Networks launched a purpose-built OT security checkpoint for removable media inspection at Black Hat USA 2026, enabling organizations to inspect and sanitize USB drives and maintenance files at facility entry points without installing software on production assets or requiring internet connectivity.
- September 2026: TXOne Networks launched vEdgeIPS Pro at SEMICON Taiwan 2026, its first virtual appliance line, extending AI-powered inline OT security to virtualized industrial control environments without requiring new physical hardware.
- June 2026: TXOne Networks released Virtual Portable Inspector, a software-based OT inspection tool enabling agentless security assessment at geographically distributed sites, assets without accessible USB interfaces, and facilities where on-site inspection creates deployment overhead.
Global OT Attack Surface Management Market Report Scope
The OT Attack Surface Management Market comprises revenues generated from solutions and services that continuously discover, assess, prioritize, and manage cyber exposures across operational technology environments. These platforms provide visibility into connected devices, industrial networks, communication pathways, vulnerabilities, and potential attack paths that could expose critical operations to cyber risks. The market includes capabilities such as asset discovery, exposure management, network monitoring, risk prioritization, attack-path analysis, and compliance reporting. Organizations use these solutions to reduce their cyber exposure, strengthen their security posture, and enhance resilience across industrial systems. The market is gaining momentum as industrial connectivity and regulatory requirements continue to increase.
The OT Attack Surface Management Market Report is Segmented by Solution Capability (Asset Discovery and Inventory, Exposure and Vulnerability Management, Network and Communication Monitoring, Attack-Path Analysis and Visualization, and Other Solution Capabilities), Deployment Mode (Cloud, On-Premises, and Hybrid), Asset Type (Industrial Control Systems, Supervisory Control and Data Acquisition Systems, Programmable Logic Controllers and Remote Terminal Units, Distributed Control Systems, Industrial IoT and Sensors, and Other Asset Types), Organization Size (Large Enterprises, and Small and Medium-Sized Enterprises), End-Use Industry (Energy and Utilities, Oil and Gas, Industrial Manufacturing, Chemicals and Petrochemicals, Water and Wastewater, Transportation and Logistics, Government and Public Administration, and Other End-Use Industries), and Geography (North America, South America, Europe, Asia-Pacific, Middle East, and Africa). The Market Forecasts are Provided in Terms of Value (USD).
| Asset Discovery and Inventory |
| Exposure and Vulnerability Management |
| Network and Communication Monitoring |
| Attack-Path Analysis and Visualization |
| Other Solution Capabilities |
| Cloud |
| On-Premises |
| Hybrid |
| Industrial Control Systems |
| Supervisory Control and Data Acquisition Systems |
| Programmable Logic Controllers and Remote Terminal Units |
| Distributed Control Systems |
| Industrial IoT and Sensors |
| Other Asset Types |
| Large Enterprises |
| Small and Medium-Sized Enterprises |
| Energy and Utilities |
| Oil and Gas |
| Industrial Manufacturing |
| Chemicals and Petrochemicals |
| Water and Wastewater |
| Transportation and Logistics |
| Government and Public Administration |
| Other End-Use Industries |
| North America | United States |
| Canada | |
| South America | Brazil |
| Argentina | |
| Mexico | |
| Rest of South America | |
| Europe | Germany |
| United Kingdom | |
| France | |
| Italy | |
| Russia | |
| Rest of Europe | |
| Asia-Pacific | China |
| Japan | |
| India | |
| South Korea | |
| Rest of Asia-Pacific | |
| Middle East | Saudi Arabia |
| United Arab Emirates | |
| Rest of Middle East | |
| Africa | South Africa |
| Nigeria | |
| Rest of Africa |
| By Solution Capability | Asset Discovery and Inventory | |
| Exposure and Vulnerability Management | ||
| Network and Communication Monitoring | ||
| Attack-Path Analysis and Visualization | ||
| Other Solution Capabilities | ||
| By Deployment Mode | Cloud | |
| On-Premises | ||
| Hybrid | ||
| By Asset Type | Industrial Control Systems | |
| Supervisory Control and Data Acquisition Systems | ||
| Programmable Logic Controllers and Remote Terminal Units | ||
| Distributed Control Systems | ||
| Industrial IoT and Sensors | ||
| Other Asset Types | ||
| By Organization Size | Large Enterprises | |
| Small and Medium-Sized Enterprises | ||
| By End-Use Industry | Energy and Utilities | |
| Oil and Gas | ||
| Industrial Manufacturing | ||
| Chemicals and Petrochemicals | ||
| Water and Wastewater | ||
| Transportation and Logistics | ||
| Government and Public Administration | ||
| Other End-Use Industries | ||
| By Geography | North America | United States |
| Canada | ||
| South America | Brazil | |
| Argentina | ||
| Mexico | ||
| Rest of South America | ||
| Europe | Germany | |
| United Kingdom | ||
| France | ||
| Italy | ||
| Russia | ||
| Rest of Europe | ||
| Asia-Pacific | China | |
| Japan | ||
| India | ||
| South Korea | ||
| Rest of Asia-Pacific | ||
| Middle East | Saudi Arabia | |
| United Arab Emirates | ||
| Rest of Middle East | ||
| Africa | South Africa | |
| Nigeria | ||
| Rest of Africa | ||
Key Questions Answered in the Report
What is the OT attack surface management market size?
The OT attack surface management market size is valued at USD 2.86 billion in 2026 and is forecast to reach USD 9.21 billion by 2032, expanding at a CAGR of 21.72% from 2027 to 2032.
What is driving adoption of OT attack surface management?
Connected IT and OT systems, asset inventory requirements, industrial digitalization, and regulatory monitoring obligations are supporting the OT attack surface management market.
Which solution capability leads revenue?
Asset discovery and inventory leads the OT attack surface management market with 57.05% of revenue in 2026 because it provides the asset record needed for later security and compliance work.
Which deployment model is growing fastest?
Cloud deployment is projected to expand at a 23.89% CAGR through 2032 in the OT attack surface management market as it reduces infrastructure and operating demands for many users.
Which end-use segment is growing fastest?
Government and public administration is projected to expand at a 22.49% CAGR through 2032 as public agencies address OT threats and baseline security needs in the OT attack surface management market.
Which region is expanding fastest?
Asia-Pacific is projected to expand at a 22.81% CAGR through 2032, supported by digitalization, formal security requirements, and connected manufacturing expansion in the OT attack surface management market across its major industrial economies.