
Optical Coherence Tomography For Industrial Inspection Market Size and Share
Market Overview
| Study Period | 2020 - 2031 |
|---|---|
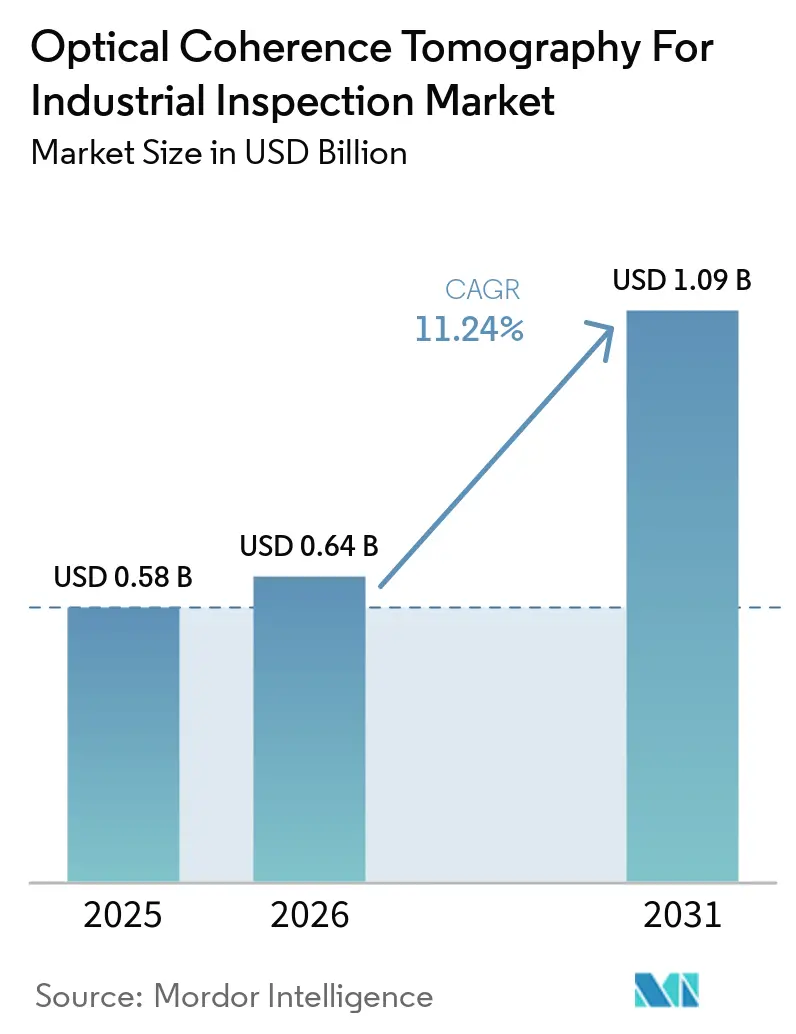
| Market Size (2026) | USD 0.64 Billion |
| Market Size (2031) | USD 1.09 Billion |
| Growth Rate (2026 - 2031) | 11.24 % |
| Fastest Growing Market | Asia-Pacific |
| Largest Market | Asia-Pacific |
| Market Concentration | Medium |
Major Players *Disclaimer: Major Players sorted in no particular order Image © Mordor Intelligence. Reuse requires attribution under CC BY 4.0. | |
Optical Coherence Tomography For Industrial Inspection Market Analysis by Mordor Intelligence
The Optical Coherence Tomography for Industrial Inspection Market size is projected to expand from USD 0.58 billion in 2025 to USD 0.64 billion in 2026, and to USD 1.09 billion by 2031, registering a CAGR of 11.24% between 2026 and 2031. Demand is moving beyond semiconductor inspection as manufacturers adopt inline checks for additive manufacturing, multilayer materials, and electric-vehicle battery assembly. Production teams need faster feedback because defects found after assembly can increase scrap, rework, and warranty exposure. Suppliers are therefore combining imaging hardware with processing tools that support real-time decisions on the production line. Asia-Pacific remains central to demand because it combines semiconductor, display, and battery manufacturing capacity across South Korea, Japan, and China. Competition spans component suppliers, system integrators, and photonics groups, while high integration costs and limits in opaque materials continue to restrict wider adoption.
Key Report Takeaways
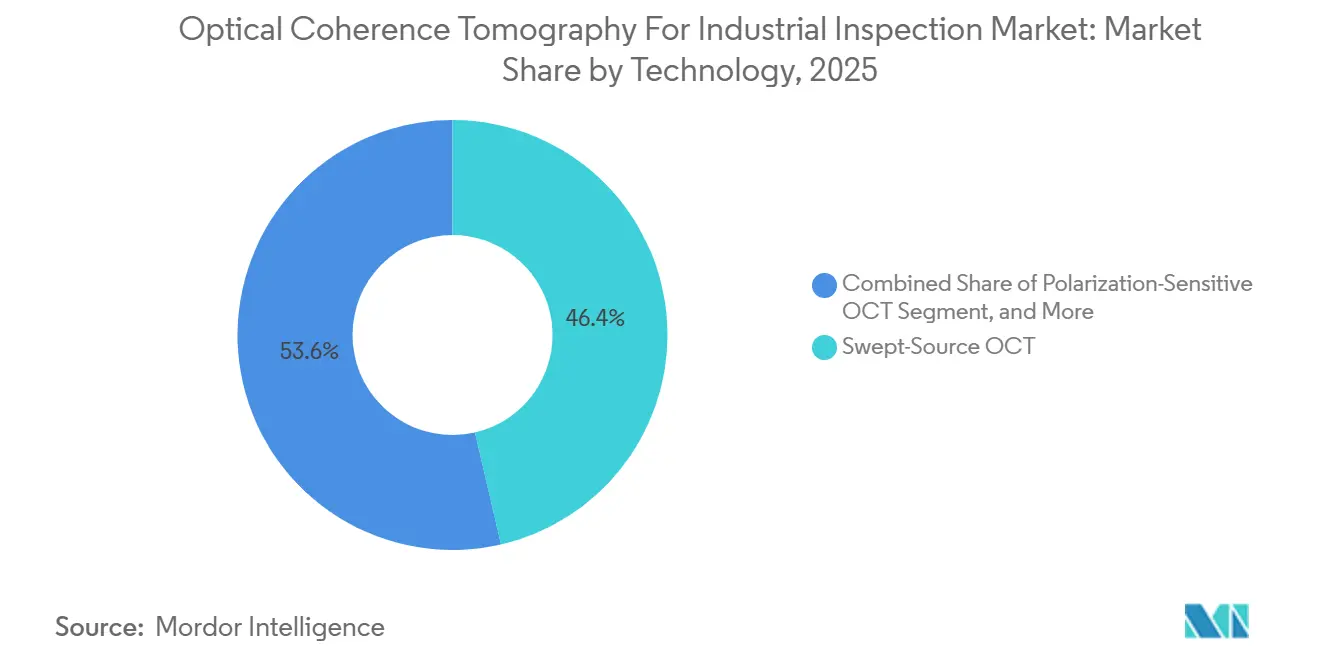
- By technology, swept-source OCT held 46.38% of Optical Coherence Tomography for Industrial Inspection Market share in 2025, while polarization-sensitive OCT is projected to expand at a 13.84% CAGR through 2031.
- By component, signal processing and control units accounted for 24.67% of Optical Coherence Tomography for Industrial Inspection Market revenue in 2025, while light sources are expected to expand at a 13.52% CAGR through 2031.
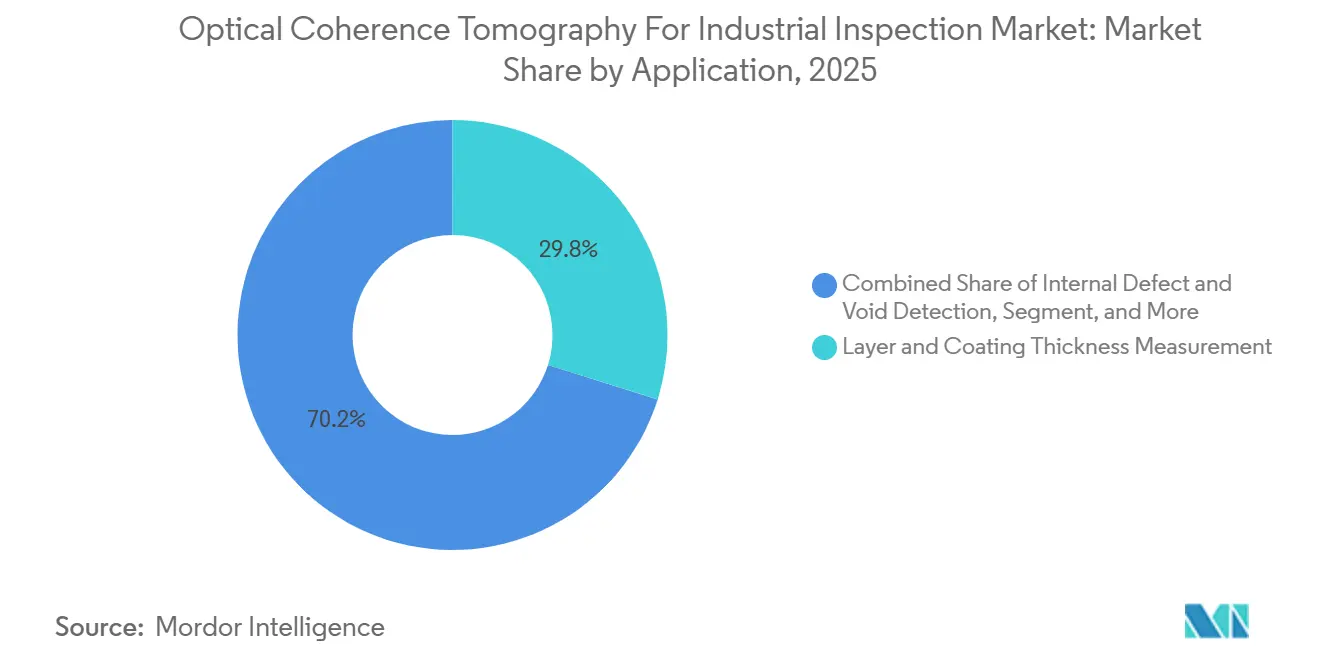
- By application, layer and coating thickness measurement held 29.84% of Optical Coherence Tomography for Industrial Inspection Market revenue in 2025, while internal defect and void detection is projected to expand at a 12.93% CAGR through 2031.
- By end-user industry, semiconductor and advanced electronics manufacturing held 27.43% of Optical Coherence Tomography for Industrial Inspection Market revenue in 2025, while additive manufacturing is expected to expand at a 13.76% CAGR through 2031.
- By geography, Asia-Pacific held 43.76% of the Optical Coherence Tomography for Industrial Inspection Market share in 2025 and is projected to expand at a 13.19% CAGR through 2031.
Note: Market size and forecast figures in this report are generated using Mordor Intelligence’s proprietary estimation framework, updated with the latest available data and insights as of January 2026.
Global Optical Coherence Tomography For Industrial Inspection Market Trends and Insights
Drivers Impact Analysis*
| Driver | (~) % Impact on CAGR Forecast | Geographic Relevance | Impact Timeline |
|---|---|---|---|
| Semiconductor and Advanced Packaging Complexity | +2.8% | Asia-Pacific core, North America and Europe spillover | Short term (≤ 2 years) |
| Inline Quality Control and Industry 4.0 Integration | +2.3% | Global | Medium term (2-4 years) |
| Non-Destructive Inspection of Multilayer Materials | +1.7% | Global | Medium term (2-4 years) |
| Coaxial OCT Monitoring of Laser Welding and Additive Manufacturing | +1.3% | North America, Europe, and Asia-Pacific core | Medium term (2-4 years) |
| OCT-Enabled Inspection of Contoured Composite Structures | +0.9% | North America and Europe | Long term (≥ 4 years) |
| Compact Line-Scan Engines Lowering OEM Integration Barriers | +0.7% | Global | Medium term (2-4 years) |
| Source: Mordor Intelligence | |||
Semiconductor and Advanced Packaging Complexity
The Optical Coherence Tomography for Industrial Inspection Market benefits from the growing need for tighter inspection in 3D integrated circuits and advanced packaging. Hybrid bonding, fan-out wafer-level packaging, and multi-die stacks require close control of through-silicon vias and micro-bump connections. Conventional optical metrology can struggle when these structures require fast measurement at shallow depths. A 2026 chip-based swept-source OCT prototype measured wafer thickness with absolute errors below 2 µm and scanned without contact at a speed 11,000 times faster than contact profilometry.[1]Hang Su et al., “Robust and Plug-and-Play Chip-Based Swept-Source Optical Coherence Tomography for Industrial Applications,” PhotoniX Synergy, link.springer.com The result matters because contact methods can deform photoresist and contaminate active die surfaces. Bonding-interface inspection also has value when delamination below 20 µm passes electrical testing but later causes failures under thermal cycling.
Inline Quality Control and Industry 4.0 Integration
The Optical Coherence Tomography for Industrial Inspection Market is supported by manufacturers that need production data while parts are still on the line. OCT can provide micrometer-scale, subsurface images for immediate process feedback rather than relying on offline samples. A 2025 line-field spectral-domain OCT system reached 1,470 kHz scan rates and 100.2 dB sensitivity across an 8×8×2.7 mm volume in less than 1 second.[2]Y. Oikawa et al., “Optical Coherence Tomography for High-Precision Industrial Inspection in Industry 4.0: Advances, Challenges, and Future Trends,” Laser and Photonics Reviews, onlinelibrary.wiley.com This performance supports conveyor-speed inspection for display lamination, pharmaceutical coatings, and printed electronics. FPGA and GPU processing can turn the output into a defect flag in milliseconds. ISO/TC 261's work on additive manufacturing inspection also helps reduce validation uncertainty for new industrial users.
Non-Destructive Inspection of Multilayer Materials
The Optical Coherence Tomography for Industrial Inspection Market serves materials in which layer boundaries and internal interfaces require inspection without sample cutting. Battery electrodes, flexible films, optical adhesive stacks, and turbine coatings are examples where contact-free measurement can be useful. A 2026 study showed that 4 µm mid-infrared OCT reached 360 µm in wind-turbine-blade coatings, while 1.3 µm near-infrared OCT was attenuated within 100 µm in the same samples.[3]A. Lapre et al., “Non-Destructive Sub-Surface Inspection of Multi-Layer Wind Turbine Blade Coatings by Mid-Infrared Optical Coherence Tomography,” Wind Energy Science, wes.copernicus.org The mid-infrared system imaged the relevant interfaces in 40 minutes, whereas X-ray CT required 6 hours to cover the same sample area. This can support closer control of multi-coat application in blade production. Its non-ionizing operation is also compatible with wet-paint environments.
Coaxial OCT Monitoring of Laser Welding and Additive Manufacturing
The Optical Coherence Tomography for Industrial Inspection Market is gaining from coaxial arrangements that place the OCT beam along the processing laser path. This approach identifies defects during production rather than after a component is finished. In wire-based laser metal deposition, coaxial OCT measures the layer height after each pass and supports wire feed-rate correction for subsequent layers.[4]P. Mercelis et al., “Review of Online Quality Control for Laser Directed Energy Deposition (LDED) Additive Manufacturing,” Smart Manufacturing, iopscience.iop.org This process can prevent the build-up of geometry errors in directed energy deposition. For electric vehicle battery tab welding, LSTM-enhanced OCT reported a mean absolute penetration-depth error of 77 µm across laser powers ranging from 1.8 to 2.2 kW. Earlier detection of micro-pores can limit safety-related joint failures and move quality control closer to the source of the defect.
Restraints Impact Analysis*
| Restraint | (~) % Impact on CAGR Forecast | Geographic Relevance | Impact Timeline |
|---|---|---|---|
| Limited Penetration in Opaque and Highly Scattering Materials | -1.4% | Global | Long term (≥ 4 years) |
| High System Integration and Application-Engineering Cost | -1.2% | Global, with greater impact on SMEs in South America and Middle East and Africa | Short term (≤ 2 years) |
| Limited Industrial Training Data for Defect Classification | -0.8% | Global | Medium term (2-4 years) |
| Customer Validation Delays Caused by Process-Specific Calibration | -0.6% | Global, particularly affecting first-adopter industries | Short term (≤ 2 years) |
| Source: Mordor Intelligence | |||
Limited Penetration in Opaque and Highly Scattering Materials
The Optical Coherence Tomography for Industrial Inspection Market faces physical depth limits in metals, carbon-fiber composites, and opaque coatings. OCT depends on ballistic photons, and scattering reduces the signal available from deeper layers. Near-infrared systems work well with polymers and glass but become less reliable in heavily pigmented substrates. The 2026 wind-turbine coating study found that near-infrared OCT could not image through primer layers that mid-infrared OCT penetrated. Mid-infrared OCT addresses this limitation but requires more complex sources, detectors, and laser-safety systems. Until those components become more accessible, users inspecting metal and high-scattering materials may continue to select laser ultrasonics or phased-array ultrasound.
High System Integration and Application-Engineering Cost
The Optical Coherence Tomography for Industrial Inspection Market can require significant work before a system is ready to be integrated into a production line. Projects may require custom probes, vibration control, process geometry calibration, and integration with plant data systems. These requirements make OCT different from a standard inspection device that can be installed without adjustment. Smaller packaging, composite, and precision-machining firms may find that ownership costs exceed the payback from existing inspection methods. Thorlabs introduced the Telesto® platform in July 2026 with a software development kit and an OEM-oriented interface that can reduce integration work. More standardized hardware and application support are still needed before this constraint eases across smaller manufacturing sites.
*Our forecasts treat driver/restraint impacts as directional, not additive. The impact forecasts reflect baseline growth, mix effects, and variable interactions.
Segment Analysis
By Technology: Swept-Source OCT Leads, While Polarization-Sensitive OCT Gains Momentum
Swept-source OCT captured 46.38% of the Optical Coherence Tomography for Industrial Inspection Market share within technology revenue in 2025. Its long coherence length, low-sensitivity roll-off, and A-scan rates above 50 kHz enable inspection of multilayer coatings and adhesive bonds at production speeds. Spectral-domain OCT remains competitive for high-resolution, shallow-depth uses. Thorlabs reported axial resolution below 3.4 µm in air and A-scan rates up to 146 kHz for its Telesto® platform in July 2026. These capabilities suit printed circuit board coatings, wafer surfaces, and thin-film displays.
Polarization-sensitive OCT is projected to expand at a 13.84% CAGR through 2031, the highest rate among the technology categories. It measures birefringence using phase retardation and Stokes-vector analysis, helping users identify subsurface stress defects and microcracks. A 2025 polarization-multiplexed method achieved 33-45 dB artifact suppression in multilayer LCD imaging with orthogonally polarized reference beams. This method can serve foldable-display adhesives and smart-glass multilayers that need layer discrimination below 30 µm. Full-field OCT is gaining use in MEMS and mask inspection, while time-domain OCT remains relevant where 4-8 mm imaging depth outweighs speed.



By Component: Signal Processing and Control Units Lead, While Light Sources Expand Fastest
Signal processing and control units accounted for 24.67% of the Optical Coherence Tomography for Industrial Inspection Market component revenue in 2025. FPGA and GPU architectures process image data at production speeds, while AI modules and closed-loop software can convert OCT into a process-control tool. Interferometers, fiber assemblies, scanning systems, and probes provide beam handling and positioning in industrial settings. Detectors, cameras, and spectrometers establish core sensitivity and speed limits. These components collectively determine platform suitability for each production environment.
Light sources are expected to expand at a 13.52% CAGR through 2031 as suppliers move toward swept-source and mid-infrared systems. The shift increases demand for tunable and supercontinuum sources for the inspection of polymer, composite, ceramic, and optoelectronic semiconductor materials. SuperLight Photonics introduced the SLP-1050 in January 2025 with 1,700-2,500 nm coverage and 2.75 µm axial resolution. Thorlabs demonstrated a MEMS VCSEL swept-source laser with selectable rates up to 400 kHz and imaging depth up to 38 mm. A 0.36 mm² chip-based engine indicates a route toward smaller modules and a different component revenue mix.
By Application: Coating Metrology Anchors Revenue, While Defect Detection Expands Fastest
Layer and coating thickness measurement accounted for 29.84% of the Optical Coherence Tomography for Industrial Inspection Market application revenue in 2025. It supports non-contact measurement in pharmaceutical coatings, optical films, conformal coatings, and display adhesives. A 2025 review reported average deviations of 1 µm from reference methods for printed circuit board coating measurements. The approach avoids contact-related contamination and can fit industrial line speeds. Surface profiling and 3D metrology also support precision machining and display-panel flatness checks.
Internal defect and void detection is projected to expand at a 12.93% CAGR through 2031. It addresses internal imaging needs in additive production, electric vehicle battery assembly, and advanced composites, where X-ray CT may be too slow. In metal directed energy deposition, closed-loop OCT control reduced porosity to 0.036%- 0.043% by volume through real-time interlayer feedback. Weld monitoring, adhesive inspection, material characterization, and microfluidic flow measurement extend use across automotive and pharmaceutical device production. These applications broaden the use of Optical Coherence Tomography in Industrial Inspection beyond coating metrology.
By End-User Industry: Semiconductor Leads, While Additive Manufacturing Has the Highest Growth Rate
Semiconductor and advanced electronics manufacturing accounted for 27.43% of end-user revenue in the Optical Coherence Tomography for Industrial Inspection Market in 2025. Heterogeneous integration, chiplet designs, and bump pitches below 10 µm require fast, non-contact volumetric inspection during packaging. Automotive and electric-vehicle producers constitute the next major customer group for battery assembly, busbar welding, and adhesive-bond inspection. Aerospace and defense users inspect subsurface delamination in carbon-fiber-reinforced polymer structures without cutting the component. These demanding uses keep semiconductor production at the center of the Optical Coherence Tomography for Industrial Inspection Market.
Additive manufacturing is projected to expand at a 13.76% CAGR through 2031, the highest rate among end-user groups. Producers of polymer, metal, and ceramic parts use inline OCT to verify layers during the build. High-temperature fused deposition modeling printers have supported real-time thermoplastic monitoring with swept-source OCT and an air-cooled piezoelectric scanner. Packaging, films, printing, pharmaceuticals, medical devices, plastics, composites, ceramics, solar equipment, laboratories, and contract testing also add demand. Their needs include film-gap detection, solar-encapsulant checks, and ceramic additive monitoring.
Geography Analysis
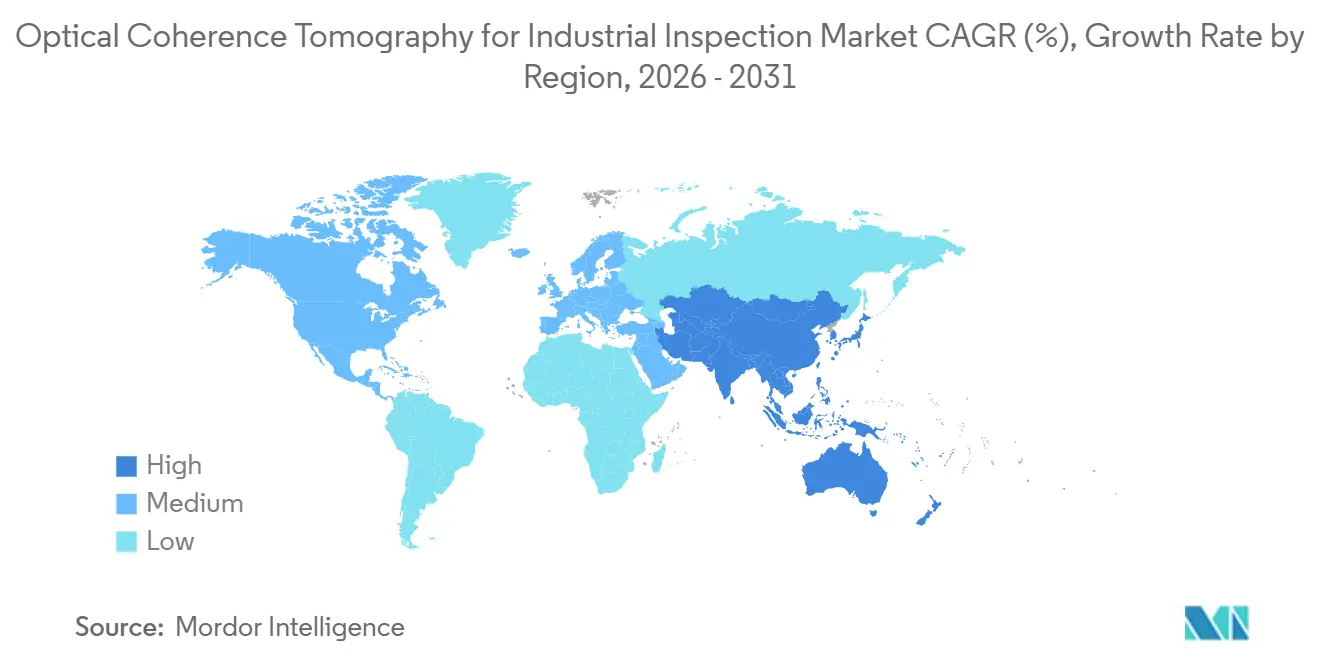
Asia-Pacific held 43.76% of the Optical Coherence Tomography for Industrial Inspection Market share in 2025 and is projected to expand at a 13.19% CAGR through 2031. The region encompasses semiconductor, display, and electric-vehicle battery production across South Korea, Japan, and China. South Korea generates demand for swept-source and spectral-domain OCT in layer inspection and surface profiling. Japan has an established supply base, and Santec displayed its Quantum OCT system at Expo 2025 Osaka in March 2025. China adds volume demand through semiconductor packaging and electric vehicle battery manufacturing.
North America and Europe are the second- and third-largest geographic blocks in the Optical Coherence Tomography for Industrial Inspection Market in 2026, respectively. The United States supports demand through semiconductor packaging and aerospace composite inspection. Canada-based Novacam Technologies Inc. makes swept-source OCT profilometry systems for aerospace, automotive, power generation, and electronics. Germany leads European use in automotive laser-welding monitoring and pharmaceutical coating inspection. France and the United Kingdom have aerospace composite programs where OCT is gaining use alongside ultrasonic inspection.
South America is at an earlier stage in the Optical Coherence Tomography for Industrial Inspection Market and is supplied largely with imported systems for pharmaceutical packaging and precision machining. The Middle East and Africa are the smallest regional blocks in 2026, although Saudi Arabia and the United Arab Emirates are investing in advanced manufacturing. South Africa's automotive sector is the most immediate industrial OCT opportunity on the continent. Limited local application engineering capacity constrains adoption across South America, the Middle East, and Africa.

Competitive Landscape
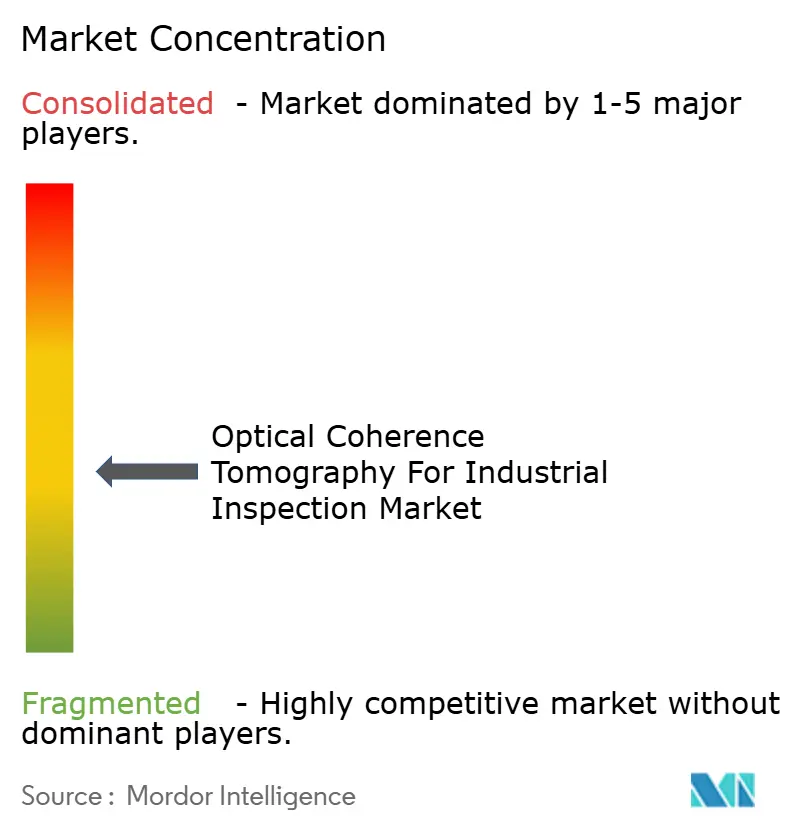
The Optical Coherence Tomography for Industrial Inspection Market is moderately fragmented across component specialists, system integrators, and vertically integrated photonics companies. Component suppliers provide light sources, spectrometers, and interferometric assemblies, while integrators tailor inspection platforms for individual production processes. Larger photonics groups compete across a broader share of the hardware stack. Mid-infrared OCT, chip-scale engines, and software for varied defect libraries remain open areas. Suppliers compete on A-scan rates and resolution and also develop probes and algorithms for battery welding, composite inspection, and semiconductor metrology.
Thorlabs follows a full-stack approach in the Optical Coherence Tomography for Industrial Inspection Market. Its July 2026 Telesto® update offered axial resolution below 3.4 µm, A-scan rates up to 146 kHz, and a software development kit. The combination supports direct factory integration and image performance. Santec launched an Advanced OFDR system for optical fiber and photonic device testing in March 2026. These actions show that source technology, software access, and inspection performance are becoming closely linked.
NKT Photonics A/S became Hamamatsu Photonics A/S on June 25, 2026, following its acquisition by Hamamatsu Photonics K.K. in 2024. SuperLight Photonics and chip-based OCT developers also challenge the designs of the Optical Coherence Tomography for Industrial Inspection Market with lower-noise sources and smaller engines. Patent activity in coaxial OCT and AI-assisted classification points to greater competition around process-control capabilities. No combined market share for leading companies is provided, so the concentration score cannot be determined from the available information.
Optical Coherence Tomography For Industrial Inspection Industry Leaders
Novacam Technologies Inc.
Santec Holdings Corporation
Thorlabs, Inc.
Wasatch Photonics, Inc.
BaySpec, Inc.
- *Disclaimer: Major Players sorted in no particular order

Recent Industry Developments
- August 2026: Researchers published a foundry-compatible PIC-based SS-OCT system in PhotoniX Synergy integrating SiN interferometers and Ge photodiodes on a 0.36 mm² chip with 87 dB sensitivity and wafer thickness absolute errors below 2 µm, a significant step toward mass-producible chip-scale OCT engines for semiconductor fabs.
- July 2026: Thorlabs launched the Telesto® Series SD-OCT platform, models TEL241 and TEL341, with axial resolution below 3.4 µm in air, A-scan rates up to 146 kHz, and 2 mm imaging depth, targeting semiconductor materials, display technologies, and solid-state battery inspection with a software development kit enabling custom industrial integration.
- June 2026: NKT Photonics A/S was integrated into Hamamatsu Photonics Group and renamed Hamamatsu Photonics A/S following the 2024 acquisition by Hamamatsu Photonics K.K., consolidating a photonic crystal fiber and ultrafast laser portfolio within a global photonics group.v
- March 2026: Santec launched its Advanced OFDR system offering micron-level precision for optical fiber and photonic device testing, extending its swept-source interferometry infrastructure into adjacent photonic device testing markets.


Global Optical Coherence Tomography For Industrial Inspection Market Report Scope
Optical Coherence Tomography for Industrial Inspection is a non-destructive, high-resolution imaging technology that uses low-coherence light to capture micrometer-resolution, cross-sectional images of internal structures and surfaces, enabling precise subsurface defect detection, layer thickness measurement, and material characterization in opaque or semi-transparent industrial materials.
The Optical Coherence Tomography for Industrial Inspection Market Report is Segmented by Technology (Time-Domain OCT, Spectral-Domain OCT, Swept-Source OCT, Full-Field OCT, and Polarization-Sensitive OCT), Component (Light Sources, Interferometers and Fiber Assemblies, Detectors and Cameras, OCT Spectrometers, Scanning Systems and Optical Probes, and Signal Processing and Control Units), Application (Layer and Coating Thickness Measurement, Internal Defect and Void Detection, Surface Profiling and 3D Metrology, Weld Penetration and Process Monitoring, Seal, Bond, and Adhesive Inspection, Material Characterization, and Microfluidic and Flow Measurement), End-User Industry (Semiconductor and Advanced Electronics Manufacturing, Automotive and Electric Vehicles, Aerospace and Defense, Additive Manufacturing, Packaging, Films, and Printing, Plastics, Composites, and Ceramics, Pharmaceuticals and Medical Devices, Solar and Energy Equipment, Research Laboratories and Contract Testing, and Other End-User Industries), and Geography (North America, South America, Europe, Asia-Pacific, Middle East and Africa). The Market Forecasts are Provided in Terms of Value (USD).
| Time-Domain OCT |
| Spectral-Domain OCT |
| Swept-Source OCT |
| Full-Field OCT |
| Polarization-Sensitive OCT |
| Light Sources |
| Interferometers and Fiber Assemblies |
| Detectors and Cameras |
| OCT Spectrometers |
| Scanning Systems and Optical Probes |
| Signal Processing and Control Units |
| Layer and Coating Thickness Measurement |
| Internal Defect and Void Detection |
| Surface Profiling and 3D Metrology |
| Weld Penetration and Process Monitoring |
| Seal, Bond, and Adhesive Inspection |
| Material Characterization |
| Microfluidic and Flow Measurement |
| Semiconductor and Advanced Electronics Manufacturing |
| Automotive and Electric Vehicles |
| Aerospace and Defense |
| Additive Manufacturing |
| Packaging, Films, and Printing |
| Plastics, Composites, and Ceramics |
| Pharmaceuticals and Medical Devices |
| Solar and Energy Equipment |
| Research Laboratories and Contract Testing |
| Other End-User Industries |
| North America | United States | |
| Canada | ||
| Mexico | ||
| South America | Brazil | |
| Argentina | ||
| Rest of South America | ||
| Europe | Germany | |
| United Kingdom | ||
| France | ||
| Italy | ||
| Spain | ||
| Rest of Europe | ||
| Asia-Pacific | China | |
| Japan | ||
| India | ||
| South Korea | ||
| Rest of Asia-Pacific | ||
| Middle East and Africa | Middle East | Saudi Arabia |
| United Arab Emirates | ||
| Turkey | ||
| Rest of the Middle East | ||
| Africa | South Africa | |
| Nigeria | ||
| Rest of Africa | ||
| By Technology | Time-Domain OCT | ||
| Spectral-Domain OCT | |||
| Swept-Source OCT | |||
| Full-Field OCT | |||
| Polarization-Sensitive OCT | |||
| By Component | Light Sources | ||
| Interferometers and Fiber Assemblies | |||
| Detectors and Cameras | |||
| OCT Spectrometers | |||
| Scanning Systems and Optical Probes | |||
| Signal Processing and Control Units | |||
| By Application | Layer and Coating Thickness Measurement | ||
| Internal Defect and Void Detection | |||
| Surface Profiling and 3D Metrology | |||
| Weld Penetration and Process Monitoring | |||
| Seal, Bond, and Adhesive Inspection | |||
| Material Characterization | |||
| Microfluidic and Flow Measurement | |||
| By End-User Industry | Semiconductor and Advanced Electronics Manufacturing | ||
| Automotive and Electric Vehicles | |||
| Aerospace and Defense | |||
| Additive Manufacturing | |||
| Packaging, Films, and Printing | |||
| Plastics, Composites, and Ceramics | |||
| Pharmaceuticals and Medical Devices | |||
| Solar and Energy Equipment | |||
| Research Laboratories and Contract Testing | |||
| Other End-User Industries | |||
| By Geography | North America | United States | |
| Canada | |||
| Mexico | |||
| South America | Brazil | ||
| Argentina | |||
| Rest of South America | |||
| Europe | Germany | ||
| United Kingdom | |||
| France | |||
| Italy | |||
| Spain | |||
| Rest of Europe | |||
| Asia-Pacific | China | ||
| Japan | |||
| India | |||
| South Korea | |||
| Rest of Asia-Pacific | |||
| Middle East and Africa | Middle East | Saudi Arabia | |
| United Arab Emirates | |||
| Turkey | |||
| Rest of the Middle East | |||
| Africa | South Africa | ||
| Nigeria | |||
| Rest of Africa | |||


Key Questions Answered in the Report
What is the size of the Optical Coherence Tomography for Industrial Inspection Market?
The market size is USD 0.64 billion in 2026 and is projected to reach USD 1.09 billion by 2031 at an 11.24% CAGR.
Which technology has the largest revenue share?
Swept-source OCT led technology revenue with a 46.38% share in 2025 because it supports fast inspection through multilayer assemblies.
Which application is projected to expand fastest?
Internal defect and void detection is projected to expand at a 12.93% CAGR through 2031, supported by additive manufacturing, battery assembly, and composites inspection.
Which end-user group is expected to expand fastest?
Additive manufacturing is expected to expand at a 13.76% CAGR through 2031 as producers use inline OCT for layer-by-layer verification.
Which region has the highest expected expansion rate?
Asia-Pacific is projected to expand at a 13.19% CAGR through 2031 and held a 43.76% share in 2025.
What limits wider use of industrial OCT systems?
Key limits include reduced penetration in opaque materials and the cost of production-line integration, calibration, and application engineering.
Page last updated on:


 Your data is secure and never sold or shared.


