
Photoacoustic Imaging For Industrial Inspection Market Size and Share
Market Overview
| Study Period | 2020 - 2031 |
|---|---|
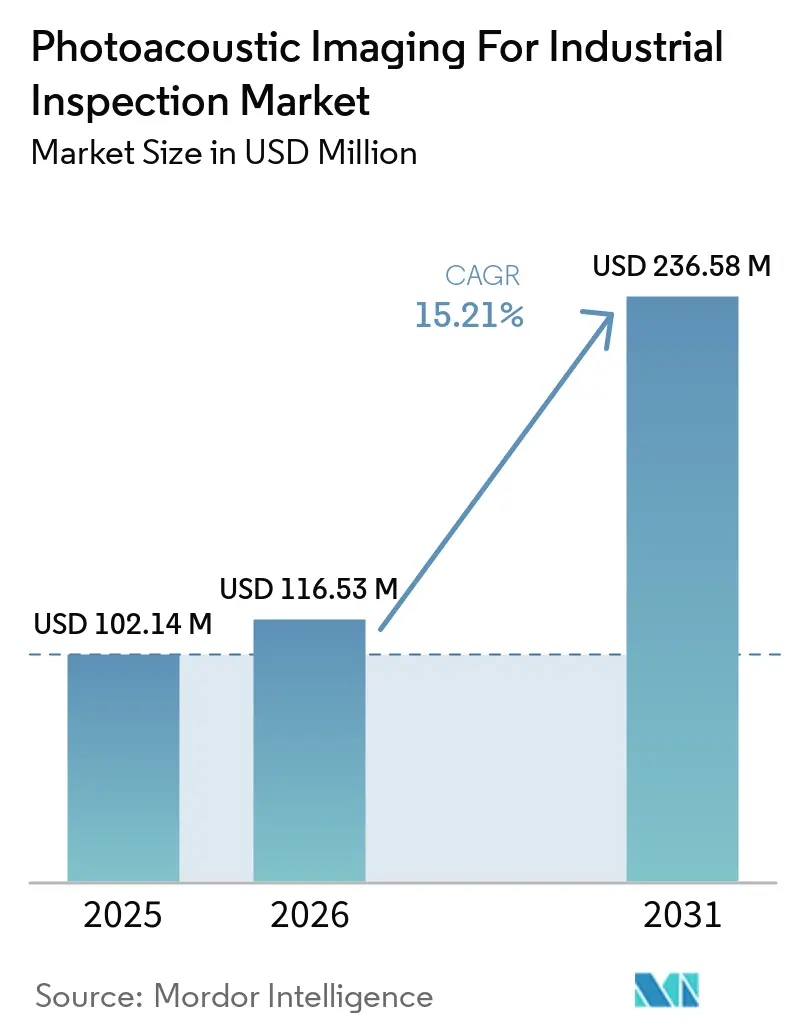
| Market Size (2026) | USD 116.53 Million |
| Market Size (2031) | USD 236.58 Million |
| Growth Rate (2026 - 2031) | 15.21 % |
| Fastest Growing Market | Asia-Pacific |
| Largest Market | North America |
| Market Concentration | Medium |
Major Players *Disclaimer: Major Players sorted in no particular order Image © Mordor Intelligence. Reuse requires attribution under CC BY 4.0. | |
Photoacoustic Imaging For Industrial Inspection Market Analysis by Mordor Intelligence
The Photoacoustic Imaging for Industrial Inspection Market size was valued at USD 102.14 million in 2025 and is expected to reach USD 236.58 million by 2031, advancing at a CAGR of 15.21% during 2026-2031. Growth is tied to semiconductor fabrication, aerospace maintenance, and advanced energy manufacturing, where quality assurance requirements are becoming more demanding because concealed defects can pose significant production, reliability, and safety risks. The Photoacoustic Imaging for Industrial Inspection Market benefits from a noncontact inspection approach that does not use ionizing radiation or liquid coupling fluids. This makes the technology relevant for bonded wafers, carbon-fiber-reinforced polymer structures, multilayer battery housings, and advanced semiconductor packages that need reliable subsurface evaluation during manufacturing. Suppliers are pursuing integrated systems for immediate deployment while also offering modules that can be incorporated into established inspection platforms, a choice that supports different purchasing models and service capabilities. High costs for lasers, detectors, and calibration remain material barriers, while the lack of dedicated qualification standards can delay procurement and broader production deployment in regulated applications.
Key Report Takeaways
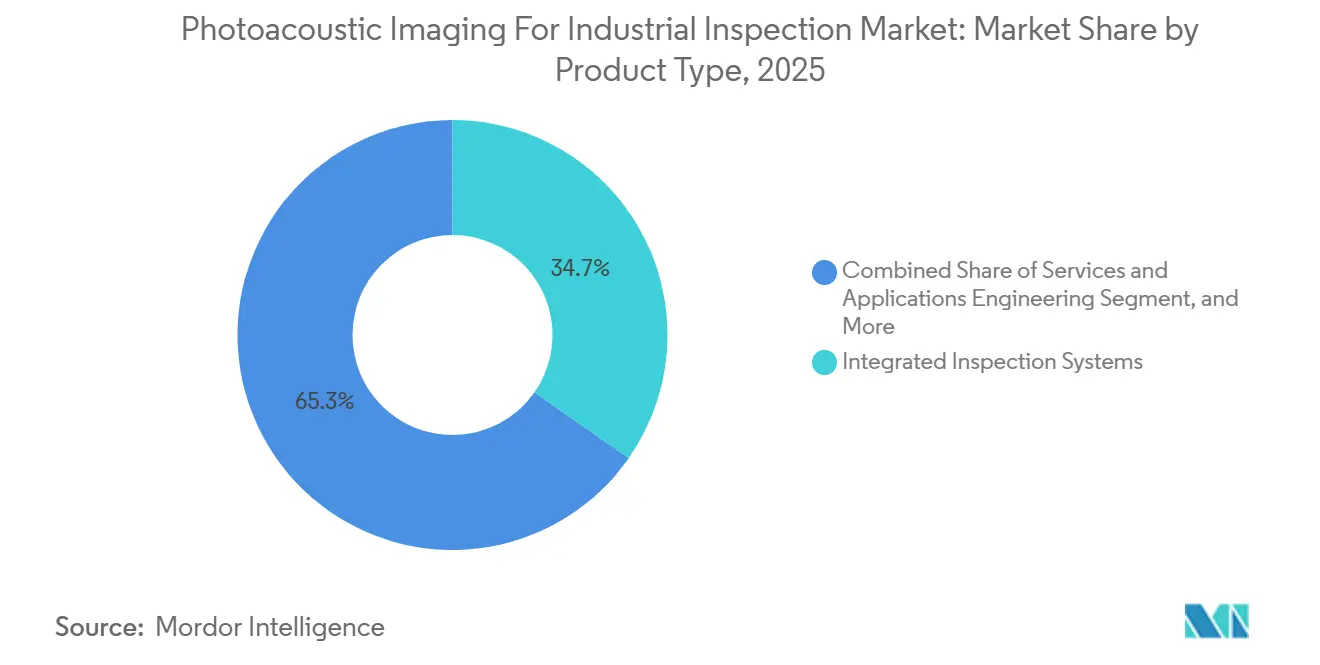
- By product type, Integrated Inspection Systems held 34.72% of the Photoacoustic Imaging for Industrial Inspection Market share in 2025, while OEM Modules and Subsystems are projected to expand at a 16.87% CAGR through 2031.
- By technology, Photoacoustic Tomography accounted for 38.46% of the Photoacoustic Imaging for Industrial Inspection Market share in 2025, while Photoacoustic Spectroscopic Imaging is projected to grow at a 16.76% CAGR through 2031.
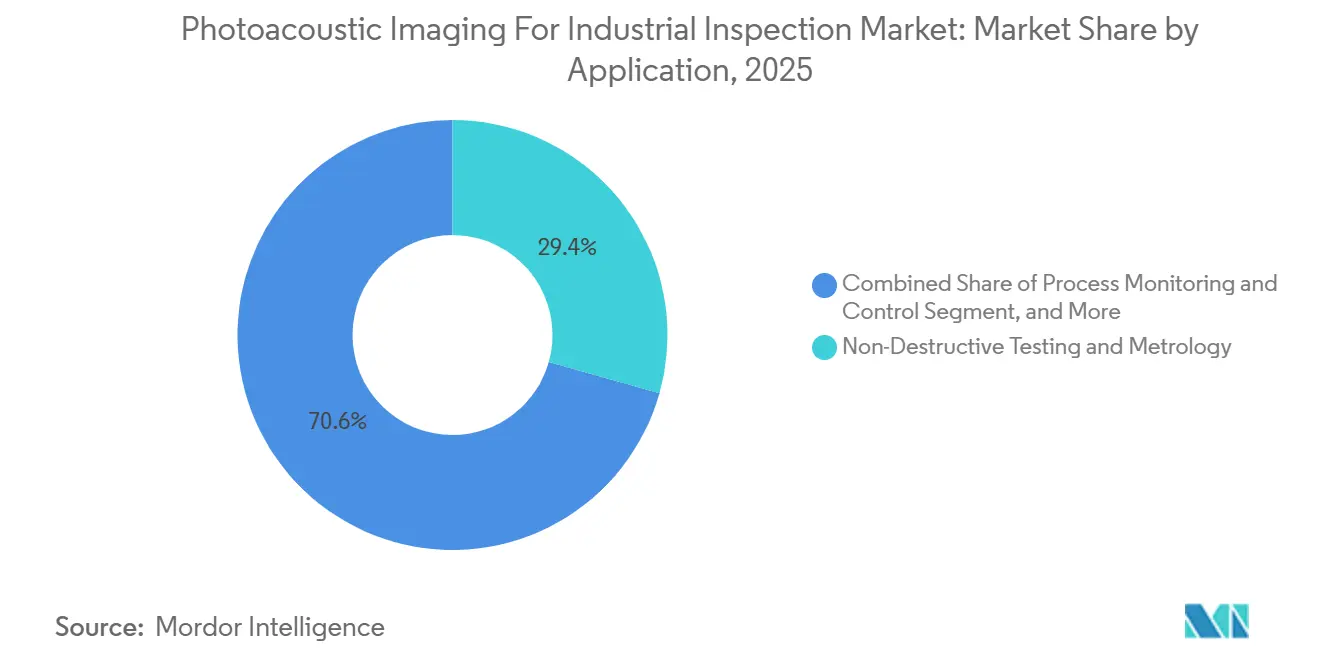
- By application, Non-Destructive Testing and Metrology accounted for 29.37% of the Photoacoustic Imaging for Industrial Inspection Market share in 2025, while Inline Quality Inspection is projected to grow at a 16.52% CAGR through 2031.
- By end-user, Semiconductor and Electronics held 23.84% of the Photoacoustic Imaging for Industrial Inspection Market share in 2025, while Automotive is projected to grow at a 16.43% CAGR through 2031.
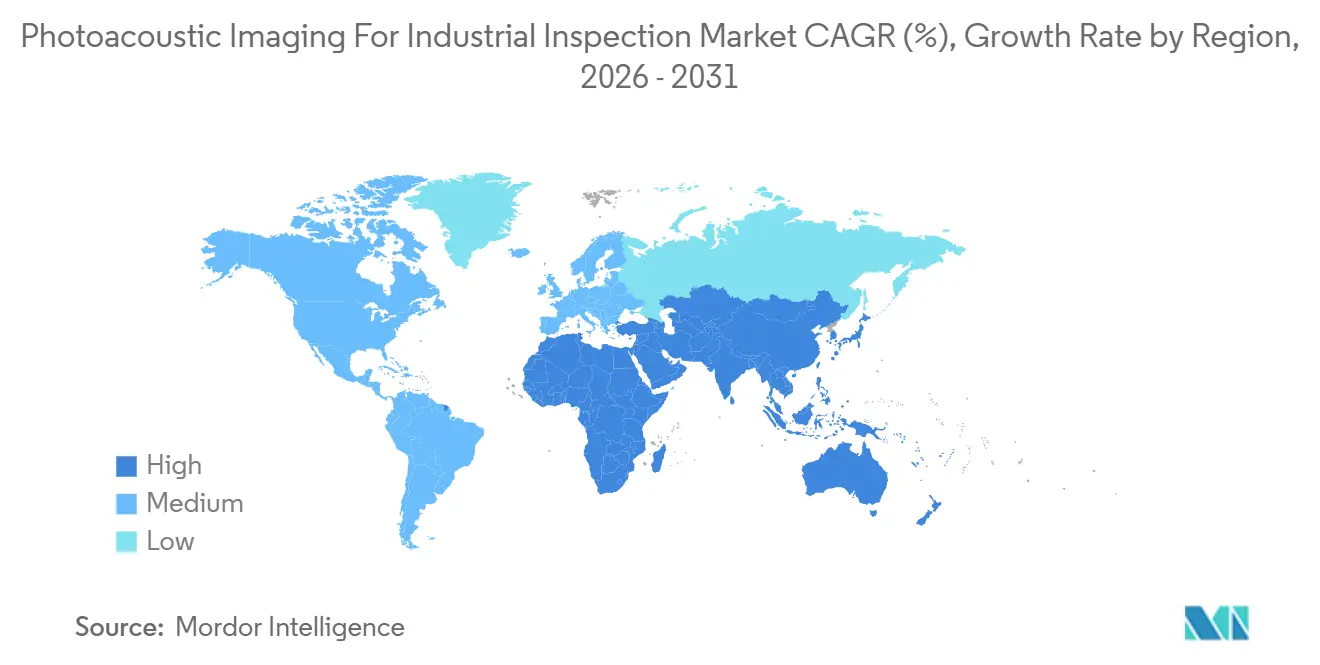
- By geography, North America held 36.58% of the Photoacoustic Imaging for Industrial Inspection Market share in 2025, while Asia-Pacific is projected to expand at a 16.69% CAGR through 2031.
Note: Market size and forecast figures in this report are generated using Mordor Intelligence’s proprietary estimation framework, updated with the latest available data and insights as of January 2026.
Global Photoacoustic Imaging For Industrial Inspection Market Trends and Insights
Drivers Impact Analysis*
| Driver | (~) % Impact on CAGR Forecast | Geographic Relevance | Impact Timeline |
|---|---|---|---|
| Contactless Inspection of Bonded and Layered Materials | +3.2% | Global, with concentration in North America and Asia-Pacific | Short term (≤ 2 years) |
| Semiconductor and Advanced Packaging Defect Detection | +2.8% | Asia-Pacific core, South Korea, Taiwan, China, and Japan, with spillover to North America | Short term (≤ 2 years) |
| Real-Time Process and Emissions Monitoring | +2.5% | Global, with early gains in North America and Europe | Medium term (2-4 years) |
| Non-Ionizing Inspection for High-Value Components | +2.1% | North America and Europe | Medium term (2-4 years) |
| Tunable Lasers, MEMS Sensors, and Machine Learning Integration | +1.9% | Global, led by North America and Asia-Pacific | Medium term (2-4 years) |
| Inline Inspection of Composite and Battery Materials | +1.7% | Europe and Asia-Pacific EV manufacturing hubs | Long term (≥ 4 years) |
| Source: Mordor Intelligence | |||
Demand for Contactless Inspection of Bonded and Layered Materials Reshapes Quality Assurance
Manufacturers are using more multilayer designs in semiconductor packages, bonded wafers, aerospace panels, and lithium-ion cells. These structures require inspection methods that can detect defects without damaging the finished surfaces. Immersion ultrasonics require liquid coupling, which can be unsuitable for precision surfaces and sealed battery modules. X-ray computed tomography also faces radiation and throughput constraints in dense packaging applications. Photoacoustic remote sensing microscopy scanned 2 by 2 cm areas in under 6 minutes and produced three-dimensional defect images in stainless steel and silicon substrates. A 2024 flip-chip study showed that photoacoustic remote sensing could distinguish multilayer structures, electrodes, and silicon cracks without contact or fluid.
Semiconductor and Advanced Packaging Defect Detection Requirements Anchor Demand
Chiplet integration, three-dimensional stacking, chip-on-wafer production, and bonded MEMS have increased the need for subsurface defect inspection. Conventional methods can require disassembly or use radiation, which limits their suitability for certain applications. Tohoku University reported a frequency-auto-variable laser-ultrasonic system in January 2026 that enabled three-dimensional defect visualization in materials that phased-array ultrasonics could not access.[1]Tohoku University, “Research Results Press Release, Applied Physics Letters,” Tohoku University, ohara-lab.jp Acoustic-resolution photoacoustic microscopy has differentiated defective and intact chip areas through time-domain waveform analysis. The same scanning head can serve mixed fabrication lines by adjusting laser pulse settings and signal processing. That flexibility supports use across MEMS, power electronics, and compound semiconductor substrates.
Real-Time Process and Emissions Monitoring Expands Addressable Applications
The Photoacoustic Imaging for Industrial Inspection Market also serves process monitoring and industrial emissions measurement. Quantum cascade laser photoacoustic spectroscopy sensors can detect methane, nitrous oxide, carbon monoxide, nitrogen dioxide, and hydrogen fluoride at low concentrations. These capabilities support fugitive emissions monitoring at refinery and chemical plant fence lines. A 2026 field evaluation validated a quantum-cascade-laser photoacoustic aerodynamic-gradient system for ammonia flux measurements in outdoor conditions. Resonant photoacoustic sensors for transformer dissolved-gas analysis have also demonstrated parts-per-billion detection of acetylene, which supports earlier identification of arcing faults. Utilities can use these analyzers to build an installed base that requires calibration and service support over time.
Non-Ionizing Inspection Requirements Support Substitution in High-Value Components
Radiation safety requirements can limit the use of X-ray computed tomography in high-throughput production settings. Photoacoustic systems do not use ionizing radiation, which removes the need for radiation-shielding infrastructure. This is relevant for helicopter rotor hub bolts, wind-turbine blade spars, and aerospace engine fan blades that require thorough inspection. A study of multilayer electronics found that photoacoustic and optical coherence imaging visualized internal features not visible to optical microscopy or automated optical inspection. These attributes strengthen the case for adoption in the Photoacoustic Imaging for Industrial Inspection Market, where contact, radiation, long inspection cycles, or liquid coupling could be unsuitable for sensitive, high-value, or complex component designs.
Restraints Impact Analysis*
| Restraint | (~) % Impact on CAGR Forecast | Geographic Relevance | Impact Timeline |
|---|---|---|---|
| Limited Industrial Standardization and Qualification Protocols | -1.8% | Global | Short term (≤ 2 years) |
| High Laser, Detector, and Calibration-System Costs | -1.6% | Global, most acute in South America, Middle East, and Africa | Medium term (2-4 years) |
| Sensitivity to Optical Access, Surface Condition, and Acoustic Coupling | -1.1% | Global | Medium term (2-4 years) |
| Shortage of Application-Specific Inspection Expertise | -0.8% | Global, most acute in developing regions | Long term (≥ 4 years) |
| Source: Mordor Intelligence | |||
Limited Industrial Standardization and Qualification Protocols Slow Procurement Decisions
Photoacoustic imaging is not yet recognized as a dedicated method in major NDT personnel qualification frameworks. ASNT 9712, aligned with ISO 9712, covers magnetic particle, penetrant, radiographic, ultrasonic, and visual testing methods. It does not include photoacoustic or optoacoustic inspection. The ISO 9712 updates introduced a new certification scheme as of January 1, 2026, but the listed changes do not establish photoacoustic inspection as a method. CSWIP Aerospace, oil and gas, and nuclear users can therefore treat deployments as supplementary methods when contracts require certified personnel. Procurement is likely to remain concentrated in research-linked and early-adopter facilities until recognized protocols emerge.
High Laser, Detector, and Calibration-System Costs Limit Broad Industrial Adoption
Pulsed Nd:YAG lasers, tunable mid-infrared quantum cascade laser arrays, and sensitive detection systems account for a substantial share of system costs. Small and mid-sized manufacturers can face a significant affordability barrier when considering specialized equipment. The Photoacoustic Imaging for Industrial Inspection Market can reduce this constraint when measurement heads are sold as OEM modules within wider inspection systems. This approach spreads the costs of the laser and detector across more measurement channels. It also explains why suppliers are giving greater attention to modules and subsystems. Lower-cost ultrasound and thermographic cameras will remain alternatives where their sensitivity and resolution meet the inspection requirement, particularly when a manufacturer does not need the depth, noncontact operation, or material-specific measurement capabilities offered by photoacoustic methods.
*Our forecasts treat driver/restraint impacts as directional, not additive. The impact forecasts reflect baseline growth, mix effects, and variable interactions.
Segment Analysis
By Product Type: Integrated Systems Lead While OEM Modules Gain Scale
Integrated Inspection Systems held 34.72% of the Photoacoustic Imaging for Industrial Inspection Market share in 2025. Their early use in semiconductor and aerospace settings reflects buyer demand for turnkey equipment. These platforms combine laser sources, acoustic transducers, signal-processing electronics, and analysis software. They can also include application-specific configurations, calibration protocols, and service arrangements. This structure reduces integration work for buyers in regulated environments and lowers the practical risk of deploying a relatively new inspection method in production.
OEM Modules and Subsystems are projected to expand at a 16.87% CAGR through 2031. The Photoacoustic Imaging for Industrial Inspection Market size for this product type is supported by developers supplying measurement heads and detector modules to established equipment OEMs. These partners operate in the automated test equipment and process analytical technology sectors, and the model can shorten sales cycles while extending geographic reach without a dedicated global service network. Spectroscopic analyzers remain relevant for chemical process control, transformer dissolved-gas analysis, and fugitive emissions measurement, while photoacoustic microscopes support high-resolution materials characterization at semiconductor fabs and research institutes.



By Technology: Tomography Supports Installed Use While Spectroscopic Imaging Advances
Photoacoustic Tomography held 38.46% of the Photoacoustic Imaging for Industrial Inspection Market share in 2025. It has an established role in three-dimensional subsurface imaging of bonded composites, multilayer ceramics, and industrial electronics. Its reconstruction methods are more mature than those of several other modalities. Buyers can draw on published application references when assessing system performance, while Optical-Resolution Photoacoustic Microscopy provides submicron lateral resolution for semiconductor and electronics work. Acoustic-Resolution Photoacoustic Microscopy offers deeper penetration but lower lateral resolution for thicker composite and metallic structures.
Photoacoustic Spectroscopic Imaging is projected to grow at a 16.76% CAGR through 2031. It can measure gases and condensed materials through selective laser absorption and pressure-wave detection, and the same optical platform can be adapted for semiconductor chamber effluent monitoring, refinery fence-line leak detection, and pharmaceutical process control. Gasera participates in the EU-funded RAVEN project, which is developing miniaturized photonic-integrated-circuit gas sensors for process analytical technology applications.[2]Gasera Oy “RAVEN Project, Next-Generation Miniaturized Gas Sensors on Photonic Integrated Circuit Technology,” gasera.fi Changes in laser wavelength and resonant-cell design enable this adaptation, broadening the commercial role of Photoacoustic Imaging in the Industrial Inspection Market beyond structural inspection.
By Application: NDT Leads While Inline Quality Inspection Changes Production Workflows
Non-Destructive Testing and Metrology accounted for 29.37% of the Photoacoustic Imaging for Industrial Inspection Market share in 2025. Aerospace, oil and gas, and nuclear applications have long relied on NDT for safety-critical components. Internal Defect and Interface Inspection supports the identification of delaminations, voids, and interfacial disbonds in bonded assemblies. Material and Composition Characterization can assess porosity, variations in Young's modulus, and compositional gradients. These functions are relevant to battery electrode work and additive-manufactured component qualification, while Process Monitoring and Control and Failure Analysis and Root-Cause Investigation serve smaller but higher-value applications.
Inline Quality Inspection is projected to expand at a 16.52% CAGR through 2031. It shifts inspection from periodic sampling to continuous monitoring within the production flow. A 2024 study demonstrated real-time photoacoustic remote sensing of flip-chip fabrication defects at production-line speeds. The work identified missing solder bumps in high-density packages, an application also addressed by X-ray laminography, while inline installations require calibration management and software updates throughout operation. This can shift supplier revenue from a stand-alone equipment sale toward equipment, consumables, and software support.
By End-User: Semiconductor and Electronics Lead While Automotive Expands
Semiconductor and Electronics held 23.84% of the Photoacoustic Imaging for Industrial Inspection Market share in 2025. Demand centers on noncontact subsurface inspection in advanced packaging fabs. Aerospace and Defense is another major user group for carbon-fiber-reinforced polymer fuselage panels, rotor blades, and bonded metal-to-composite joints. These structures can be too large for X-ray computed tomography or too complex for full-structure immersion ultrasonics, while Chemical, Petrochemical, and Oil and Gas users adopt spectroscopy analyzers for process-gas monitoring, transformer analysis, and leak detection. Pharmaceutical and Healthcare, Food and Beverage, Research Institutes, and Contract Laboratories contribute to lower-volume but technically demanding demand.
The automotive industry is projected to grow at a 16.43% CAGR through 2031. The expansion is tied to electric-vehicle battery production and the move toward solid-state battery chemistries. A 2025 IEEE study combined photoacoustic spectroscopy and ultrasonic imaging to identify gas-composition changes and structural defects inside batteries in real time. Separate research applied three-dimensional operando photoacoustic microscopy to lithium-metal plating at 7.8 μm lateral resolution and 0.45 ms per-pixel temporal resolution. These capabilities can support battery quality-control methods as manufacturers increase use of inline inspection, and Automotive could become the second-largest end-user revenue area before 2031.
Geography Analysis
North America held 36.58% of the Photoacoustic Imaging for Industrial Inspection Market share in 2025. The region combines semiconductor capital-equipment activity, defense manufacturing, and university-industry partnerships. The United States represented the largest regional revenue pool through inspection-tool deployments at major outsourced semiconductor assembly and test providers and integrated device manufacturers. Canada contributed through automotive supply chain inspection, while Mexico supported demand through chemical process monitoring applications. The region also provides a practical setting for suppliers to validate equipment with high-volume customers, particularly for semiconductor, defense, and advanced manufacturing buyers who require documented performance before committing to broader deployments in the Photoacoustic Imaging for Industrial Inspection Market.
Asia-Pacific is projected to expand at a 16.69% CAGR through 2031. Investment in advanced packaging across South Korea, Taiwan, and China is occurring alongside battery gigafactory construction in Japan and India. China is expanding acoustic inspection activity in petrochemical settings. Japan and South Korea also support wafer-bonding inspection and advanced materials research. India and Australia remain smaller regional markets with demand from research institutes and pharmaceutical users, while their activity can provide early application references as the Photoacoustic Imaging for Industrial Inspection Market develops across the region.
Europe was the second-largest regional market in 2025, led by Germany, France, and the United Kingdom. Regional startups are commercializing photoacoustic and photothermal systems for aerospace, automotive, and industrial infrastructure uses, while Germany is developing the ZOPAS project for in-situ opto-acoustic evaluation of bonded road-surface layers.[3]Laserinstitut Hochschule Mittweida, “Zerstörungsfreies Opto-Akustisches Prüfverfahren Für Asphaltschichten Des Straßenoberbaus, ZOPAS,” Laserinstitut Hochschule Mittweida, laser.hs-mittweida.de The project extends the Photoacoustic Imaging for Industrial Inspection Market into civil-infrastructure maintenance and is scheduled to run through 2028, while the United Kingdom supports technology evaluation through aerospace maintenance activity and its NDT institutional base. South America, the Middle East, and Africa remain smaller markets, with demand focused on oil and gas monitoring in Brazil, Saudi Arabia, and the United Arab Emirates.

Competitive Landscape
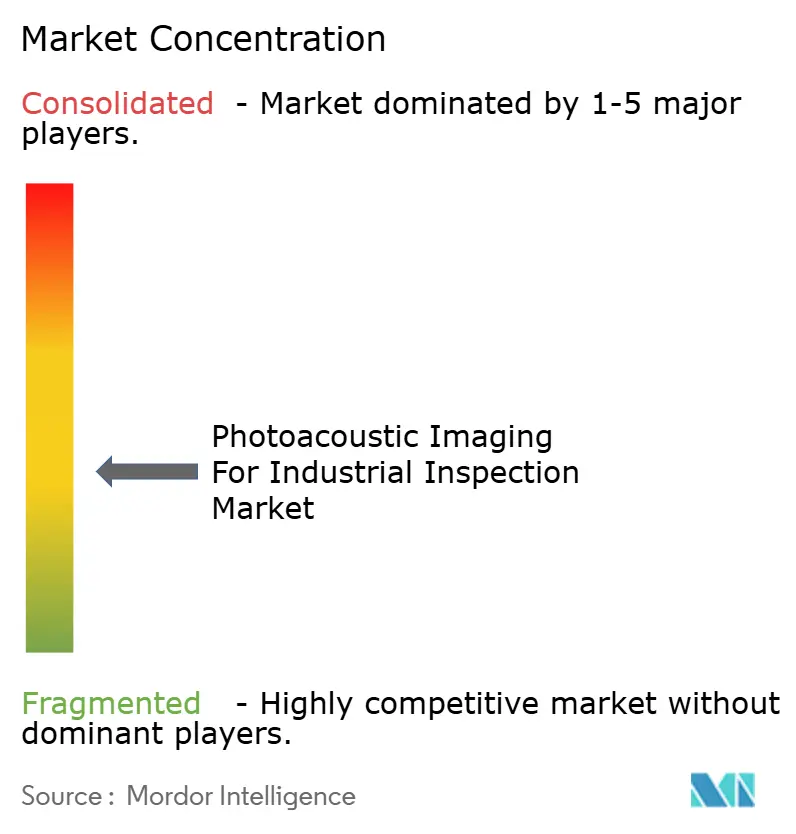
The Photoacoustic Imaging for Industrial Inspection Market is fragmented, and no supplier holds a dominant position across all product types and applications. Specialist firms with academic roots compete alongside diversified test-and-inspection companies. Specialists often focus on a single measurement approach and specific technical use cases, while Gasera differentiates its offering through cantilever-enhanced photoacoustic spectroscopy for high-sensitivity gas measurement. Larger suppliers compete with broader inspection portfolios that include X-ray, optical, and acoustic equipment. This mix keeps procurement decisions in the Photoacoustic Imaging for Industrial Inspection Market closely tied to each customer's application requirements, installation approach, validation needs, and preference for a specialized system or a broader inspection platform.
Nordson combines inspection hardware with AI-enabled analytics through its Nordson Intelligence platform. This approach supports ecosystem integration for semiconductor-fabrication customers, while Gasera's work on miniaturized gas sensors through the RAVEN project illustrates the move toward smaller process-monitoring platforms. Voidsy expanded into France and the United States and partnered with Omni NDE to integrate automated robotic inspection systems. These actions show how specialized providers are seeking geographic coverage and automation partners before larger competitors enter composite and aerospace niches, where signal classification, compact modules, and application-specific calibration can differentiate suppliers.
Laboratory accreditation requirements under ISO 17025 and standards such as ASTM E2533 can encourage demand for documented and validated protocols. Suppliers can respond by publishing measurement-uncertainty and reproducibility information for specific applications, which is important when customers need to qualify a method within an established inspection process. The Photoacoustic Imaging for Industrial Inspection Market therefore rewards technical evidence, service capability, and system integration rather than a single universal product. Competition remains distributed across structural inspection, gas analysis, semiconductor packaging, and battery applications.
Photoacoustic Imaging For Industrial Inspection Industry Leaders
Gasera Oy
AAVOS International B.V.
UAB HILASE
NxPAS ApS
KNESTEL Technologie & Elektronik GmbH
- *Disclaimer: Major Players sorted in no particular order

Recent Industry Developments
- June 2026: Laserinstitut Hochschule Mittweida kicked off the EU- and ERDF-funded ZOPAS project at its campus in Germany, targeting development of an in-situ opto-acoustic NDT system for area-resolved, depth-resolved evaluation of bonded road-surface asphalt layers, the first known application of photoacoustic techniques to civil-infrastructure pavement inspection at field scale. The project runs to 2028.
- May 2026: HÜBNER Photonics GmbH launched the Cobolt 06-HPLD high-power diode laser product line, delivering up to 1.2 W of output power across fixed wavelengths from 405 nm to 975 nm with direct intensity modulation capabilities, expanding the excitation-source options available for photoacoustic inspection system integrators requiring fast modulation and fiber-pigtailed beam delivery.
- March 2026: voidsy GmbH presented the 3D V-ROX photothermal tomography system at JEC World 2026 in Paris at ENGEL's Hall 5 booth, targeting composite-industry customers in aerospace, automotive, and wind energy across the European market.
- March 2026: Gasera Oy exhibited at Pittcon 2026 in San Antonio, Booth 2257, presenting cantilever-enhanced PAS applications for mine safety, greenhouse gas monitoring, and industrial emissions control, accompanied by scientific talks on real-world CEPAS deployment by company researchers.


Global Photoacoustic Imaging For Industrial Inspection Market Report Scope
The photoacoustic imaging for the industrial inspection market comprises technologies and solutions that use photoacoustic principles to detect, visualize, and assess defects, material properties, and structural inconsistencies in industrial components. These systems combine optical excitation with acoustic signal detection to enable non-destructive inspection across applications such as manufacturing, aerospace, automotive, electronics, and energy.
The Photoacoustic Imaging for Industrial Inspection Market Report is Segmented by Product Type (Integrated Inspection Systems, Photoacoustic Spectroscopy Analyzers, Photoacoustic Microscopes, Photoacoustic Tomography Systems, OEM Modules and Subsystems, Software and Analytics, and Services and Applications Engineering), Technology (Optical-Resolution Photoacoustic Microscopy, Acoustic-Resolution Photoacoustic Microscopy, Photoacoustic Tomography, Photoacoustic Spectroscopic Imaging, and Other Technologies), Application (Non-Destructive Testing and Metrology, Internal Defect and Interface Inspection, Material and Composition Characterization, Process Monitoring and Control, Inline Quality Inspection, and Failure Analysis and Root-Cause Investigation), End-User (Semiconductor and Electronics, Aerospace and Defense, Automotive, Chemical and Petrochemical, Oil and Gas, Pharmaceutical and Healthcare, Food and Beverage, Energy and Power Equipment, Research Institutes and Contract Laboratories, and Other End-Users), and Geography (North America, South America, Europe, Asia-Pacific, Middle East, and Africa). The Market Forecasts are Provided in Terms of Value (USD).
| Integrated Inspection Systems |
| Photoacoustic Spectroscopy Analyzers |
| Photoacoustic Microscopes |
| Photoacoustic Tomography Systems |
| OEM Modules and Subsystems |
| Software and Analytics |
| Services and Applications Engineering |
| Optical-Resolution Photoacoustic Microscopy |
| Acoustic-Resolution Photoacoustic Microscopy |
| Photoacoustic Tomography |
| Photoacoustic Spectroscopic Imaging |
| Other Technologies |
| Non-Destructive Testing and Metrology |
| Internal Defect and Interface Inspection |
| Material and Composition Characterization |
| Process Monitoring and Control |
| Inline Quality Inspection |
| Failure Analysis and Root-Cause Investigation |
| Semiconductor and Electronics |
| Aerospace and Defense |
| Automotive |
| Chemical and Petrochemical |
| Oil and Gas |
| Pharmaceutical and Healthcare |
| Food and Beverage |
| Energy and Power Equipment |
| Research Institutes and Contract Laboratories |
| Other End-Users |
| North America | United States |
| Canada | |
| Mexico | |
| South America | Brazil |
| Argentina | |
| Chile | |
| Rest of South America | |
| Europe | Germany |
| United Kingdom | |
| France | |
| Italy | |
| Spain | |
| Rest of Europe | |
| Asia-Pacific | China |
| Japan | |
| India | |
| South Korea | |
| Australia | |
| Rest of Asia-Pacific | |
| Middle East | United Arab Emirates |
| Saudi Arabia | |
| Qatar | |
| Rest of Middle East | |
| Africa | South Africa |
| Egypt | |
| Nigeria | |
| Rest of Africa |
| By Product Type | Integrated Inspection Systems | |
| Photoacoustic Spectroscopy Analyzers | ||
| Photoacoustic Microscopes | ||
| Photoacoustic Tomography Systems | ||
| OEM Modules and Subsystems | ||
| Software and Analytics | ||
| Services and Applications Engineering | ||
| By Technology | Optical-Resolution Photoacoustic Microscopy | |
| Acoustic-Resolution Photoacoustic Microscopy | ||
| Photoacoustic Tomography | ||
| Photoacoustic Spectroscopic Imaging | ||
| Other Technologies | ||
| By Application | Non-Destructive Testing and Metrology | |
| Internal Defect and Interface Inspection | ||
| Material and Composition Characterization | ||
| Process Monitoring and Control | ||
| Inline Quality Inspection | ||
| Failure Analysis and Root-Cause Investigation | ||
| By End-User | Semiconductor and Electronics | |
| Aerospace and Defense | ||
| Automotive | ||
| Chemical and Petrochemical | ||
| Oil and Gas | ||
| Pharmaceutical and Healthcare | ||
| Food and Beverage | ||
| Energy and Power Equipment | ||
| Research Institutes and Contract Laboratories | ||
| Other End-Users | ||
| By Geography | North America | United States |
| Canada | ||
| Mexico | ||
| South America | Brazil | |
| Argentina | ||
| Chile | ||
| Rest of South America | ||
| Europe | Germany | |
| United Kingdom | ||
| France | ||
| Italy | ||
| Spain | ||
| Rest of Europe | ||
| Asia-Pacific | China | |
| Japan | ||
| India | ||
| South Korea | ||
| Australia | ||
| Rest of Asia-Pacific | ||
| Middle East | United Arab Emirates | |
| Saudi Arabia | ||
| Qatar | ||
| Rest of Middle East | ||
| Africa | South Africa | |
| Egypt | ||
| Nigeria | ||
| Rest of Africa | ||


Key Questions Answered in the Report
What is the size of the Photoacoustic Imaging for Industrial Inspection Market?
The market was valued at USD 102.14 million in 2025 and is expected to reach USD 236.58 million by 2031, at a 15.21% CAGR during 2026-2031.
What is driving adoption of photoacoustic inspection systems?
Demand is supported by noncontact inspection of bonded wafers, layered materials, composites, and battery structures, along with process and emissions monitoring.
Which product type led photoacoustic industrial inspection in 2025?
Integrated Inspection Systems led with 34.72% share in 2025, while OEM Modules and Subsystems are projected to record the fastest product growth at 16.87% CAGR.
Which technology is growing fastest in photoacoustic industrial inspection?
Photoacoustic Spectroscopic Imaging is projected to grow at a 16.76% CAGR through 2031, supported by gas and process-monitoring applications.
Which region is expanding fastest for photoacoustic industrial inspection?
Asia-Pacific is projected to expand at a 16.69% CAGR through 2031, supported by semiconductor packaging and electric-vehicle battery investment.
What limits broader use of photoacoustic inspection?
The principal limitations are the absence of dedicated qualification protocols, high equipment costs, operating-condition sensitivity, and limited application-specific expertise.
Page last updated on:





