
Open Source Vulnerability Intelligence Market Size and Share
Market Overview
| Study Period | 2020 - 2031 |
|---|---|
| Market Size (2026) | USD 1.23 Billion |
| Market Size (2031) | USD 3.59 Billion |
| Growth Rate (2026 - 2031) | 23.89 % |
| Fastest Growing Market | Asia-Pacific |
| Largest Market | North America |
| Market Concentration | Medium |
Major Players *Disclaimer: Major Players sorted in no particular order Image © Mordor Intelligence. Reuse requires attribution under CC BY 4.0. | |
Open Source Vulnerability Intelligence Market Analysis by Mordor Intelligence
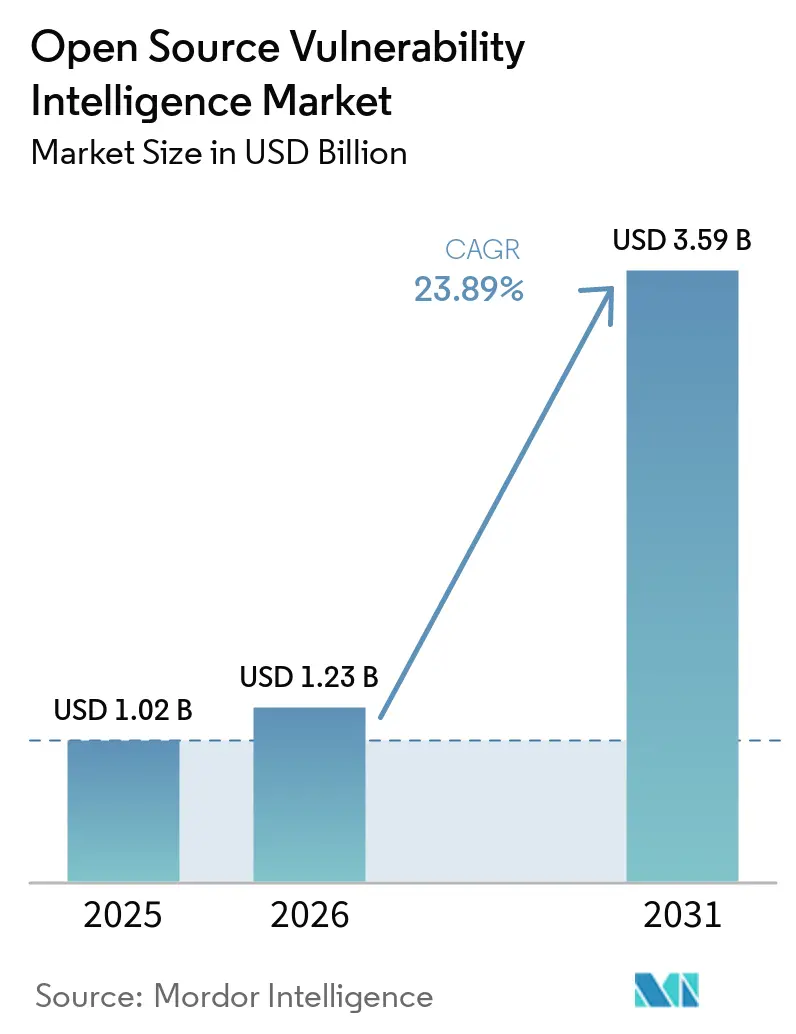
The open source vulnerability intelligence market size was valued at USD 1.02 billion in 2025 and estimated to grow from USD 1.23 billion in 2026 to reach USD 3.59 billion by 2031, at a CAGR of 23.89% during the forecast period (2026-2031). The open source vulnerability intelligence market is expanding as organizations move from periodic scanning toward continuous data that can be used in development and remediation workflows. Shorter exploitation windows are increasing the value of timely and enriched advisory feeds because teams must decide which findings require immediate action. Regulatory requirements are also moving vulnerability intelligence from a discretionary security purchase toward a compliance requirement with recurring reporting and evidence needs. Providers are responding by connecting advisory data with package identity, runtime context, and automated remediation, rather than asking customers to reconcile these inputs manually. This creates opportunities for vendors that improve data accuracy, support practical prioritization, and fit into existing development tools without adding a separate review process.
Key Report Takeaways
- By component, software held 61.49% of the open source vulnerability intelligence market in 2025, while services are projected to expand at a 24.96% CAGR through 2031.
- By deployment mode, cloud held 58.77% of the open source vulnerability intelligence market in 2025 and is projected to expand at a 27.16% CAGR through 2031.
- By organization size, large enterprises held 67.34% of the open source vulnerability intelligence market in 2025, while small and medium-sized enterprises are projected to expand at a 26.91% CAGR through 2031.
- By intelligence function, package, dependency, and version intelligence held 29.68% of the open source vulnerability intelligence market in 2025, while exposure and reachability intelligence is projected to expand at a 26.37% CAGR through 2031.
- By industry vertical, IT and telecommunication held 26.19% of the open source vulnerability intelligence market in 2025, while government and public administration is projected to expand at a 27.21% CAGR through 2031.
- By geography, North America held 36.58% of the open source vulnerability intelligence market in 2025, while Asia-Pacific is projected to expand at a 24.83% CAGR through 2031.
Note: Market size and forecast figures in this report are generated using Mordor Intelligence’s proprietary estimation framework, updated with the latest available data and insights as of January 2026.
Global Open Source Vulnerability Intelligence Market Trends and Insights
Drivers Impact Analysis*
| DRIVER | (~) % IMPACT ON CAGR FORECAST | GEOGRAPHIC RELEVANCE | IMPACT TIMELINE |
|---|---|---|---|
| Regulatory Mandates for Software Supply-Chain Transparency | +5.8% | Global, with primary intensity in North America and Europe | Short term (≤ 2 years) |
| Expansion of Cloud-Native and Open Source Attack Surfaces | +4.9% | Global | Medium term (2-4 years) |
| Shift Toward Exploitability-Led Vulnerability Prioritization | +4.2% | North America, Europe, APAC core | Medium term (2-4 years) |
| DevSecOps and Continuous Integration of Vulnerability Intelligence | +3.6% | North America, APAC core, spill-over to Europe | Medium term (2-4 years) |
| Package-Identity Precision From PURL and OSV-Format Adoption | +2.4% | Global | Long term (≥ 4 years) |
| Shorter Silent-Fix Windows Before Public Disclosure | +1.8% | North America, spill-over to Europe and APAC core | Short term (≤ 2 years) |
| Source: Mordor Intelligence | |||
Regulatory Mandates for Software Supply-Chain Transparency
Compliance deadlines are providing a durable demand base for the open source vulnerability intelligence market. The EU Cyber Resilience Act entered into force on December 10, 2024. The Article 14 reporting obligations for actively exploited vulnerabilities and severe incidents take effect on September 11, 2026. Manufacturers of products with digital elements must establish real-time vulnerability surveillance before formal enforcement begins, including processes that can identify relevant issues and support timely reporting. CISA published its 2026 Minimum Elements for a Software Bill of Materials on July 29, 2026, expanding the baseline from 14 to 23 elements. The new elements cover component provenance, hash attestation, PURL identifiers, and generation context, which support structured vulnerability intelligence at scale.
Expansion of Cloud-Native and Open Source Attack Surfaces
Open-source software use is expanding the number of dependencies that security teams must monitor. Datadog reported in February 2026 that 87% of organizations had at least 1 known exploitable vulnerability in deployed services. The company also found that 42% of services depended on libraries that were no longer actively maintained. These conditions make ongoing package and version monitoring more important for the open source vulnerability intelligence market because a single service can incorporate many external components with different maintenance histories. OSV had standardized vulnerability representation across 30 ecosystems by the end of 2024, including 4 new Linux distribution adopters.[1]Google Open Source Security Team, “2024 in Review,” OSV, osv.dev A common format gives commercial products a better base for matching ecosystem-specific vulnerabilities with deployed components and presenting a consistent result to development teams.
Shift Toward Exploitability-Led Vulnerability Prioritization
Security teams are giving more weight to evidence of exploitability than to severity scores alone. CISA BOD 26-04 removed CVSS as a remediation prioritization requirement and instead uses public exposure, KEV status, exploit automation, and technical impact. Datadog found that only 18% of vulnerabilities labeled critical remained critical after runtime context was applied. This result supports demand for reachability analysis that tests whether a vulnerable function can be reached in a deployed environment, rather than treating every affected component as equally urgent. FIRST's Exploit Prediction Scoring System provides probability scores based on observed threat-actor behavior.[2]Forum of Incident Response and Security Teams, “Exploit Prediction Scoring System Model,” FIRST, first.org The open source vulnerability intelligence market is favoring products that reduce remediation queues with evidence, provide a clearer order of work, and avoid broad alert volumes that cannot be acted upon quickly.
DevSecOps and Continuous Integration of Vulnerability Intelligence
Vulnerability intelligence is increasingly becoming part of the developer workflow. Datadog found that 50% of organizations adopted new library versions within 24 hours of release. This pace leaves little time for a separate security review before software reaches production and places greater emphasis on checks that can occur during normal development. JFrog launched Zero-Touch Remediation on September 2, 2026, to identify and apply partner-supplied fixes through customer pipelines. Snyk also integrated Anthropic's Claude into its AI Security Platform in May 2026 for automated discovery, prioritization, and developer-ready fixes. These releases show that customers increasingly expect intelligence and remediation to work within the same delivery process, with findings translated into actions that developers can review and apply.
Restraints Impact Analysis*
| RESTRAINT | (~) % IMPACT ON CAGR FORECAST | GEOGRAPHIC RELEVANCE | IMPACT TIMELINE |
|---|---|---|---|
| Fragmented Advisory Taxonomies and Product-Mapping Quality | -3.2% | Global | Medium term (2-4 years) |
| Shortage of Vulnerability-Research and Triage Specialists | -2.8% | Global, most acute in MEA, South America, and Southeast APAC | Long term (≥ 4 years) |
| Adversarial Poisoning of Public Proof-of-Concept and Advisory Feeds | -1.9% | Global | Short term (≤ 2 years) |
| License, Attribution, and Data-Redistribution Constraints | -1.4% | North America and Europe | Long term (≥ 4 years) |
| Source: Mordor Intelligence | |||
Fragmented Advisory Taxonomies and Product-Mapping Quality
Fragmented advisory taxonomies can undermine the value of commercial intelligence feeds. Sonatype analyzed more than 1,700 open-source CVEs during 2025 and identified 20,362 false positives and 167,286 false negatives across prevailing intelligence ecosystems.[3]Sonatype, “2026 State of the Software Supply Chain, Vulnerability Management,” Sonatype, sonatype.com A CVE can be mapped to a generic product in one database and to ecosystem-specific versions in another. This can produce conflicting results when organizations combine multiple feeds. CISA's 2026 SBOM guidance requires component identifiers in both CPE and PURL formats because precise matching is essential to relate an SBOM to vulnerability data. Better package-to-CVE mapping remains necessary if the open source vulnerability intelligence market is to reduce analyst effort and retain customer confidence.
Shortage of Vulnerability-Research and Triage Specialists
A shortage of trained researchers and triage analysts limits the quality and practical use of enriched vulnerability data. Automated tools cannot fully replace the technical judgment required to validate exploit evidence and establish accurate component mappings. The same shortage affects customer teams tasked with converting advisory data into prioritized remediation work. Government and regulated organizations face additional hiring limits from clearance requirements and compensation constraints. Managed security service providers can supply some of this capacity, but they face the same limited talent pool. Vendors that reduce manual work through automated scoring, concise analysis, and prevalidated reachability assessments can offer a clearer operational benefit in the open source vulnerability intelligence market.
*Our forecasts treat driver/restraint impacts as directional, not additive. The impact forecasts reflect baseline growth, mix effects, and variable interactions.
Segment Analysis
By Component: Software Leads as Services Build Momentum
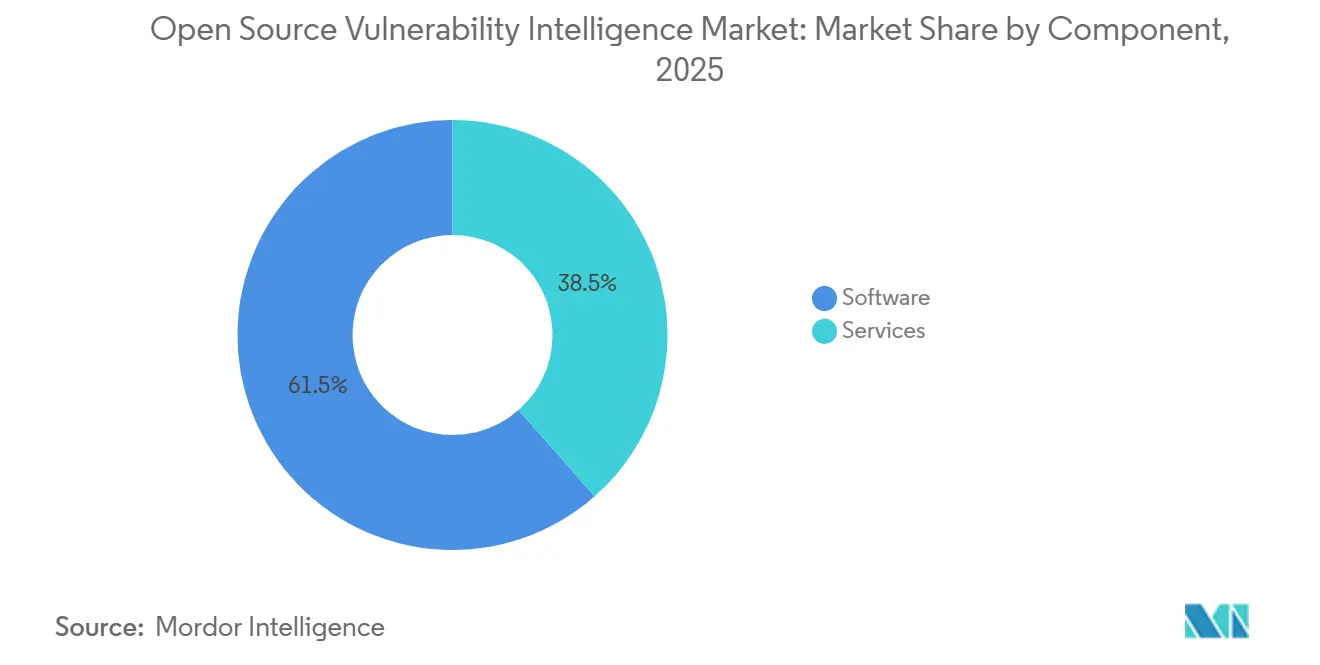
Software held 61.49% of the open source vulnerability intelligence market in 2025. Enterprises favor API-delivered intelligence that can be updated continuously and integrated with developer tools and continuous integration and continuous delivery platforms. Subscription delivery allows providers to add schema support, feed enrichments, and ecosystem coverage without a customer-side redeployment. This delivery model is useful as OSV coverage expands and SBOM requirements change. Embedded advisory feeds create switching costs because service-level agreements, dashboards, escalation rules, and triage processes become aligned with the provider's taxonomy. Software retains a strong position where customers need recurring machine-readable intelligence that can be consumed by several internal security and engineering systems. The segment benefits when security and development teams work from the same information and assign fixes through the same workflow. These conditions support continued use of software platforms across large and complex software estates, where manually consolidating intelligence from multiple sources would slow remediation.
Services are projected to expand at a 24.96% CAGR through 2031. The need to normalize advisory data across multi-cloud and hybrid environments creates a role for specialist support. Sonatype's findings on false negatives show why customers may seek curated intelligence alongside automated feeds. Managed services can help teams investigate uncertain package mappings, validate exploit evidence, and determine which alerts need action. Government and healthcare organizations may rely more heavily on this support because of staffing limits and security clearance requirements. The software vulnerability intelligence industry gains service demand when customers need to connect intelligence to established operational systems without interrupting existing development practices. Service providers can support implementation, ongoing triage, feed-quality review, and the adjustment of escalation rules as regulatory requirements change. This makes services an important complement to platform subscriptions, especially for customers that need expert judgment but cannot build a large internal research team.


By Deployment Mode: Cloud Builds a Self-Reinforcing Lead
Cloud deployment accounted for 58.77% of the open source vulnerability intelligence market in 2025 and is projected to grow at a 27.16% CAGR through 2031. Cloud platforms can ingest multiple upstream sources and continuously normalize them as new advisories, package versions, and exploit indicators emerge. These sources can include NVD, OSV, GitHub Security Advisories, and vendor feeds. Frequent normalization is difficult to maintain in on-premises systems that rely on periodic synchronization and locally scheduled processing. Datadog's finding that 50% of organizations adopt library versions within 24 hours reinforces the need for rapid refresh cycles. Customers using containers and multiple cloud environments can apply cloud-delivered intelligence across a broad development footprint without creating separate update processes for each environment. This combination helps cloud maintain its lead because the delivery approach fits the pace and distributed nature of modern software releases.
On-premises deployments remain relevant in defense, critical infrastructure, and sovereign cloud settings. These users may need intelligence to remain within classified or nationally controlled networks, even when external sources are updated frequently. Privacy-preserving and offline vulnerability intelligence is an emerging area, not a declining category. Hybrid deployment also serves organizations that need cloud-speed enrichment for non-sensitive workloads. Financial services and energy companies can use hybrid models to isolate vulnerability data connected with operational technology and production controls. The open source vulnerability intelligence market can therefore support more than one deployment model, provided providers can maintain reliable policy and data consistency across environments. Product differentiation matters more than a simple replacement of on-premises systems because restricted-network buyers have specific operational and governance needs. Providers that support consistent policy across cloud and restricted environments can address this requirement while preserving the separation required by sensitive workloads.
By Organization Size: Large Enterprises Anchor Demand as SMEs Expand
Large enterprises held 67.34% of the open source vulnerability intelligence market in 2025. Their software supply chains have extensive open-source dependency portfolios, complex vendor relationships, and multiple development teams with different release cycles. Regulatory requirements make structured vulnerability data a high-priority procurement item for many of these organizations. Enterprise customers also need integrations with SIEM, SOAR, ticketing, and SBOM management systems so that intelligence can lead directly to tracked remediation activity. These integrations support higher contract values and multiyear customer relationships because they become part of the customer's regular security process. JFrog reported serving 6,600 organizations worldwide, including a majority of the Fortune 100. Large enterprises can assign dedicated security engineering teams to operationalize granular intelligence, assess exceptions, and coordinate fixes across many applications. Their established security programs make them central buyers for integrated platforms that bring several vulnerability tasks into one managed workflow.
Small and medium-sized enterprises are projected to expand at a 26.91% CAGR through 2031. Cloud-native tools reduce the need for an extensive security infrastructure before a company can use vulnerability intelligence. Smaller organizations are also recognizing the financial and reputational risks associated with open-source dependencies that may be added by development teams without centralized review. Per-repository and per-developer pricing can lower the initial contract size compared with broad site licenses. Lightweight software composition analysis tools make developer self-service more practical, particularly where no dedicated security operations team is available. This allows teams to use intelligence in development workflows without building a separate security operations function or managing multiple disconnected tools. Providers that simplify setup, explain priority, and support remediation can reach a wider set of smaller customers. SME adoption broadens the customer base beyond the large-enterprise core of the open source vulnerability intelligence market and gives suppliers a path to serve customers earlier in their security program development.
By Intelligence Function: Package Intelligence Leads as Reachability Expands
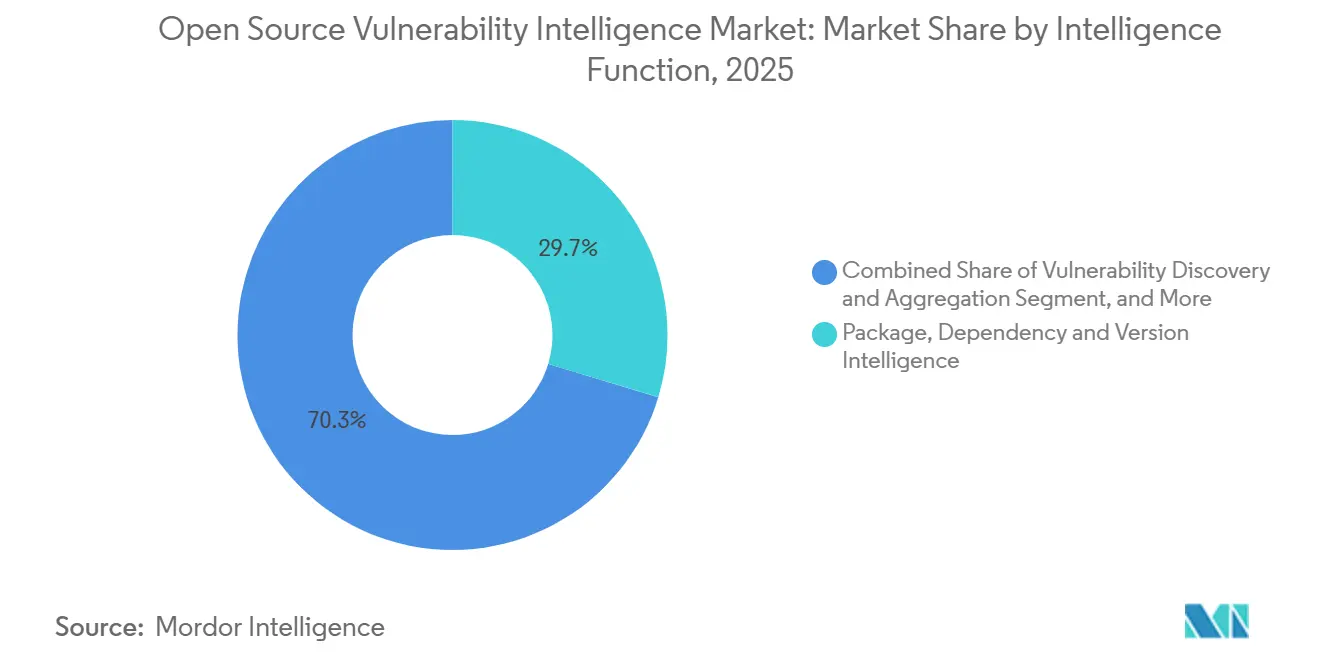
Package, dependency, and version intelligence accounted for 29.68% of the open-source vulnerability intelligence market in 2025. Development teams can use this intelligence directly, as it identifies the affected package, version, and the fixed version. It removes the need for an additional interpretation step before an upgrade decision, which is valuable when software releases move quickly. OSV maps vulnerabilities to ecosystem-specific version ranges across 30 ecosystems. This format supports automated fix suggestions and machine-readable remediation processes for use in development pipelines. CISA's 2026 SBOM guidance also recognizes PURL identifiers as an important component identifier.[4]Cybersecurity and Infrastructure Security Agency, “Binding Operational Directive 26-04, Prioritizing Security Updates Based on Risk,” Cybersecurity and Infrastructure Security Agency, cisa.gov Package-level information remains a core input for software supply chain security programs because it links an advisory to a specific software component. It is especially valuable where teams need precise upgrade guidance, clear ownership, and a record of the version that resolved the exposure.
Exposure and reachability intelligence is projected to expand at a 26.37% CAGR through 2031. Organizations increasingly understand that an affected package does not always create an exploitable path in a specific application. Runtime context helps security teams focus on vulnerable functions that are actually reachable in their deployed software and deprioritize alerts without a practical route to exploitation. Datadog found that only 18% of vulnerabilities labeled critical remained critical after this context was applied. Vulnerability discovery, aggregation, advisory enrichment, normalization, and exploitability prioritization remain supporting functions that provide the data needed for this decision. They all contribute to evidence-based remediation workflows and reduce reliance on a single severity label. Other functions include AI model vulnerability tracking and hardware-level firmware intelligence, where existing taxonomies have less consistent coverage. The software vulnerability intelligence industry is placing greater value on decisions that are specific to each deployment, its exposed services, and the actual paths available to an attacker.

By Industry Vertical: IT and Telecommunication Lead as Government Accelerates
IT and telecommunications accounted for 26.19% of the open source vulnerability intelligence market in 2025. Telecom operators manage large open-source dependency footprints and critical communications infrastructure. Their exposure has expanded to include 5G network functions and cloud-native network functions based on containerized, open-source stacks. Continuous intelligence helps these companies manage a changing software supply chain. Industrial manufacturing, banking, financial services, insurance, healthcare, and life sciences also represent significant areas of demand. Banking, financial services, and insurance benefit from mature security investment. Healthcare faces connected-device requirements and post-market cybersecurity expectations. These verticals require intelligence that can fit their existing security and compliance processes.
The government and public administration sector is projected to expand at a 27.21% CAGR through 2031. CISA BOD 26-04 requires Federal Civilian Executive Branch agencies to use risk-tiered vulnerability remediation. This creates procurement demand that is less dependent on individual agency budget cycles. Public-sector digital modernization increases the need for reliable software supply chain data. Energy and utilities, transportation and logistics, oil and gas, retail and e-commerce, media and entertainment, and education and research institutions are smaller but growing users. Media, entertainment, education, and research institutions may be particularly exposed to advisory-poisoning risks due to their extensive use of open-source content and learning platforms. The open source vulnerability intelligence market can address these verticals through both platform subscriptions and managed support. Different regulatory duties and software environments will continue to shape purchasing requirements.
Geography Analysis
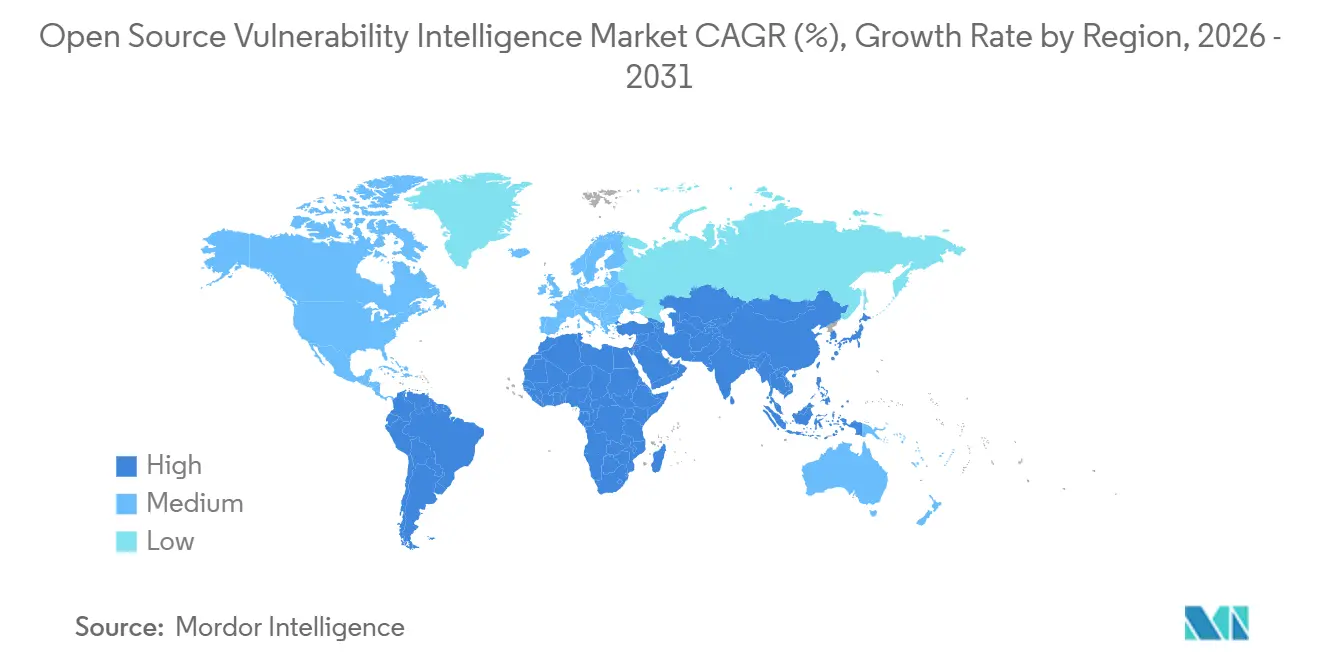
North America held 36.58% of the open source vulnerability intelligence market in 2025. The United States combines strong regulatory activity, large technology suppliers, and sophisticated enterprise buyers. CISA issued BOD 26-04 in June 2026 and released the 2026 SBOM Minimum Elements in July 2026. These actions support faster procurement of vulnerability intelligence tools by agencies and contractors. Canada and Mexico are secondary growth areas as software supply-chain security guidance and vulnerability coordination capabilities expand. The United States also has specialist providers such as VulnCheck, Anchore, and Rapid7 that can align products with evolving compliance needs.
Europe is a significant region for the open source vulnerability intelligence market because its regulatory requirements are beginning to drive procurement. The Cyber Resilience Act requires manufacturers of products with digital elements to report actively exploited vulnerabilities to ENISA within 24 hours of awareness from September 11, 2026. Germany, the United Kingdom, France, and the BENELUX countries lead adoption through industrial manufacturing and financial services. The NIS2 compliance deadline passed in October 2024 and covers incident and vulnerability reporting across 18 sectors. Italy and other European countries remain at earlier stages of adoption. They are expected to advance as national agencies issue implementation guidance and conformity assessment bodies are designated through 2027.
Asia-Pacific is projected to expand at a 24.83% CAGR through 2031. India is expected to record strong growth through its technology services sector, fintech security directives, and expanding CERT-In reporting requirements. China is building a domestic vulnerability intelligence infrastructure, including CNNVD and CNVD databases. Japan's cybersecurity management guidelines support vulnerability assessment and patch-management governance for critical infrastructure operators.[5]Ministry of Economy, Trade and Industry, “Cybersecurity Management Guidelines,” Ministry of Economy, Trade and Industry, meti.go.jp South Korea and Australia also contribute to regional demand, while Australia's 2024 Cyber Security Act supports smart-device vulnerability disclosure. South America, the Middle East, and Africa are earlier-stage regions, with Brazil, the UAE, and Saudi Arabia supported by evolving privacy, cybersecurity, and digital infrastructure requirements.

Competitive Landscape
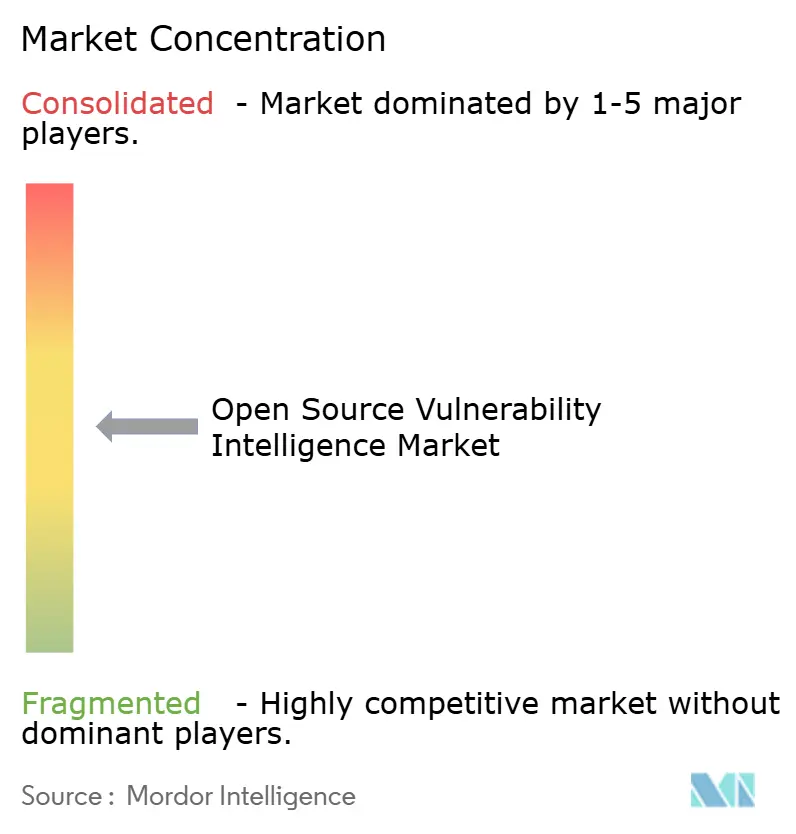
The open source vulnerability intelligence market has a moderately concentrated platform tier and a fragmented group of specialists. Snyk, JFrog, Sonatype, Tenable, Qualys, Rapid7, and Palo Alto Networks offer integrated workflows that connect vulnerability intelligence to broader software supply chain security or exposure management. JFrog identified Aqua Security, Snyk, Sonatype, and Black Duck as competitors in its holistic security offerings for the fiscal year ended December 31, 2025.[6]JFrog, “Annual Report on Form 10-K for the Fiscal Year Ended December 31, 2025,” U.S. Securities and Exchange Commission, sec.gov This reflects the convergence of artifact management, software composition analysis, and vulnerability intelligence. Snyk acquired Invariant Labs in June 2025 as part of its capability expansion in AI security. Acquisition and integration activities help large platforms add capabilities faster than internal product development alone. Customer demand is moving toward tools that connect findings to remediation.
Competitive openings exist in exploit intelligence for C/C++ and embedded firmware, privacy-preserving offline intelligence, and AI-supported triage. Greenbone and Anchore serve distinct needs in network scanning and SBOM-centered supply-chain security. Smaller providers such as ProjectDiscovery and VulnCheck are gaining attention from technical buyers through open-source tools and exploit-evidence data. Their position rests on precision and on the ability to validate the accuracy of commercial feeds. CrowdStrike and Elastic add threat-intelligence context through endpoint telemetry and related security data. This capability can appeal to customers buying integrated SIEM or XDR solutions. Vendors that improve package mapping and reachability can compete even without the broadest product portfolio.
JFrog launched Zero-Touch Remediation in September 2026 to apply partner-supplied patches through customer pipelines. Snyk integrated Anthropic's Claude into its AI Security Platform in May 2026 for automated discovery, prioritization, and developer-ready fix generation. Sonatype's 2026 research on false positives and false negatives highlights why data quality is a major competitive requirement. Providers that combine accurate data, practical workflow integration, and timely remediation can strengthen their position with enterprise buyers.
Open Source Vulnerability Intelligence Industry Leaders
GitHub, Inc.
Snyk Limited
Sonatype, Inc.
Synopsys, Inc.
VulnCheck, Inc.
- *Disclaimer: Major Players sorted in no particular order

Recent Industry Developments
- July 2026: CISA, together with NSA, FBI, DOE, NIST, and 15 international cybersecurity agencies, released the 2026 Minimum Elements for a Software Bill of Materials. The baseline expanded from 14 to 23 elements, with 10 new elements covering PURL-based identification, generation context, component hash attestation, and SBOM versioning.
- May 2026: Snyk announced the integration of Anthropic's Claude into the Snyk AI Security Platform. The capability supports automated vulnerability discovery, prioritization, and developer-ready fix generation across code, open-source dependencies, containers, and AI-generated artifacts.
- February 2026: Datadog published its State of DevSecOps 2026 report. The report found that the median software dependency was 278 days out of date, 63 days further behind than the prior year. It also found that only 4% of organizations pinned all public GitHub Actions to commit hashes, leaving continuous integration and continuous delivery pipelines exposed to unvetted code changes.
- September 2025: CISA and U.S. and international partner agencies published the joint guidance, “A Shared Vision of Software Bill of Materials for Cybersecurity.” The guidance established a government-to-government agreement on using SBOMs within national cybersecurity risk management and coordinated vulnerability disclosure frameworks.


Global Open Source Vulnerability Intelligence Market Report Scope
The open source vulnerability intelligence market comprises specialized platforms and services that aggregate, analyze, and contextualize vulnerability data from open source software repositories, security advisories, and threat intelligence sources to provide actionable insights into emerging security risks affecting open source components. These solutions deliver real-time vulnerability alerts, exploitability assessments, patch availability tracking, affected version identification, and remediation guidance for open-source libraries and dependencies, enabling security teams to prioritize vulnerability remediation based on actual exploit activity and business impact, stay ahead of newly disclosed vulnerabilities through proactive monitoring, and make informed decisions about open-source component adoption and maintenance across their software portfolios.
The Open Source Vulnerability Intelligence Market Report is Segmented by Component (Software, and Services), Deployment Mode (Cloud, On-Premises, and Hybrid), Organization Size (Large Enterprises, and Small and Medium-Sized Enterprises), Intelligence Function (Vulnerability Discovery and Aggregation, Advisory Enrichment and Normalization, Exploitability Intelligence and Prioritization, Package, Dependency and Version Intelligence, Exposure and Reachability Intelligence, and Other Intelligence Functions), Industry Vertical (Government and Public Administration, Industrial Manufacturing, Retail and E-Commerce, Transportation and Logistics, Energy and Utilities, Oil and Gas, IT and Telecommunication, Media and Entertainment, Education and Research Institutions, Healthcare and Life Sciences, Banking, Financial Services, and Insurance (BFSI), and Other Industry Verticals), and Geography (North America, South America, Europe, Asia-Pacific, and Middle East and Africa). The Market Forecasts are Provided in Terms of Value (USD).
| Software |
| Services |
| Cloud |
| On-Premises |
| Hybrid |
| Large Enterprises |
| Small and Medium-Sized Enterprises |
| Vulnerability Discovery and Aggregation |
| Advisory Enrichment and Normalization |
| Exploitability Intelligence and Prioritization |
| Package, Dependency and Version Intelligence |
| Exposure and Reachability Intelligence |
| Other Intelligence Functions |
| Government and Public Administration |
| Industrial Manufacturing |
| Retail and E-Commerce |
| Transportation and Logistics |
| IT and Telecommunication |
| Healthcare and Life Sciences |
| Banking, Financial Services, and Insurance (BFSI) |
| Other Industry Verticals |
| North America | United States | |
| Canada | ||
| Mexico | ||
| South America | Brazil | |
| Argentina | ||
| Rest of South America | ||
| Europe | Germany | |
| United Kingdom | ||
| France | ||
| Italy | ||
| BENELUX | ||
| Rest of Europe | ||
| Asia-Pacific | China | |
| Japan | ||
| India | ||
| South Korea | ||
| Australia | ||
| Rest of Asia-Pacific | ||
| Middle East and Africa | Middle East | United Arab Emirates |
| Saudi Arabia | ||
| Rest of Middle East | ||
| Africa | South Africa | |
| Nigeria | ||
| Egypt | ||
| Rest of Africa | ||
| By Component | Software | ||
| Services | |||
| By Deployment Mode | Cloud | ||
| On-Premises | |||
| Hybrid | |||
| By Organization Size | Large Enterprises | ||
| Small and Medium-Sized Enterprises | |||
| By Intelligence Function | Vulnerability Discovery and Aggregation | ||
| Advisory Enrichment and Normalization | |||
| Exploitability Intelligence and Prioritization | |||
| Package, Dependency and Version Intelligence | |||
| Exposure and Reachability Intelligence | |||
| Other Intelligence Functions | |||
| By Industry Vertical | Government and Public Administration | ||
| Industrial Manufacturing | |||
| Retail and E-Commerce | |||
| Transportation and Logistics | |||
| IT and Telecommunication | |||
| Healthcare and Life Sciences | |||
| Banking, Financial Services, and Insurance (BFSI) | |||
| Other Industry Verticals | |||
| By Geography | North America | United States | |
| Canada | |||
| Mexico | |||
| South America | Brazil | ||
| Argentina | |||
| Rest of South America | |||
| Europe | Germany | ||
| United Kingdom | |||
| France | |||
| Italy | |||
| BENELUX | |||
| Rest of Europe | |||
| Asia-Pacific | China | ||
| Japan | |||
| India | |||
| South Korea | |||
| Australia | |||
| Rest of Asia-Pacific | |||
| Middle East and Africa | Middle East | United Arab Emirates | |
| Saudi Arabia | |||
| Rest of Middle East | |||
| Africa | South Africa | ||
| Nigeria | |||
| Egypt | |||
| Rest of Africa | |||


Key Questions Answered in the Report
What is the software vulnerability intelligence market size?
The open source vulnerability intelligence market size was valued at USD 1.02 billion in 2025 and estimated to grow from USD 1.23 billion in 2026 to reach USD 3.59 billion by 2031, at a CAGR of 23.89% during the forecast period (2026-2031).
What is driving demand for vulnerability intelligence platforms?
Supply-chain reporting requirements, faster software releases, open-source dependencies, and exploitability-led remediation are increasing demand.
Which deployment model leads adoption?
Cloud led with 58.77% in 2025 and is projected to expand at a 27.16% CAGR through 2031.
Which organizations are adopting these tools fastest?
Small and medium-sized enterprises are projected to expand at a 26.91% CAGR through 2031 as cloud-native tools lower implementation barriers.
Which intelligence function is growing fastest?
Exposure and reachability intelligence is projected to expand at a 26.37% CAGR through 2031 because it helps teams identify actionable attack paths.
Which region is growing fastest?
Asia-Pacific is projected to expand at a 24.83% CAGR through 2031, supported by digital transformation and developing cybersecurity requirements.
Page last updated on:


 Your data is secure and never sold or shared.


