
Open Source Risk Management Market Size and Share
Market Overview
| Study Period | 2020 - 2031 |
|---|---|
| Market Size (2026) | USD 2.93 Billion |
| Market Size (2031) | USD 7.83 Billion |
| Growth Rate (2026 - 2031) | 21.72 % |
| Fastest Growing Market | Asia-Pacific |
| Largest Market | North America |
| Market Concentration | Medium |
Major Players *Disclaimer: Major Players sorted in no particular order Image © Mordor Intelligence. Reuse requires attribution under CC BY 4.0. | |
Open Source Risk Management Market Analysis by Mordor Intelligence
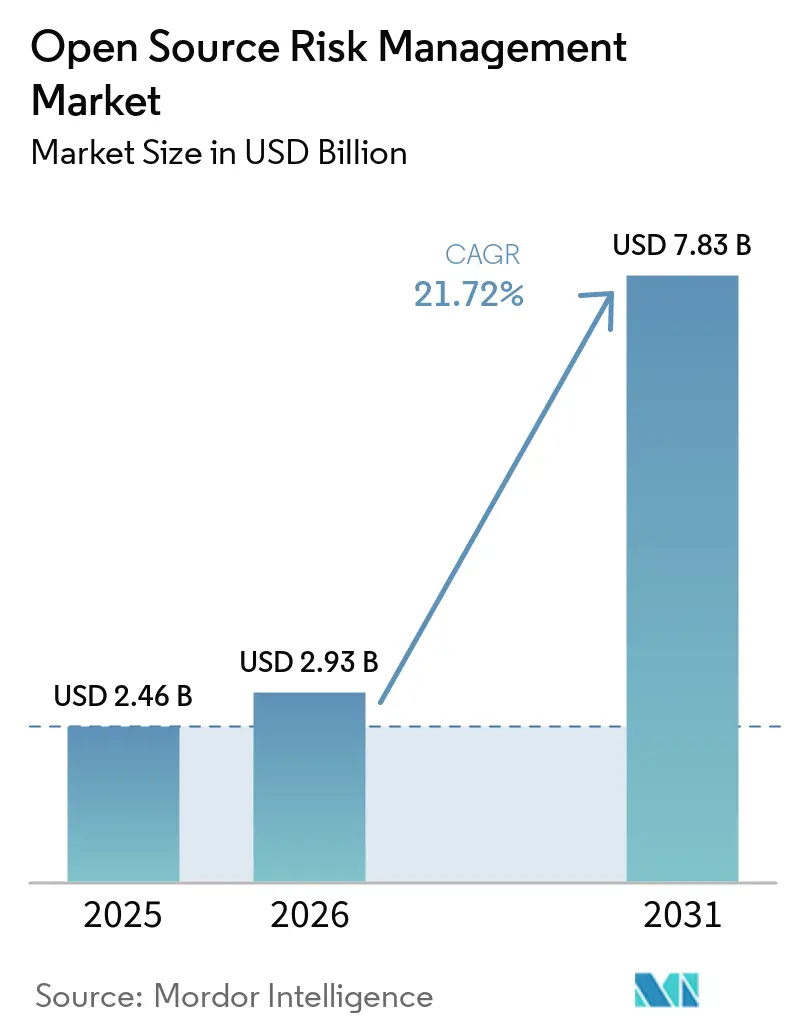
The open source risk management market size was valued at USD 2.46 billion in 2025 and is estimated to grow from USD 2.93 billion in 2026 to reach USD 7.83 billion by 2031, at a CAGR of 21.72% during the forecast period (2026-2031). The open source risk management market is expanding as companies place more third-party code into software products and need continuous visibility over vulnerabilities, licenses, and component origins. Regulatory deadlines are moving software bills of materials, or SBOMs, from a preferred practice to a purchasing requirement for suppliers and public buyers. Supply chain attacks and unsafe packages are also making component discovery and remediation more important across development teams. Vendors are responding by combining software composition analysis, SBOM management, vulnerability exploitability information, and package controls in broader platforms. The open source risk management market also has an opportunity to serve companies that use AI-assisted coding and lack clear records of the code and packages entering production systems.
Key Report Takeaways
- By component, software held 61.47% of the open source risk management market share in 2025, while services is projected to expand at a CAGR of 23.43% through 2031.
- By solution capability, software composition analysis held 27.64% revenue share in 2025, while SBOM and VEX management is expected to expand at a CAGR of 28.32% through 2031.
- By deployment mode, cloud held a 58.79% revenue share in open source risk management market in 2025 and is projected to expand at a CAGR of 26.11% through 2031.
- By organization size, large enterprises held 68.27% revenue share in 2025, while SMEs are projected to expand at a CAGR of 26.91% through 2031.
- By industry vertical, IT and telecommunication held 24.71% revenue share in 2025, while government and public administration is expected to expand at a CAGR of 27.33% through 2031.
- By geography, North America held 39.24% revenue share in the open source risk management market in 2025, while Asia-Pacific is projected to expand at a CAGR of 28.71% through 2031.
Note: Market size and forecast figures in this report are generated using Mordor Intelligence’s proprietary estimation framework, updated with the latest available data and insights as of January 2026.
Global Open Source Risk Management Market Trends and Insights
Drivers Impact Analysis*
| DRIVER | (~) % IMPACT ON CAGR FORECAST | GEOGRAPHIC RELEVANCE | IMPACT TIMELINE |
|---|---|---|---|
| Regulatory Pressure for SBOM and Software Supply-Chain Transparency | +5.8% | Global, with concentrated near-term impact in North America and Europe, with spillover to Asia-Pacific | Short term (≤ 2 years) |
| Rising Open-Source Dependency Density in Modern Applications | +4.9% | Global | Short term (≤ 2 years) |
| Shift Toward Reachability-Based Vulnerability Prioritization | +4.2% | Global, led by North America and Western Europe | Medium term (2-4 years) |
| AI-Generated Code Expanding Untracked Open-Source Exposure | +3.6% | Global | Short term (≤ 2 years) |
| Provenance-Level Detection of Malicious and Tampered Packages | +2.8% | Global core, with spillover to the Middle East and Africa | Medium term (2-4 years) |
| Open-Source Stewardship and Maintainer Accountability Requirements | +1.9% | North America and Europe, with long-term spread to Asia-Pacific | Long term (≥ 4 years) |
| Source: Mordor Intelligence | |||
Regulatory Pressure for SBOM and Software Supply-Chain Transparency
The open source risk management market is benefiting as compliance requirements turn open source governance into a contractual obligation for many suppliers. The EU Cyber Resilience Act entered into force in December 2024, and its market surveillance authorities became operational in June 2026. Mandatory vulnerability reporting, including initial notification to ENISA within 24 hours after identifying an actively exploited vulnerability, takes effect on September 11, 2026, while full SBOM documentation obligations follow in December 2027. The regulation allows fines of up to EUR 15 million (USD 16.2 million) or 2.5% of global annual turnover for noncompliance. CISA's 2025 draft guidance also calls for transitive dependency information in SBOMs, which raises the standard beyond manifest-only scanning.[1]Cybersecurity and Infrastructure Security Agency, “Minimum Elements for a Software Bill of Materials,” Cybersecurity and Infrastructure Security Agency, cisa.gov Japan and 14 other countries also aligned on operational guidance in September 2025, while Japan's Supply Chain Security Evaluation System is scheduled for a fiscal year 2026 launch at the 3-star to 4-star tier.
Rising Open-Source Dependency Density in Modern Applications
The open source risk management market is supported by the growing number of external components within each application. The average application contained 1,180 open source components in 2026, which was 30% higher than in the prior reporting period. The same analysis found that 64% of components were transitive dependencies, which many manifest-only tools do not detect. It also found that 16% of components needed binary analysis or snippet matching instead of manifest parsing. In 2025, 87% of audited codebases had at least 1 open source vulnerability, the mean was 581 vulnerabilities per codebase, and 92% had components that were at least 4 years out of date.[2]Black Duck, “2026 Open Source Security and Risk Analysis Report,” Black Duck, blackduck.com These conditions favor automated discovery, monitoring, and remediation tools that can work across a large and changing dependency base.
Shift Toward Reachability-Based Vulnerability Prioritization
The open source risk management market is moving beyond systems that treat every listed vulnerability as equally urgent. Raw vulnerability data can create a noise ratio of 20:1 to 40:1 when matched with an enterprise SBOM, meaning most alerts may not be exploitable in a specific runtime environment. Reachability analysis uses call-graph information to identify whether vulnerable functions are actually used in production code paths. VEX statements provide a supplier's assessment of exploitability for a CVE and component, helping teams decide which findings require action. The OpenSSF reported in January 2026 that VEX standards were mature, but that common distribution and lookup systems remained unavailable. This gap supports demand for platforms that automate reachability analysis and update VEX information as applications change.
AI-Generated Code Expanding Untracked Open-Source Exposure
The open source risk management market is gaining another demand channel as AI coding tools add code and packages to production software. Only 24% of organizations comprehensively evaluated AI-generated code for intellectual property, license, security, and quality concerns in the 2026 analysis. Veracode's 2025 research found known security flaws in 45% of AI coding tasks. Georgia Tech's Vibe Security Radar project attributed 35 CVEs to AI coding tools in March 2026, compared with 6 in January and 15 in February. AI tools can also suggest nonexistent package names that attackers register as malicious packages, creating a package substitution risk. Platforms that identify code origins, govern package use, and prioritize exploitable risks are positioned to address this exposure.
Restraints Impact Analysis*
| RESTRAINT | (~) % IMPACT ON CAGR FORECAST | GEOGRAPHIC RELEVANCE | IMPACT TIMELINE |
|---|---|---|---|
| Shortage of Open-Source Security and License-Compliance Talent | -0.9% | Global, most acute in North America and Western Europe | Medium term (2-4 years) |
| Alert Noise and Incomplete Vulnerability Reachability Context | -0.7% | Global | Short term (≤ 2 years) |
| Maintainer Liability Anxiety and Reduced Volunteer Contribution | -0.5% | North America and Europe, with spillover to Asia-Pacific | Long term (≥ 4 years) |
| Fragmented Package Identity and Provenance Across Ecosystems | -0.4% | Global | Medium term (2-4 years) |
| Source: Mordor Intelligence | |||
Shortage of Open-Source Security and License-Compliance Talent
The open source risk management market can face slower adoption when customers lack staff who can configure and operate governance programs. The 2026 SANS and GIAC workforce study found that 60% of organizations identified skills gaps as their main workforce challenge, compared with 40% that cited headcount shortages.[3]SANS Institute and GIAC, “2026 Cybersecurity Workforce Research Report,” SANS Institute, sans.org Application security hiring data showed that 49.6% of open roles required senior experience or above, while only 1.9% were available to entry-level candidates. The Linux Foundation found that 57% of organizations had capability gaps in AI security and risk management in 2026. The shortage can limit platform utilization after purchase, even where security budgets are available. It also raises the value of automated and low-configuration tools that reduce dependence on specialist judgment.
Alert Noise and Incomplete Vulnerability Reachability Context
The open source risk management market is constrained when security teams receive more findings than they can assess. Large product portfolios can produce thousands of open findings after an SBOM is matched with raw vulnerability data. More than 90% of flagged CVEs may not be exploitable in a product's specific runtime context, yet many tools still assign them similar urgency. This weakens confidence in remediation queues and can cause engineering teams to defer action. The openSSF has stated that vendor assertions of non-exploitability do not consistently flow into enterprise workflows because there is no common VEX lookup system. Better prioritization and information exchange are therefore needed to maintain customer engagement and effective risk reduction.
*Our forecasts treat driver/restraint impacts as directional, not additive. The impact forecasts reflect baseline growth, mix effects, and variable interactions.
Segment Analysis
By Component: Software Leads Revenue While Services Address Implementation Complexity
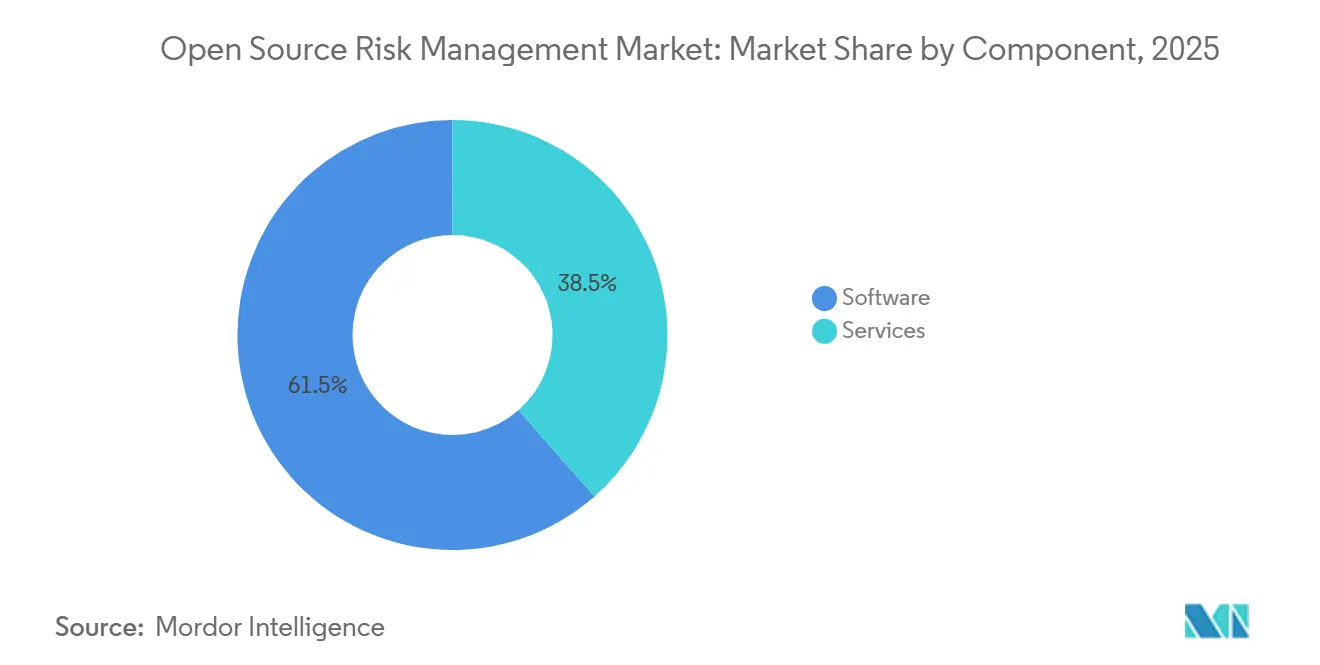
Software accounted for 61.47% of the open source risk management market share in 2025. Enterprises favored SaaS platform licenses that fit directly into DevSecOps toolchains and consolidate software composition analysis, SBOM generation, and license compliance. Cloud delivery has also made the tools more accessible for mid-sized organizations. The open source risk management market size for services is expected to expand at a CAGR of 23.43% from 2026 to 2031. Services respond to work that internal teams often cannot complete alone, including reachability pipeline configuration, VEX workflows, and the mapping of governance controls to compliance requirements.
Implementation and managed services can deepen product use after an initial license sale. They can also reduce churn by helping customers incorporate new controls into software development processes before renewal decisions. Sonatype launched Nexus One in November 2025 as an agentic software supply chain infrastructure platform for open source intelligence, governance, and dependency automation.[4]Sonatype, “Q2 2026 Open Source Malware Index: Attackers Abuse Developer Trust,” Sonatype, sonatype.com Black Duck uses manifest analysis, binary scanning, and snippet matching to identify a wider range of components, including those missed by standard manifests. GitHub added open source license compliance in public preview for GitHub Enterprise Cloud customers in June 2026, increasing the level of native compliance automation expected by buyers.


By Solution Capability: Software Composition Analysis Leads While SBOM and VEX Management Accelerate
Software composition analysis held 27.64% of the open source risk management market share in 2025. It is commonly the first capability used to discover open-source components within commercial codebases. Black Duck reported that 98% of commercial codebases contained open source in its 2026 analysis. SBOM and VEX management is projected to grow at a CAGR of 28.32% through 2031. Regulatory requirements and the operational limits of unprioritized SBOM findings are supporting this faster expansion.
License compliance and policy governance address intellectual property and usage obligations across component portfolios. Vulnerability intelligence and remediation help teams identify and fix weaknesses in their dependencies. Supply-chain attacks and malicious package detection have become more urgent as Sonatype reported 1.8 million cumulative blocked malicious packages by the second quarter of 2026. Open-source program offices and managed services remain higher-value capabilities for large companies that need structured controls under frameworks such as the NIST Secure Software Development Framework and the OpenSSF Security Baseline. These requirements encourage buyers to choose platforms that collect evidence across several governance activities.
By Deployment Mode: Cloud Holds the Largest Position and the Fastest Growth Rate
Cloud held 58.79% of the open source risk management market share in 2025 and is projected to grow at a CAGR of 26.11% through 2031. SaaS delivery provides continuously updated threat intelligence and avoids a separate infrastructure deployment for many customers. Cloud products also connect with common CI/CD tools, including GitHub, GitLab, Bitbucket, and Jenkins. This compatibility lets teams add scanning and SBOM controls within existing development workflows. The open source risk management market continues to favor cloud tools as smaller businesses adopt formal dependency governance and larger companies coordinate controls across multiple cloud environments.
Lifecycle obligations also support cloud adoption because SBOM information must be maintained as code and components change. Endor Labs integrated its Package Firewall and Cursor in 2026, showing how cloud-based controls can be placed within AI coding workflows. On-premises and hybrid deployments remain relevant for regulated businesses and defense-related organizations with data residency, air-gap, or classification requirements, and Anchore has a position in air-gapped and classified environments. Hybrid users can scan development environments through cloud services while retaining intelligence repositories for sensitive code on site. This approach serves multinational companies that face data localization requirements across operating regions.
By Organization Size: Large Enterprises Generate Most Revenue While SMEs Expand Faster
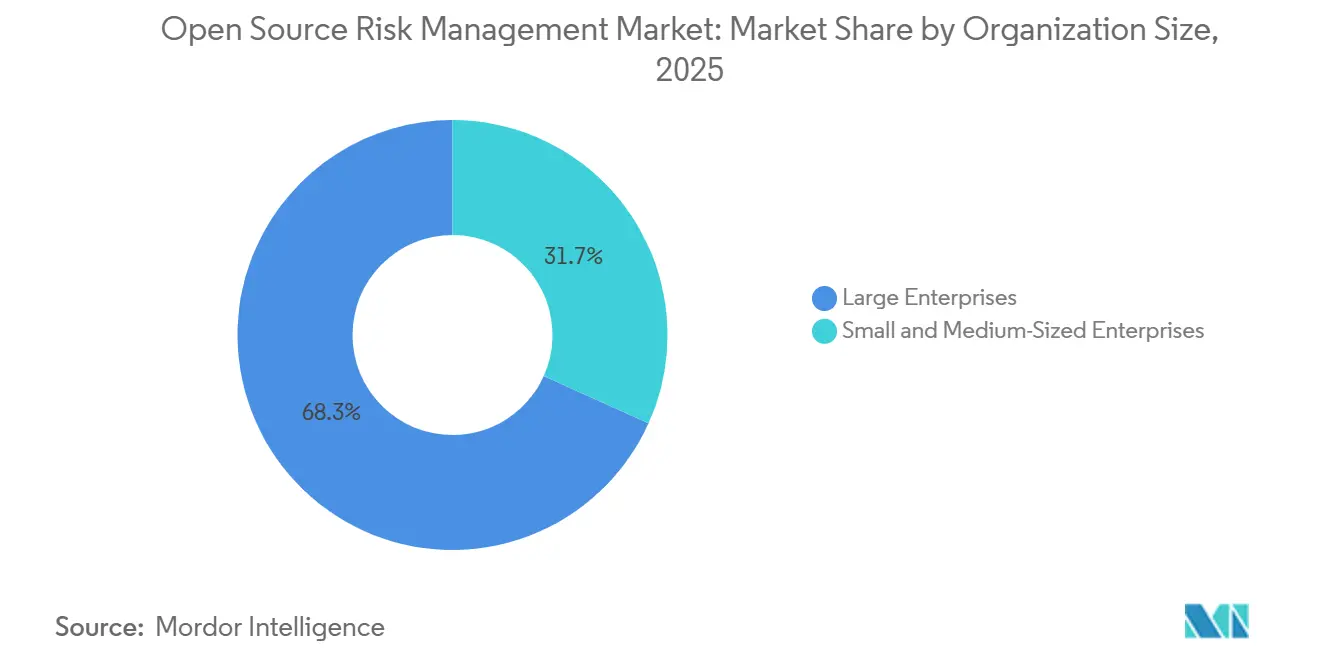
Large enterprises accounted for 68.27% of the open source risk management market share in 2025. Their scale, regulatory exposure, and software development activity make comprehensive governance programs easier to justify. Acquisition activity creates a further demand case because buyers use license conflict analysis and SBOM-based due diligence in software reviews. In 2025, 68% of commercial codebases contained license conflicts, and some portfolios carried more than 2,675 conflict instances. Large enterprises also require more advisory support because their programs cover multiple ecosystems, development teams, and business units.
SMEs are projected to grow at a CAGR of 26.91% from 2026 to 2031. Their adoption is often driven by customer qualification requirements rather than by internal compliance maturity. Suppliers to large companies and public agencies increasingly need to provide SBOM evidence, answer security questionnaires, and show license governance controls. Tiered software composition analysis offerings can lower the initial cost for smaller buyers. The EU Cyber Resilience Act gives European SMEs until December 2027 to meet full SBOM documentation obligations, concentrating procurement decisions across Germany, France, the United Kingdom, and the Benelux countries.
By Industry Vertical: IT and Telecommunication Leads While Government and Public Administration Grows Faster
IT and telecommunication held 24.71% of the open source risk management market share in 2025. The sector has high open source use, software-intensive revenue models, and early investment in DevSecOps infrastructure. Telecom operators with cloud-native 5G functions manage software stacks that include many networking libraries and transitive dependencies. This creates a broad software supply chain exposure that is difficult to track with manual processes. Government and public administration is projected to expand at a CAGR of 27.33% through 2031, supported by procurement obligations and public-sector cyber requirements.
Federal agencies in the United States use CISA SBOM guidance and software security obligations that affect their supplier base. In Europe, NIS2 and the Digital Operational Resilience Act extend related requirements to public entities and financial market infrastructure. BFSI organizations address information and communication technology risk requirements that overlap with dependency documentation and governance. Healthcare and life sciences organizations respond to U.S. Food and Drug Administration cybersecurity guidance that identifies SBOMs as part of premarket submissions for relevant medical devices.[5]U.S. Food and Drug Administration, “Cybersecurity,” U.S. Food and Drug Administration, fda.gov Industrial manufacturers are also adopting SBOM practices in automotive and aerospace supply chains, while other verticals increase adoption after incidents or customer requests.
Geography Analysis
North America accounted for 39.24% of the open source risk management market share in 2025. U.S. federal procurement requirements, a large base of software-intensive companies, and a well-funded vendor ecosystem support the region's leading position. Executive Order 14028 established SBOM-related expectations for federal software suppliers, while CISA's draft minimum elements added transitive dependency data and automation-ready formats. Canada also aligns with U.S. practices through joint cybersecurity advisories. Cloud delivery has helped mid-sized software companies include managed software composition analysis services within their wider DevSecOps spending.
Europe remains important because the Cyber Resilience Act provides a defined compliance schedule for companies in Germany, France, the United Kingdom, Italy, and the Benelux countries. Market surveillance authority enforcement became operational in June 2026, and mandatory vulnerability reporting takes effect in September 2026.[6]European Commission, “Cyber Resilience Act,” European Commission, digital-strategy.ec.europa.eu Full SBOM documentation obligations follow in December 2027. The OpenSSF's 2026 readiness survey of 843 respondents found limited awareness and readiness as the deadline approached, which supports demand for support and automation.
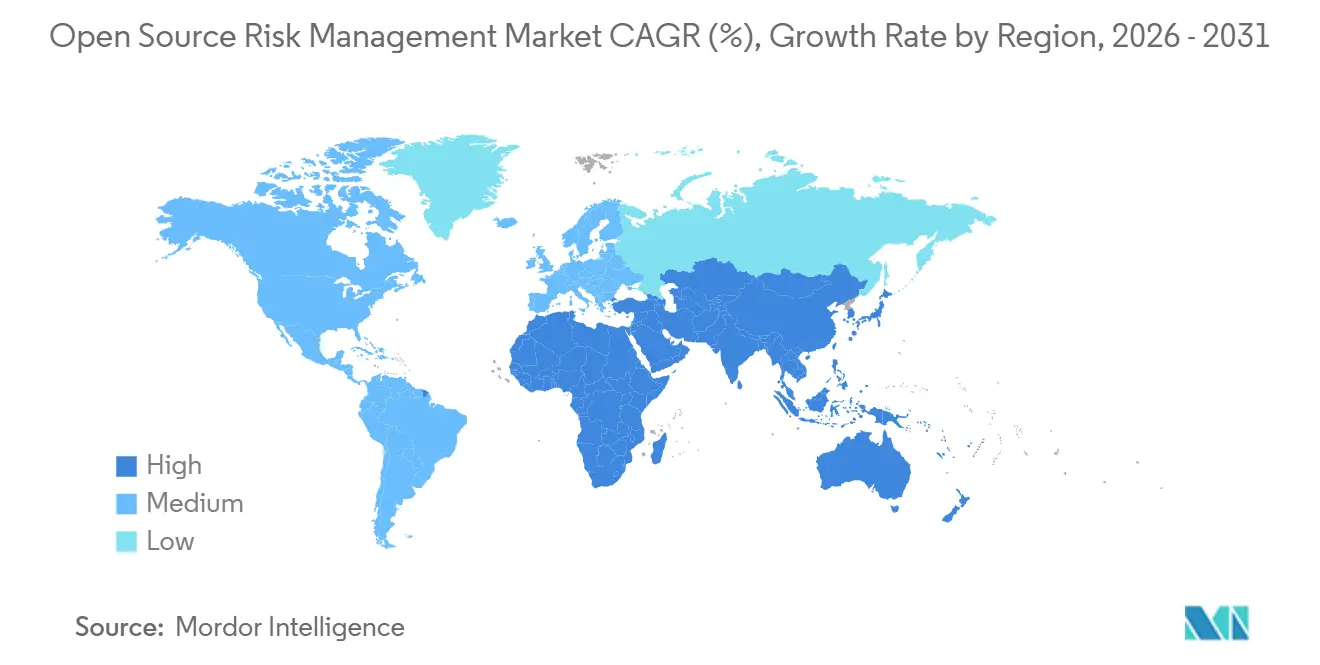
Asia-Pacific is expected to expand at a CAGR of 28.71% from 2026 to 2031, the fastest regional rate in the open source risk management market. Japan revised its SBOM guidance in August 2024 and later joined 14 other countries in operational guidance on minimum elements, automation, and transitive dependency coverage. Japan's Supply Chain Security Evaluation System is scheduled for a fiscal year 2026 launch at the 3-star to 4-star tier. China, India, South Korea, and Australia have distinct demand drivers, including export-related compliance requirements and supplier qualification requests. South America and the Middle East and Africa remain earlier-stage areas, where multinational companies often extend governance standards from North America and Europe into regional development centers.

Competitive Landscape
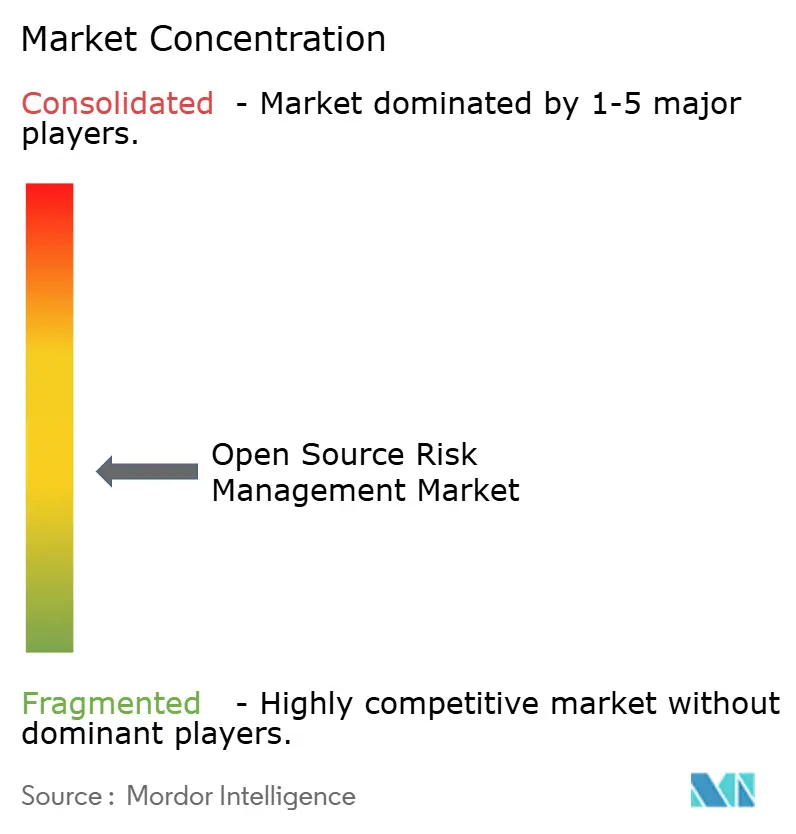
The open source risk management market is moderately fragmented, with established application security providers serving large enterprises and specialized vendors pursuing reachability analysis, AI-code governance, and SBOM automation. Black Duck remains a major provider for license compliance in regulated sectors and software transaction due diligence. Its knowledge base indexes more than 10 million open source projects, and its proprietary security advisories lead the National Vulnerability Database by an average of 100 days. Snyk uses a developer-focused free tier to create an enterprise upsell path. Sonatype, Mend.io, FOSSA, JFrog, Veracode, Checkmarx, GitLab, GitHub, Aqua Security, and Anchore compete across overlapping product categories.
The open source risk management market is shifting toward consolidated platforms that combine SBOM generation, VEX management, reachability analysis, and AI-code controls. JFrog introduced Zero-Touch Remediation in September 2026, matching patches to affected artifacts and attesting fixes through JFrog AppTrust without breaking builds. Mend.io added runtime AI security extensions in July 2026, including runtime triage of SAST findings and detection of malicious packages in container images. GitHub's June 2026 license compliance preview further embeds compliance controls in a development platform.
Endor Labs integrated its AURI intelligence layer with AI coding tools through its 2026 Cursor partnership and introduced Zero-Day Patches through Project Akrites. Provenance attestations under SLSA, Sigstore signing, and verifiable build provenance are emerging as technical differentiators for vendors that need to provide compliance evidence beyond vulnerability counts. Emerging companies such as OX Security, Apiiro, Lineaje, SCANOSS, Myrror Security, and Legit Security focus on application security posture management and supply chain lineage tracing. The open source risk management market has a broad vendor base, and the absence of a disclosed dominant combined share supports a moderately fragmented competitive structure.
Open Source Risk Management Industry Leaders
Black Duck
Mend.io
Snyk Limited
Synopsys, Inc.
Sonatype, Inc.
- *Disclaimer: Major Players sorted in no particular order

Recent Industry Developments
- July 2026: Mend.io announced runtime AI security extensions to its Mend AI and Mend AppSec platforms, adding runtime triage to distinguish true vulnerabilities from false positives in SAST findings, expanding container risk coverage to detect malicious packages within container images, and introducing project classification to improve SAST prioritization for sensitive workloads.
- June 2026: GitHub launched open source license compliance in public preview for all GitHub Enterprise Cloud customers with GitHub Advanced Security code security licenses, enabling enterprise-wide license policies enforced directly on pull requests, reducing dependency on third-party SCA tools for license governance in GitHub-native DevSecOps workflows.
- June 2026: Endor Labs launched Zero-Day Patches and joined Project Akrites, a Linux Foundation initiative for coordinated remediation and disclosure of vulnerabilities in critical open source projects, with founding members including Anthropic, OpenAI, Amazon, Microsoft, JPMorgan Chase, and Citi. The program delivers verified patches for novel vulnerabilities in under 24 hours before an upstream patch or CVE is available, funded by an agentic AI platform that builds call graphs and analyzes dataflow to construct safe fixes.
- November 2025: Sonatype launched Nexus One, an agentic software supply chain infrastructure platform unifying open source intelligence, governance, and dependency automation across enterprise DevSecOps pipelines, positioning it as the system of record for software artifacts across Sonatype's installed base of 2,000 global enterprise organizations.


Global Open Source Risk Management Market Report Scope
The open source risk management market comprises solutions that identify, assess, and mitigate security, compliance, and operational risks associated with the use of open source software components and dependencies throughout the software development lifecycle. These platforms provide capabilities such as automated software composition analysis (SCA), vulnerability detection in open source libraries, license compliance monitoring, maintainer health assessment, dependency update automation, and policy enforcement to prevent the introduction of vulnerable or non-compliant open source components into applications, enabling organizations to maintain secure software supply chains, avoid legal liabilities from license violations, reduce exposure to known vulnerabilities, and ensure that open source usage aligns with enterprise risk tolerance and regulatory requirements.
The Open Source Risk Management Market Report is Segmented by Component (Software, and Services), Solution Capability (Software Composition Analysis, SBOM and VEX Management, License Compliance and Policy Governance, Vulnerability Intelligence and Remediation, Supply-Chain Attack and Malicious-Package Detection, and Open-Source Program Office and Managed Services), Deployment Mode (Cloud, On-Premises, and Hybrid), Organization Size (Large Enterprises, and Small and Medium-Sized Enterprises), Industry Vertical (Government and Public Administration, Industrial Manufacturing, Retail and E-Commerce, Transportation and Logistics, Energy and Utilities, Oil and Gas, IT and Telecommunication, Media and Entertainment, Education and Research Institutions, Healthcare and Life Sciences, Banking, Financial Services, and Insurance (BFSI), and Other Industry Verticals), and Geography (North America, South America, Europe, Asia-Pacific, and Middle East and Africa). The Market Forecasts are Provided in Terms of Value (USD).
| Software |
| Services |
| Software Composition Analysis |
| SBOM and VEX Management |
| License Compliance and Policy Governance |
| Vulnerability Intelligence and Remediation |
| Supply-Chain Attack and Malicious-Package Detection |
| Open-Source Program Office and Managed Services |
| Cloud |
| On-Premises |
| Hybrid |
| Large Enterprises |
| Small and Medium-Sized Enterprises |
| Government and Public Administration |
| Industrial Manufacturing |
| Retail and E-Commerce |
| Transportation and Logistics |
| Energy and Utilities |
| Oil and Gas |
| IT and Telecommunication |
| Media and Entertainment |
| Education and Research Institutions |
| Healthcare and Life Sciences |
| Banking, Financial Services, and Insurance (BFSI) |
| Other Industry Verticals |
| North America | United States | |
| Canada | ||
| Mexico | ||
| South America | Brazil | |
| Argentina | ||
| Rest of South America | ||
| Europe | Germany | |
| United Kingdom | ||
| France | ||
| Italy | ||
| BENELUX | ||
| Rest of Europe | ||
| Asia-Pacific | China | |
| Japan | ||
| India | ||
| South Korea | ||
| Australia | ||
| Rest of Asia-Pacific | ||
| Middle East and Africa | Middle East | United Arab Emirates |
| Saudi Arabia | ||
| Rest of Middle East | ||
| Africa | South Africa | |
| Nigeria | ||
| Egypt | ||
| Rest of Africa | ||
| By Component | Software | ||
| Services | |||
| By Solution Capability | Software Composition Analysis | ||
| SBOM and VEX Management | |||
| License Compliance and Policy Governance | |||
| Vulnerability Intelligence and Remediation | |||
| Supply-Chain Attack and Malicious-Package Detection | |||
| Open-Source Program Office and Managed Services | |||
| By Deployment Mode | Cloud | ||
| On-Premises | |||
| Hybrid | |||
| By Organization Size | Large Enterprises | ||
| Small and Medium-Sized Enterprises | |||
| By Industry Vertical | Government and Public Administration | ||
| Industrial Manufacturing | |||
| Retail and E-Commerce | |||
| Transportation and Logistics | |||
| Energy and Utilities | |||
| Oil and Gas | |||
| IT and Telecommunication | |||
| Media and Entertainment | |||
| Education and Research Institutions | |||
| Healthcare and Life Sciences | |||
| Banking, Financial Services, and Insurance (BFSI) | |||
| Other Industry Verticals | |||
| By Geography | North America | United States | |
| Canada | |||
| Mexico | |||
| South America | Brazil | ||
| Argentina | |||
| Rest of South America | |||
| Europe | Germany | ||
| United Kingdom | |||
| France | |||
| Italy | |||
| BENELUX | |||
| Rest of Europe | |||
| Asia-Pacific | China | ||
| Japan | |||
| India | |||
| South Korea | |||
| Australia | |||
| Rest of Asia-Pacific | |||
| Middle East and Africa | Middle East | United Arab Emirates | |
| Saudi Arabia | |||
| Rest of Middle East | |||
| Africa | South Africa | ||
| Nigeria | |||
| Egypt | |||
| Rest of Africa | |||


Key Questions Answered in the Report
What is the size of the Open source risk management market?
The open source risk management market size was valued at USD 2.46 billion in 2025 and is estimated to grow from USD 2.93 billion in 2026 to reach USD 7.83 billion by 2031, at a CAGR of 21.72% during the forecast period (2026-2031).
What is driving demand for open source risk management platforms?
Regulatory SBOM requirements, higher dependency density, malicious packages, and AI-generated code are increasing demand for governance and remediation tools.
Which component holds the largest revenue share?
Software held 61.47% of revenue in 2025, supported by demand for SaaS platforms integrated with DevSecOps workflows.
Which solution capability is growing fastest?
SBOM and VEX management is projected to grow at a CAGR of 28.32% through 2031 as compliance requirements and alert prioritization needs increase.
Which region is growing fastest?
Asia-Pacific is projected to grow at a CAGR of 28.71% through 2031, supported by regulation, export compliance, and supplier requirements.
Why are large enterprises the leading customer group?
Large enterprises held 68.27% of revenue in 2025 because their scale, regulatory exposure, acquisitions, and software development activity require broad governance programs.
Page last updated on:





