Market Overview
| Study Period | 2021 - 2031 |
|---|---|
| Forecast Data Period | 2026 - 2031 |
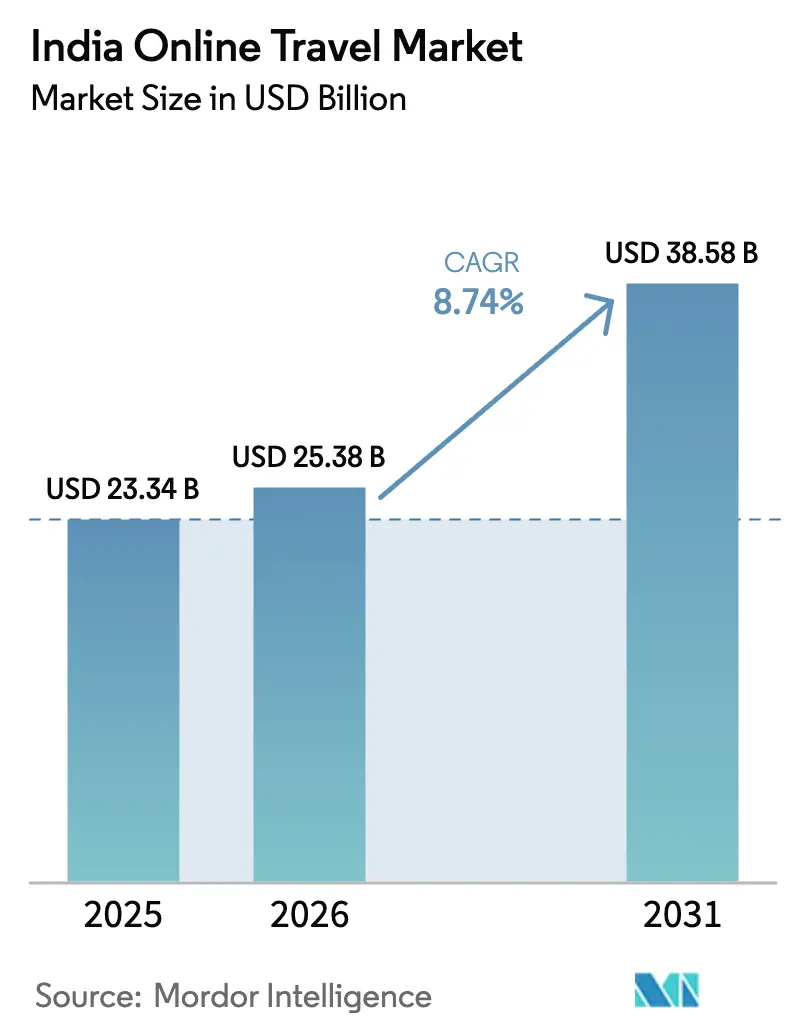
| Base Year Market Size (2025) | USD 23.34 Billion |
| Market Size (2026) | USD 25.38 Billion |
| Market Size (2031) | USD 38.58 Billion |
| Growth Rate (2026 - 2031) | 8.74% CAGR |
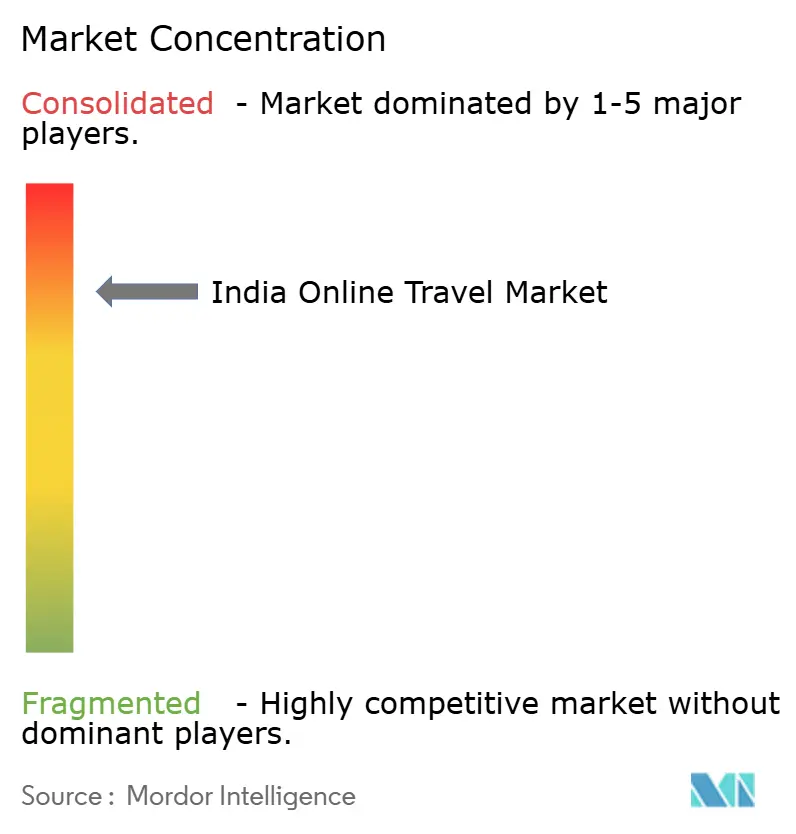
| Market Concentration | High |
Major Players *Disclaimer: Major Players sorted in no particular order Image © Mordor Intelligence. Reuse requires attribution under CC BY 4.0. | |
India Online Travel Market Analysis by Mordor Intelligence
The India Online Travel Market size is expected to grow from USD 23.34 billion in 2025 to USD 25.38 billion in 2026 and is forecast to reach USD 38.58 billion by 2031 at 8.74% CAGR over 2026-2031.
The expansion is paced by a broad-based rebound in air, hotels, and buses, paired with a growing appetite for curated vacation packages among mid-income households who now plan trips around immersive experiences rather than only transport and stays. Domestic tourism maintained strong momentum in 2025 after a surge in 2024 visits, and national campaigns continued to promote destination discovery and digital-ready experiences that feed online conversion. Mobile-first behaviour is now the norm as data usage rises and app ecosystems streamline search, selection, and payment, which sustains the structural shift towards app-led bookings. Regional air connectivity improvements under the UDAN program broaden access to new routes that OTAs and supplier-direct platforms can market with targeted promotions, raising utilization of digital channels outside top metros.
Key Report Takeaways
- By service type, transportation led with 36.24% of the India online travel market size in 2025, while vacation packages are projected to expand at an 11.24% CAGR through 2031.
- By booking device, mobile captured 65.37% of bookings in the India online travel market in 2025, and mobile is forecast to grow at a 14.39% CAGR through 2031.
- By business model, online travel agencies held 81.74% of the India online travel market size in 2025, while direct supplier online platforms are projected to grow at a 9.39% CAGR through 2031.
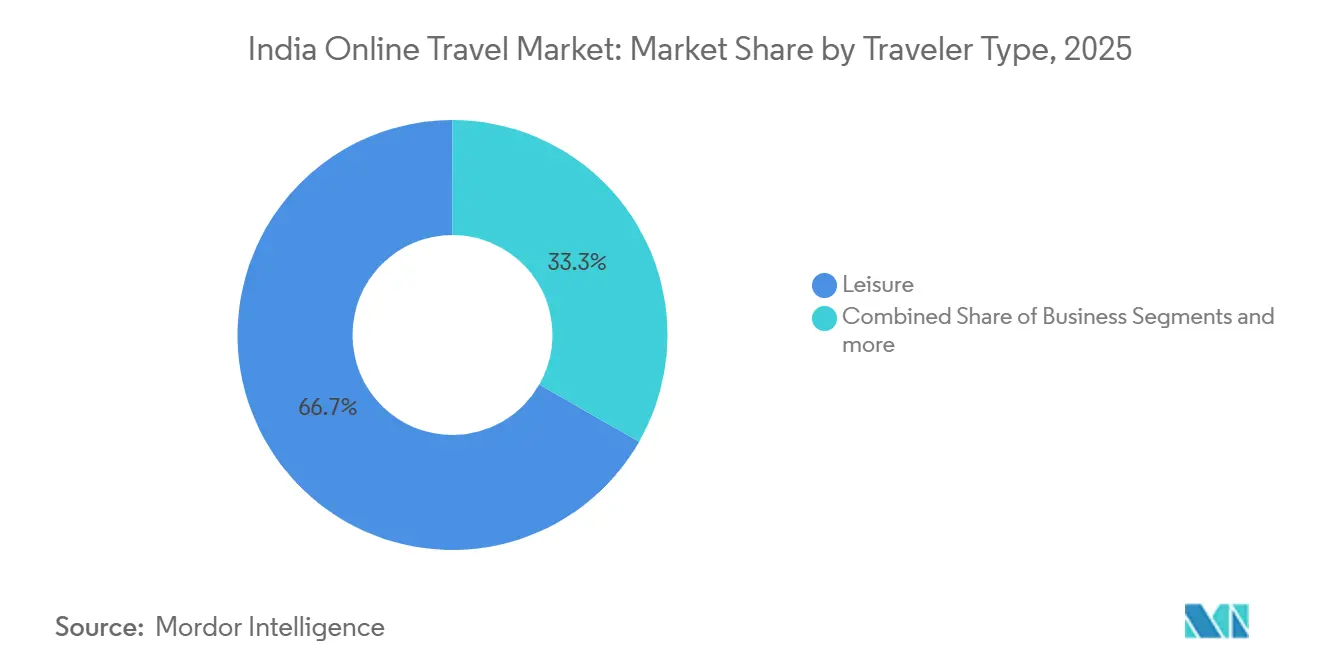
- By traveller type, leisure accounted for 66.74% of the India online travel market size in 2025, while bleisure is the fastest growing at an 11.46% CAGR to 2031.
- By age group, the 31–45 cohort held a 51.24% share of the India online travel market size in 2025, while the 18–30 year-olds are projected to grow at a 10.33% CAGR to 2031.
- By geography, North India led with 33.73% of the India online travel market size in 2025, while West India is set to post a 13.35% CAGR through 2031.
Note: Market size and forecast figures in this report are generated using Mordor Intelligence’s proprietary estimation framework, updated with the latest available data and insights as of January 2026.
India Online Travel Market Trends and Insights
Drivers Impact Analysis*
| Driver | (~) % Impact on CAGR Forecast | Geographic Relevance | Impact Timeline |
|---|---|---|---|
| Rising Adoption of UPI & Digital Wallets Accelerating Seamless Bookings | +2.1% | National, with the highest gains in tier-2/3 cities | Short term (≤ 2 years) |
| Government's UDAN Scheme Expanding Regional Air Connectivity | +1.8% | National, with early gains in Tier-2/3 cities and North-East states | Medium term (2-4 years) |
| Domestic Tourism Surge Fuelled by Social-Media Influence | +1.5% | National, with spillover to tier-2 markets | Short term (≤ 2 years) |
| Rapid Growth of Middle-Income Millennials' Discretionary Spending | +1.4% | Metros and tier-1 cities expanding to tier-2 hubs | Medium term (2-4 years) |
| Smartphone Penetration in Tier-II & III Cities Boosting App Usage | +1.2% | Tier-2/3 cities and rural belts | Short term (≤ 2 years) |
| Dynamic Pricing Algorithms Enhancing Conversion & Yield | +0.4% | National, technology-enabled platforms | Short term (≤ 2 years) |
| Source: Mordor Intelligence | |||
Rising Adoption of UPI & Digital Wallets Accelerating Seamless Bookings
Digital payment adoption has aligned with a step-up in internet access and mobile usage, which reduces checkout friction and helps convert browsing into confirmed bookings across flights, rail, bus, hotels, and packages. Widespread 4G availability in towns and villages under national connectivity programs has created a broader base of online-ready travellers who increasingly transact through instant payment rails within OTA and supplier apps. High-frequency mobile data consumption supports richer in-app content such as reviews, videos, and chat-assisted support that shorten decision cycles and improve funnel conversion for the India online travel market. At the platform end, integrated payment experiences are becoming table stakes, as large players invest in scale, safety tooling, and compliance to sustain repeat usage without adding visible friction for consumers. The net effect is a more reliable and faster checkout layer that encourages first-time online bookers in smaller cities to remain digital across future trips, which supports steady penetration gains in the India online travel market.[1]Source: Ministry of Communications, “Universal Connectivity and Digital India Initiatives,” Press Information Bureau, pib.gov.in
Government's UDAN Scheme Expanding Regional Air Connectivity
The UDAN regional connectivity scheme has operationalized hundreds of routes and connected dozens of airports since launch, which opens new point-to-point air options and shortens journeys that previously required long road or rail connections.[2]Source: Ministry of Civil Aviation, “UDAN Scheme Connecting India, One Flight at a Time,” Press Information Bureau, pib.gov.in This connectivity scale-up, coupled with a doubling of the broader airport network over the last decade, expands the addressable pool of first-time and occasional fliers who increasingly discover and book seats online. OTAs and direct supplier platforms benefit as travellers in newly connected cities consider bundled packages and last-mile add-ons, which lift attach rates and improve monetization per booking in the India online travel market. As new air corridors stabilize, platform players can pre-negotiate inventory, refine dynamic pricing rules, and use targeted marketing to nurture steady demand along nascent routes. Over time, improved access also encourages hospitality investments in secondary and tertiary cities, which adds quality rooms into digital channels and deepens the inventory available to online travellers.
Domestic Tourism Surge Fuelled by Social-Media Influence
Destination marketing shifted toward content-led discovery, with national campaigns, creator partnerships, and image libraries that equip partners to tell location stories tailored to audience interests and seasonality. Evidence from Delhi and other circuits shows social content can lift intent and visitation among younger cohorts, which translates into measurable uplifts in stays near promoted attractions and neighbourhoods. The India online travel market converts this interest into app-based search, curated lists, and dynamic deals that meet the traveller at inspiration and capture the booking before intent dissipates. Government-backed content hubs now provide high-quality assets to tourism boards and collaborators, which amplifies reach at a lower cost than traditional media and feeds a steady pipeline of digitally primed demand. This interplay between visual discovery, mobile-first planning, and convenient digital checkout continues to push travellers toward platforms that can bundle transport, stays, and local experiences in one flow.
Rapid Growth of Middle-Income Millennials' Discretionary Spending
Spending recovery among middle-income households and the preference for experiences such as wellness escapes and short-haul international breaks support resilient demand for both domestic and outbound trips. As digital natives, these cohorts research and book on apps, respond to time-bound deals, and favour mid-range properties that balance comfort and cost, which fits the curated value positioning of leading platforms. This behaviour aligns with steady growth projected for the bleisure segment, where travellers extend work trips to add leisure days and bundle additional room nights within the same digital journey. Card-network insights indicate strong cross-border purchase momentum by Indian travellers, which sustains outbound bookings while reinforcing the appeal of domestic getaways that require simpler planning. As platforms refine loyalty benefits and embedded financing options with regulated partners, the India online travel market captures a greater share of discretionary spend from repeat users who prioritize convenience and predictability.
Restraints Impact Analysis*
| Restraint | (~) % Impact on CAGR Forecast | Geographic Relevance | Impact Timeline |
|---|---|---|---|
| Fragmented, Unorganized Accommodation Supply Limiting Digitization | -1.5% | National, acute in tier-3 towns and religious circuits | Medium term (2-4 years) |
| Regulatory Uncertainty on Convenience Fees & Refund Norms | -0.9% | National, influence from competition and consumer regulators | Medium term (2-4 years) |
| Cybersecurity Breaches Undermining Consumer Trust | -0.7% | National, platform-specific incidents | Short term (≤ 2 years) |
| Escalating Customer-Acquisition Costs Amid Price Wars | -1.1% | Platform-led competitive markets | Short term (≤ 2 years) |
| Source: Mordor Intelligence | |||
Fragmented, Unorganized Accommodation Supply Limiting Digitization
A large share of lodging inventory remains unregistered and offline, which constrains digital availability and reduces pricing transparency in smaller towns and pilgrimage circuits where demand is rising. Government initiatives such as sector databases and classification programs aim to standardize quality and improve discoverability, yet adoption by small operators takes time without stronger incentives and sustained outreach. In practice, platforms continue to rely more on branded chains in high-traffic destinations while scaling field onboarding teams where awareness and digital readiness are low. Over the medium term, better registration, uniform identifiers, and simpler compliance pathways can reduce duplicate listings and improve trust, which would allow more small properties to enter online channels. Closing these gaps is central to unlocking new inventory pools that the India online travel market needs in tier-2 and tier-3 catchments as demand scales beyond metros.
Cybersecurity Breaches Undermining Consumer Trust
The travel value chain stores high-value personal and payment data, and threat reports point to sustained targeting of hospitality and adjacent sectors by malware, phishing, and account-takeover attacks. The operational response requires layered defences, regular audits, and disciplined incident response across app, API, and cloud layers to protect both customer information and booking integrity. Government data protection rules went live in 2024 and raised the stakes on breach reporting and penalties, which pushes larger platforms to formalize governance and controls at scale. Disclosures in public filings also highlight that cybersecurity and data governance are material risk considerations for investors evaluating platform durability. Public-sector exemplars in rail e-ticketing have documented security investments and periodic audits that set a benchmark, although replicating that maturity across the private ecosystem will take time and resources.
*Our forecasts treat driver/restraint impacts as directional, not additive. The impact forecasts reflect baseline growth, mix effects, and variable interactions.
Segment Analysis
By Service Type: Strategic Bets on High-Margin Vacation Bundles
Transportation accounted for 36.24% in 2025, while vacation packages are projected to grow at 11.24% CAGR through 2031 as travellers shift from self-assembly to bundled experiences. This shift favours platforms that can pre-negotiate hotel blocks, local activities, and transfers, since packaged itineraries deliver better take rates than commoditized air. Leading players reported higher adjusted margins in hotels-and-packages relative to air, which underscores that curated combinations, not only volume throughput, drive profitability in the India online travel market. Corporate travel specialists also use pre-negotiated inventory to serve group demand, which demonstrates the scalability of contract-based supply when paired with software-driven workflows. Platforms that expand activities marketplaces and local experiences can capture more of the destination wallet, reinforcing their package-led value proposition in the India online travel market.
Air within transportation remains a core funnel driver, yet take rates are structurally lower than in hotels, which keeps the strategic focus on monetizing ancillary services and cross-selling higher-margin components. Rail and bus add scale and frequency, and their digital penetration lifts as app interfaces improve reliability from search to post-booking support across routes that serve both commuters and leisure travellers. The India online travel market share tends to concentrate in service lines where inventory depth and service-level predictability are strongest, which is why branded hotels and standardized packages gain prominence as the base of repeat users grows. On the supply side, the gradual expansion of chain hotels and registered homestays adds reliable rooms that platforms can present with clear service standards, reviews, and prices. As regional connectivity opens new short-break circuits, packaged escapes that combine flights, stays, and on-ground experiences will likely remain the fastest-growing service type in the India online travel market.


By Booking Device: Mobile Ascendancy and the Desktop's Twilight
Mobile captured 65.37% of bookings in 2025 and is forecast to grow at 14.39% CAGR through 2031, which cements app-first planning and checkout as the default consumer path. Smartphone-led access is underpinned by high data usage per subscriber and the growing ubiquity of 4G coverage, which together enable richer content and faster purchase flows. The India online travel market size for mobile bookings is projected to expand at a 14.39% CAGR between 2026 and 2031 as platforms continue to optimize for speed, personalization, and reliability on smaller screens. App ecosystems integrate fare alerts, real-time chat, and one-tap payments that reduce abandonment and increase repeat usage, especially among millennials and Gen Z, who prefer bite-sized, on-the-go planning. While desktop channels still serve complex multi-leg or corporate itineraries, the centre of gravity for leisure and short-haul booking is decisively mobile in the India online travel market.
Mobile’s dominance also shifts how platforms design onboarding, verification, and support as users expect real-time updates and service continuity from pre-trip to in-trip. Push notifications pair with contextual offers that match departure patterns, loyalty benefits, and weather windows, which improves conversion in the India online travel market without relying on heavy discounting. Over time, more inventory and services become app-native, from seat selection and meal preferences to in-destination activities, which raises the share of revenue captured post-booking. As data localization and security practices strengthen, leading apps standardize secure flows that protect user data and payment credentials while keeping the experience simple for repeat travellers. The net impact is a durable advantage for platforms that invest ahead of the curve on app performance and trust-building, reinforcing mobile-led growth in the India online travel market.
By Business Model: Aggregator Dominance Versus the Direct-Channel Insurgency
Online travel agencies held 81.74% of bookings in 2025, while direct supplier online platforms are projected to grow at a 9.39% CAGR through 2031 as airlines, rail, and hotel chains push loyalty and member-only pricing. Aggregators defend share through bundling, merchandising, and cross-selling of add-ons such as insurance and local experiences, which sustain monetization despite pressure on airfare rates. At the same time, direct portals leverage lower distribution costs and program benefits to attract frequent travellers, which raises competitive intensity and reshapes traffic acquisition strategies in the India online travel market. Rail continues to exemplify a powerful direct channel at a national scale, with public-sector platforms documenting security controls, periodic audits, and user growth in official reports. Over the medium term, aggregator resilience will depend on deeper hotel and activities curation, as well as enterprise-grade tools that retain corporate customers within managed travel programs in the India online travel market.
Leading OTA filings show growing gross bookings across air, hotels, and buses, alongside investments in AI assistants and better support automation that lowers servicing costs per transaction. Corporate travel specialists report new client wins that broaden revenue beyond consumer leisure cycles and lift attach rates for meetings and events, which smooths volatility in the India online travel market. Regulatory clarity on pricing disclosures and consumer protection will influence model choices, yet investments in product depth and service reliability are likely to remain the primary levers of differentiation. As direct channels scale, OTAs will rely even more on high-margin non-air verticals and loyalty partnerships to protect traffic and yield per booking in the India online travel market. The base case points to continued coexistence shaped by consumer value, inventory access, and program economics that reward frequent use on both sides.
By Traveler Type: Leisure Dominates, Bleisure Blazes, Business Lags
Leisure accounted for 66.74% in 2025, and bleisure is the fastest-growing traveller group at 11.46% CAGR through 2031 as flexible work patterns and weekend extensions normalize across key corporate hubs. Domestic travel momentum, supported by national destination campaigns and improved last-mile connectivity, underpins consistent leisure demand across heritage, nature, and spiritual circuits. Platforms design tailored offers that capture additional nights and experiences around business trips, which raises attach rates and boosts unit economics for the India online travel market. This behaviour is reinforced by mobile discovery and instant booking, which allows quick decisions in response to dynamic pricing and limited-time availability. Over the cycle, leisure and bleisure together set the pace for volume growth while corporate travel anchors predictable base demand in the India online travel market.
Corporate-focused providers continue to expand client portfolios and cross-sell software capabilities such as expense management and policy compliance, which supports steady billings even when consumer budgets fluctuate. Leisure trips benefit from content-led discovery, strong festival calendars, and curated combos that simplify decisions for families and small groups. As more travellers begin their journey on mobile and finish within a single app session, leading platforms write playbooks around nudges and post-booking experiences that increase loyalty. The India online travel market will likely see the leisure share stay dominant while bleisure outpaces the base as policy and product innovation align with traveller preferences. Over time, unified itineraries that bridge business and leisure will further reduce friction and keep more spend within digital channels.
By Age Group: Millennials Lead, Gen Z Accelerates, Boomers Fade
The 31–45 year-olds held a 51.24% share in 2025, and the 18–30 group is projected to grow fastest at a 10.33% CAGR through 2031, supported by mobile-first planning and a preference for experiential travel. Card-network insights suggest sustained growth in cross-border spending by Indian travellers, which complements steady demand for domestic short breaks in priority segments. Millennials and Gen Z favour mid-range stays and value-driven choices that match curated OTA listings, which strengthens conversion and repeat behaviour in the India online travel market. Older cohorts show slower growth and lean toward higher-end properties with lower booking frequency, which makes them margin accretive but less central to volume scale-up. Over the forecast horizon, product design will continue to skew toward mobile-native features that resonate with younger users while maintaining clear service standards for confidence across all age brackets.
As loyalty and embedded payments deepen, platforms can personalize bundles by age cohort and trip purpose, which improves attach rates for experiences and insurance. The India online travel market share will concentrate on providers that align inventory and UX with the behaviours of these dominant cohorts while preserving trusted flows for less digitally fluent users. Destination content and seasonal offers tailored to milestone moments such as school breaks and festivals can further boost conversion among families within the 31–45 age cluster. As Gen Z enters higher-earning years, their frequency and basket size are likely to rise, expanding the total addressable spend that digital channels can capture across devices and trip types. This cohort evolution sustains a broad base of repeat users, which supports durable growth for the India online travel market beyond the forecast window.
Geography Analysis
North India held 33.73% of the market in 2025, and West India is projected to post a 13.35% CAGR through 2031 as corporate hubs and coastal destinations expand capacity and diversify product. Northern circuits benefit from an established mix of heritage, spiritual, and city tourism supported by air, rail, and highway networks that together ease online-to-offline transitions. State-level initiatives continue to invest in infrastructure, digital readiness, and content-led promotion, which keeps the India online travel market strong in major northern corridors. Enhanced air connectivity under UDAN improves access to smaller airports and cuts transit times, which nudges more travellers to discover and book online itineraries to secondary destinations. As more quality room supply enters the pipeline in northern cities and towns, platforms can present deeper choice sets with clearer service benchmarks and verified listings.
West India is forecast to lead growth, driven by a dense base of business travel in metro clusters and strong leisure demand for coastal breaks, culture, and events. As corporate events and conventions expand, managed travel providers use software and contracts to channel volumes into digital pathways, which supports steady monetization for the India online travel market. Robust internet usage and app adoption underpin quick discovery and booking, especially for short-haul flights and weekend hotel stays that are often decided close to departure. As content-rich campaigns highlight off-peak experiences and emerging locations, platforms can balance seasonal peaks and expand mid-week occupancy through targeted offers. The India online travel market will likely see West India sustain above-trend growth as supply and digital readiness scale in tandem across its urban and leisure nodes.
South India blends tech-hub business demand with temple, nature, and wellness circuits, which lend resilience across seasons and support cross-sell from corporate to leisure extensions. State programs and content partnerships continue to spotlight signature experiences such as backwaters, cuisine, and heritage, which help the India online travel market convert inspiration into bookings. East and Central regions are catching up with new air corridors and expressways that reduce travel times and make long-weekend trips more workable for urban households. As infrastructure scales and more small properties formalize, digital platforms can expand inventory and improve value-for-money across day trips, pilgrimages, and nature escapes. The India online travel market size is reinforced by this multi-region growth as connectivity and content converge to raise digital penetration across the country.
Competitive Landscape
The India online travel market features large integrated OTAs alongside strong supplier-direct channels in air, rail, and hotels, which together create a competitive balance shaped by product depth, loyalty economics, and service reliability. Leading OTA disclosures show growth in gross bookings across air, hotel, and bus, coupled with investments in AI assistants and app improvements that lower servicing costs per transaction. Corporate travel specialists reported profitability and client additions in 2025, which anchor enterprise demand and diversify revenue beyond consumer leisure cycles.[3]Source: Yatra Online, Inc., “Q2 FY25 Results,” Yatra, investors.yatra.comRail’s public-sector platform continues to scale with documented security measures and process audits that set a reference standard for performance and resilience. Across models, the basis of competition is shifting from lowest price to curated convenience, service predictability, and ecosystem benefits that increase share of wallet over time.
Strategic moves in 2025 included large-scale capital raises and convertible notes that enhance balance-sheet strength for acquisitions and new product expansion, with disclosures highlighting risk management and governance priorities. Corporate travel providers emphasized MICE and software-led services, and filings and press releases point to cross-sell gains and broader client rosters across the year. On the product side, platforms refined in-app guidance, loyalty attach, and post-booking experiences that reduce churn and improve repeat rates, which is critical as direct supplier channels scale. The India online travel market remains dynamic as players balance customer acquisition with unit economics, invest in security and compliance, and build deeper inventory relationships that enhance value creation.
Public-sector initiatives also shaped the landscape in 2025 as state-backed upgrades to content hubs, marketing, and connectivity reinforced the digital demand funnel across regions. Elevation of key public platforms to a higher autonomy status supported faster decision-making on technology investments and integrations, which benefits the ecosystem. As suppliers expand direct channels and loyalty benefits, OTAs continue to differentiate through breadth of choice, packaging, and service guarantees that simplify complex trip planning. The India online travel market is therefore poised for steady competition centred on product richness, service quality, and trust rather than pure price, a shift that encourages sustainable growth across the next phase.
India Online Travel Industry Leaders
MakeMyTrip Ltd.
Yatra Online Ltd.
EaseMyTrip
Cleartrip Pvt. Ltd.
Ixigo
- *Disclaimer: Major Players sorted in no particular order

Recent Industry Developments
- November 2025: Paytm adopted artificial intelligence (AI) to enhance profitability and diversify its offerings. AI integration in merchant devices enabled analytics and voice commands. The AI-powered Paytm Checkin app streamlined travel bookings and delivered personalized recommendations via a conversational interface, aiming to improve user experience and strengthen competition with established online travel agencies.
- August 2025: MakeMyTrip launched "Myra," a multilingual GenAI trip-planning assistant, enhancing its previous AI agent. Myra supports conversational planning and booking via text and voice, addressing language barriers and improving accessibility. Initially available in English and Hindi, the Beta version aims to expand to additional Indian languages after refining user interaction based on feedback.
- August 2025: Yatra launched DIYA, an AI-driven travel assistant designed to streamline travel planning, bookings, and post-booking management across 100+ languages. This solution integrates itinerary creation, booking processes, and last-minute changes with 24/7 multilingual support. DIYA addresses modern travel demands by delivering a fast, personalized, and efficient multilingual experience, enhancing convenience and trip management efficiency.
- March 2025: The Indian government conferred Navratna status on IRCTC, strengthening its financial independence to support planned capital investments and digital initiatives, with a focus on travel-tech platforms.


Research Methodology Framework and Report Scope
Market Definitions and Key Coverage
Our study defines the Indian online travel market as the gross booking value generated when consumers use internet-based platforms to search, compare, and confirm domestic or outbound transport, lodging, packaged holidays, and in-destination activities. The definition covers deals closed on third-party travel sites as well as the direct digital portals of airlines, railways, bus aggregators, hotels, and car rentals.
We exclude offline reservations handled by brick-and-mortar agents and corporate self-booking tools dedicated solely to managed business travel.
Segmentation Overview
- Segmentation by Service Type
- Transportation
- Air Travel
- Bus & Coach Travel
- Rail Travel
- Car Rental
- Cruise
- Travel Accommodation
- Hotels & Resorts
- Alternative Lodging/Rentals
- Vacation Packages
- Others
- Transportation
- Segmentation by Booking Device
- Desktop / Laptop
- Mobile
- Segmentation by Business Model
- Online Travel Agencies
- Direct Supplier Online Platforms
- Segmentation by Traveler Type
- Leisure
- Business
- Bleisure
- Segmentation by Age Group
- 18-30 Years
- 31-45 Years
- 46-60 Years
- Greater than 60 Years
- Segmentation by Region
- North India
- South India
- West India
- East India
- Central India
Detailed Research Methodology and Data Validation
Primary Research
We interview OTA executives, airline sales heads, hotel revenue managers, and payment specialists in Tier-I and Tier-II cities to test mobile share, conversion funnels, and spend bands. Quick consumer surveys across multiple regions validate adoption rates that documents alone cannot reveal.
Desk Research
Baseline figures are drawn by our analysts from high-credibility, open sources such as Ministry of Tourism visitor counts, DGCA air-traffic releases, IRCTC e-ticket data, TRAI internet-user reports, and Reserve Bank foreign-exchange earnings. Company filings, investor decks, and trusted trade press help us trace booking-mix shifts and average-price movements.
Paid feeds, D&B Hoovers, Dow Jones Factiva, and Questel, provide financial, news, and patent signals that sharpen assumptions.
Numerous other public notes, white papers, and customs extracts are reviewed; the list above is illustrative, not exhaustive.
Market-Sizing & Forecasting
The model starts with a top-down build of gross booking value from passenger volumes, room nights, and average selling prices. It then cross-checks those totals with sampled supplier roll-ups. Smartphone penetration, disposable income per capita, air-seat supply, outbound-departure trends, and UPI payment velocity feed a multivariate regression that extends the forecast window.
Data Validation & Update Cycle
Outputs face variance tests versus historical elasticities and peer indicators before a two-level analyst review. Mordor analysts refresh each dataset annually and issue mid-cycle updates whenever policy changes or shocks materially alter demand.
Why Mordor Intelligence's India Online Travel Baseline Is Dependable
Published numbers differ because firms adopt varied scopes, exchange rates, and refresh speeds; we address these drivers openly.
Mordor folds direct supplier portals and ancillaries that some omit, yet leaves out corporate self-booking modules that others include. Moderate ASP paths and a twelve-month refresh cycle underpin a tempered, current baseline.
Benchmark comparison
| Market Size | Anonymized source | Primary gap driver |
|---|---|---|
| USD 21.44 B (2024) | Mordor Intelligence | |
| USD 51.00 B (2024) | Global Consultancy A | Counts corporate travel and anticipates offline-to-online migration ahead of realization |
| USD 15.61 B (2024) | Industry Association B | Limits scope to OTA bookings, excluding supplier portals and ancillary services |
| USD 19.05 B (2025) | Trade Journal C | Applies uniform discount factors and single-source exchange rates without cross-checks |
The comparison shows how altered scope and unchecked inputs widen gaps. By tying values to verifiable traffic and spend metrics, Mordor Intelligence offers decision-makers a clear, repeatable baseline they can trust.


Key Questions Answered in the Report
What is the current size and growth outlook for the India online travel market to 2031?
The India online travel market size is USD 25.38 billion in 2026 and is projected to reach USD 38.58 billion by 2031 at an 8.74% CAGR.
Which booking device will lead growth in India over the next five years?
Mobile already accounts for 65.37% of bookings and is expected to grow at a 14.39% CAGR through 2031 due to app-first behaviour and improving data access.
Which traveler segment is expanding the fastest in India?
Bleisure is the fastest-growing traveller type at an 11.46% CAGR to 2031 as business trips extend into weekend leisure add-ons.
Which region is expected to grow the fastest in India?
West India is projected to deliver a 13.35% CAGR, supported by corporate hubs, coastal demand, and expanding capacity across cities.
How is government policy supporting online travel growth in India?
The UDAN program has expanded regional air connectivity across hundreds of routes and dozens of airports, improving access and encouraging digital bookings beyond metros.
What factors most improve conversion for travel apps in India?
Mobile-first design, integrated payments, and content-rich discovery drive conversion, supported by high data usage and reliable connectivity nationwide.
Page last updated on:


