Composite Repair Market Size and Share
Market Overview
| Study Period | 2021 - 2031 |
|---|---|
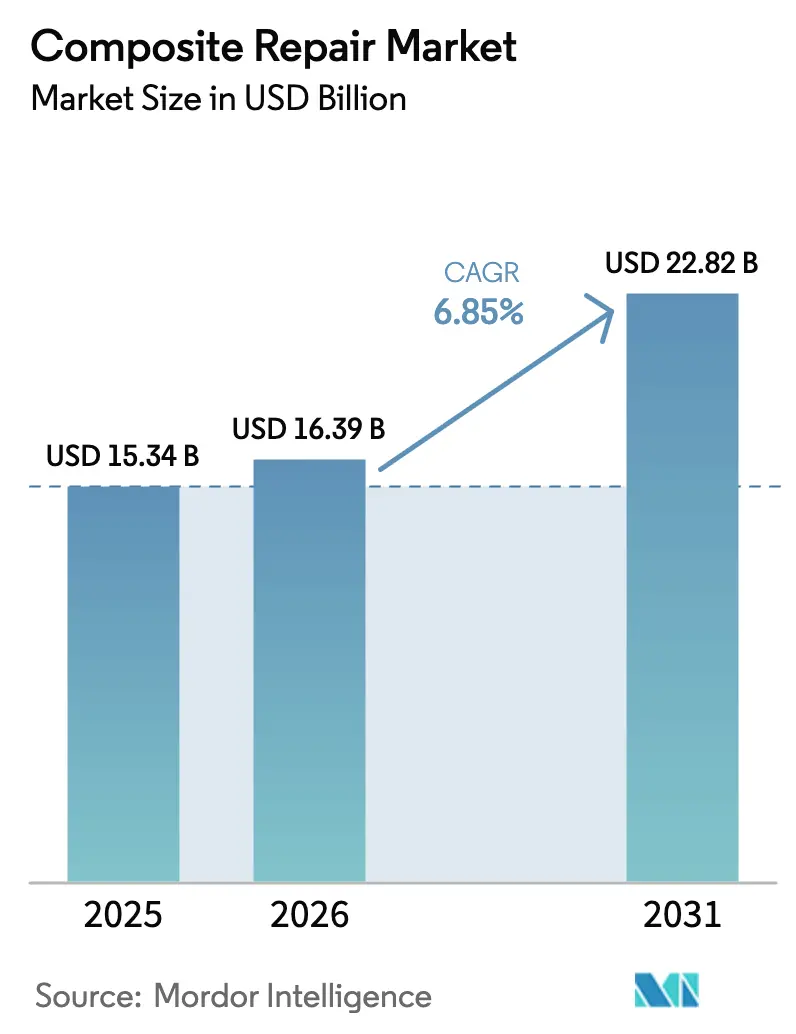
| Market Size (2026) | USD 16.39 Billion |
| Market Size (2031) | USD 22.82 Billion |
| Growth Rate (2026 - 2031) | 6.85% CAGR |
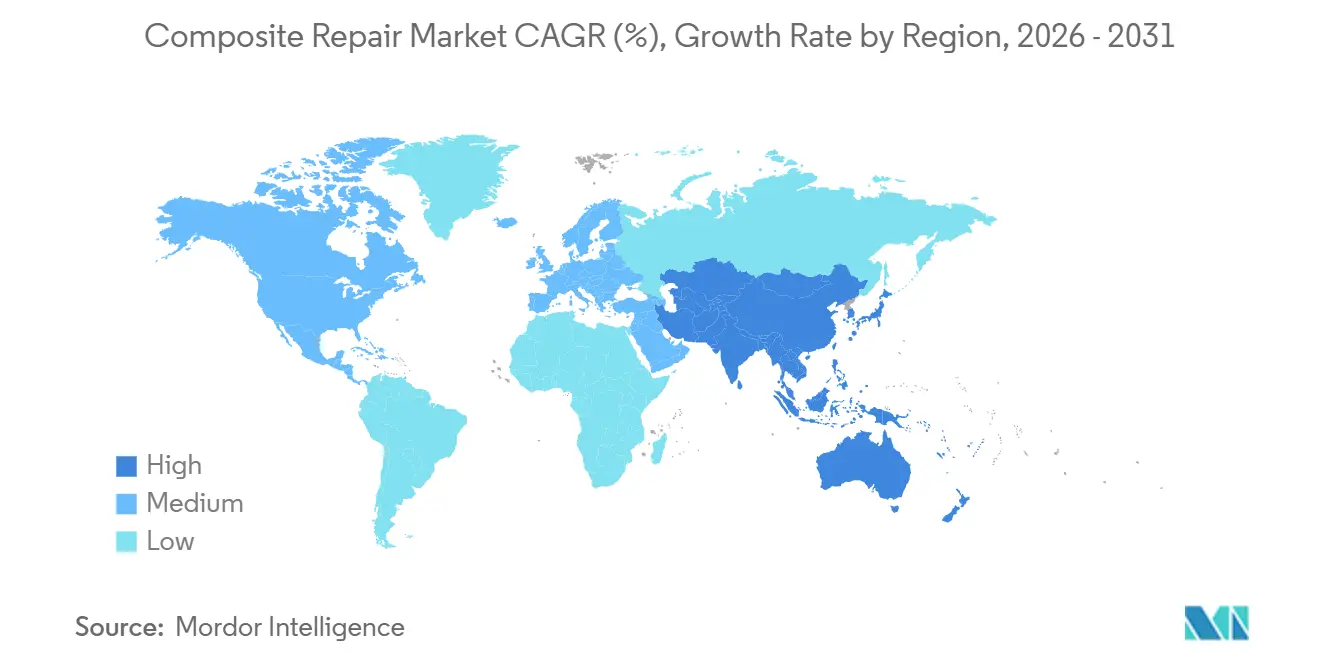
| Fastest Growing Market | Asia Pacific |
| Largest Market | Asia Pacific |
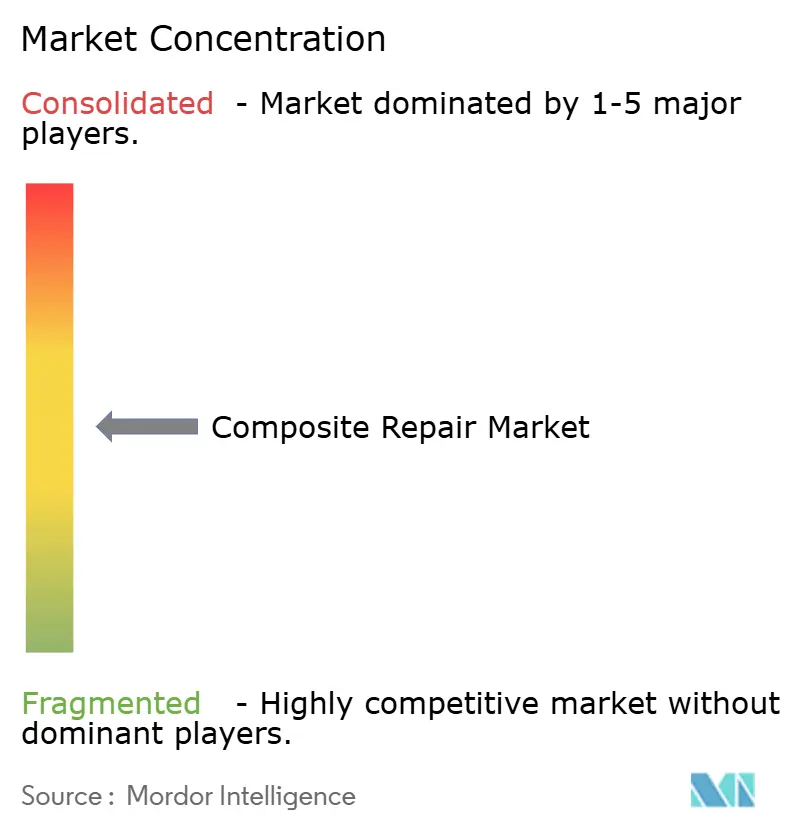
| Market Concentration | Medium |
Major Players *Disclaimer: Major Players sorted in no particular order Image © Mordor Intelligence. Reuse requires attribution under CC BY 4.0. | |
Composite Repair Market Analysis by Mordor Intelligence
The Composite Repair Market size is projected to be USD 15.34 billion in 2025, USD 16.39 billion in 2026, and reach USD 22.82 billion by 2031, growing at a CAGR of 6.85% from 2026 to 2031. Widening adoption of carbon-fiber reinforced polymer (CFRP) structures in aircraft, wind turbines, and industrial assets has shifted repair from a reactive cost center to a strategic capital-preservation tool. The 2024 update of FAA Advisory Circular 20-107B shortened structural-repair approvals by one-third, releasing deferred maintenance budgets and giving operators a faster route to keep high-value assets in service. Asia-Pacific is setting the pace, propelled by COMAC C919 fleet expansion and an offshore-wind build-out across the Taiwan Strait and the Yellow Sea, while parallel investment in certified maintenance, repair, and overhaul (MRO) hubs lifts demand for mobile autoclave services. Composite material suppliers are integrating downstream to capture service revenue, and operators increasingly weigh on-site repair economics against replacement lead times, reinforcing the composite repair market as a balance-sheet lever rather than a maintenance expense.
Key Report Takeaways
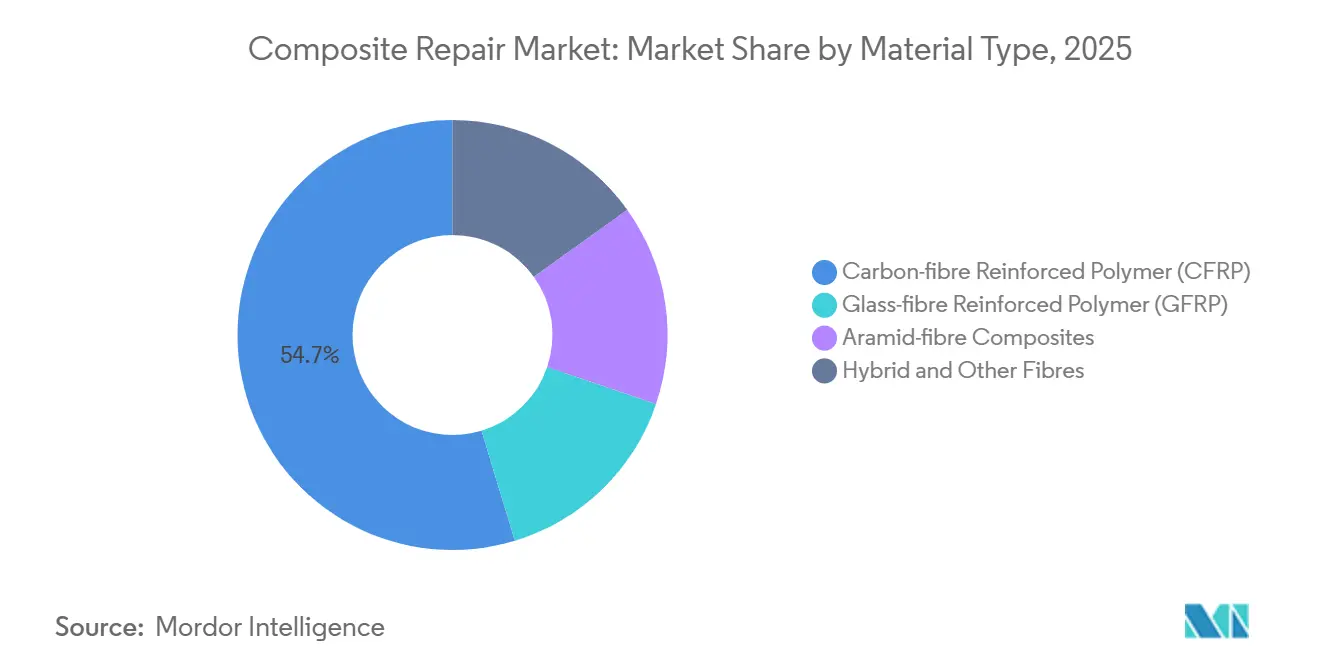
- By material type, Carbon-fibre Reinforced Polymer (CFRP) commanded 54.69% of the composite repair market share in 2025, while aramid-fiber composites are forecast to post a 7.85% CAGR through 2031.
- By product type, structural accounted for 44.71% of 2025 revenue, and cosmetic is expected to grow at a 7.71% CAGR to 2031.
- By repair process, hand lay-up led with 38.78% revenue share in 2025; autoclave is projected to advance at an 8.15% CAGR to 2031.
- By end-user industry, aerospace and defense held 44.22% revenue share in 2025; wind energy is poised to register a 7.81% CAGR through 2031.
- By geography, Asia-Pacific generated 38.54% of 2025 revenue and is forecast to expand at an 8.29% CAGR to 2031.
Note: Market size and forecast figures in this report are generated using Mordor Intelligence’s proprietary estimation framework, updated with the latest available data and insights as of January 2026.
Global Composite Repair Market Trends and Insights
Drivers Impact Analysis*
| Driver | (~) % Impact on CAGR Forecast | Geographic Relevance | Impact Timeline |
|---|---|---|---|
| Surging Investment in Aging-Asset Life-Extension Programs | +1.8% | Global, concentrated in North America offshore oil & gas, Europe industrial infrastructure | Medium term (2-4 years) |
| Cost Advantages of On-Site Composite Repair Versus Metallic Part Replacement | +2.1% | Global, particularly Asia-Pacific aerospace MRO hubs and North America wind farms | Short term (≤ 2 years) |
| Increasing Use of Composites in Aerospace and Defense Industry | +1.5% | Global, led by North America and Europe OEM production, spillover to Asia-Pacific MRO | Long term (≥ 4 years) |
| Offshore Wind-Blade Length Growth Demanding In-Situ Repair Capability | +1.2% | Europe (North Sea), Asia-Pacific (Taiwan Strait and Yellow Sea), emerging in the US Atlantic Coast | Medium term (2-4 years) |
| Hydrogen Pipeline Retrofits Needing Non-Metallic Reinforcement | +0.8% | Europe hydrogen corridors, Middle East petrochemical hubs, North America industrial clusters | Long term (≥ 4 years) |
| Source: Mordor Intelligence | |||
Surging Investment in Aging-Asset Life-Extension Programs
Operators are redirecting capital from new builds to life-extension projects as replacement lead times stretch beyond two years and regulatory hurdles tighten. The U.S. Department of Energy earmarked USD 1.2 billion in 2025 for composite wrapping of nuclear-plant cooling-water piping, enabling upgrades without reactor shutdowns[1]U.S. Department of Energy, “Energy Infrastructure Life-Extension Funding,” energy.gov . Gulf of Mexico oil platforms commissioned in the 1980s now employ glass-fiber overwraps that extend riser life by up to 20 years at one-third the steel-replacement cost. TD Williamson secured multi-year subsea pipeline contracts from Chevron and Shell after expanding its composite division in 2024. Europe mirrors the trend: North Sea operators doubled composite integrity spending to EUR 800 million in 2025, evidence that composite repair preserves cash flow while deferring the environmental scrutiny triggered by new construction approvals.
Cost Advantages of On-Site Composite Repair Versus Metallic Part Replacement
Field repair economics favor composites by a wide margin. Lufthansa Technik quantified that on-wing repair of a Boeing 777 composite radome costs USD 35,000 over 48 hours, whereas replacement is USD 120,000 and grounds the jet for seven days, causing USD 200,000 revenue loss. Wind-farm operators echo these savings: in-situ repair of a 90-meter blade costs USD 80,000, compared with USD 250,000 for depot work and two-week generation loss. HAECO’s mobile repair units trimmed narrow-body turnaround from five days to 18 hours at Asia-Pacific airports in 2025, illustrating how time-value benefits amplify direct cost savings.
Increasing Use of Composites in the Aerospace and Defense Industry
Composite content in commercial aircraft rose from 20% in 2015 to 35% in 2025, creating a deferred repair wave as early CFRP structures reach 15-year inspections. COMAC C919 airframes will require their first major composite checks in 2026-2027, driving demand for certified repair stations across Asia-Pacific. The U.S. Air Force awarded Toray a USD 45 million contract in 2024 for rapid-cure prepreg systems that cut F-35 stealth-coating downtime from 72 hours to 12 hours. EASA’s 2025 standards now mandate non-destructive testing for all primary-structure repairs, raising entry barriers yet validating the long-term demand for high-skill composite repair services.
Offshore Wind Blade Length Growth Demanding In-Situ Repair Capability
Blades exceeding 115 meters make depot repair economically prohibitive. A 2025 Technical University of Denmark analysis showed transport of a 110-meter blade from a North Sea farm to Germany costs EUR 400,000, while rope-access repair costs EUR 90,000. The U.S. Department of Energy flagged blade repair as a bottleneck for Atlantic Coast projects in its 2024 roadmap. Wind speeds up to 15 m/s let crews fix blades during short weather windows, safeguarding turbine availability.
Restraints Impact Analysis*
| Restraint | (~) % Impact on CAGR Forecast | Geographic Relevance | Impact Timeline |
|---|---|---|---|
| Emergence of Self-Healing Composite Laminates | -0.6% | Global, earliest adoption in automotive and consumer electronics, slower in aerospace due to certification timelines | Long term (≥ 4 years) |
| Scarcity of Certified Composite Repair Technicians | -0.9% | Global, most acute in North America and Europe aerospace MRO, moderate in Asia-Pacific wind energy | Short term (≤ 2 years) |
| Lack of Harmonised Repair Codes for Subsea Composite Pipelines | -0.4% | Global offshore oil & gas regions, particularly North Sea, Gulf of Mexico, West Africa deepwater fields | Medium term (2-4 years) |
| Source: Mordor Intelligence | |||
Emergence of Self-Healing Composite Laminates
Self-healing resin systems are moving from labs to limited commercial trials. Oak Ridge National Laboratory licensed a thermoplastic healing system to automotive suppliers in 2025, enabling EV battery enclosures to self-repair micro-cracks and is forecast to cut cosmetic repair volume by up to 20% within five years. CompPair HealTech closed EUR 12 million funding in 2024 to pilot bio-inspired resins for wind-blade trailing edges, targeting a 2027 rollout. Aerospace certification will lag, but widespread adoption in automotive and wind could erode low-margin cosmetic repair demand.
Scarcity of Certified Composite Repair Technicians
Workforce shortages already constrain revenue. IACMI reported in 2025 that only 12% of U.S. community-college composite programs include FAA-recognized repair modules, and the average technician age is 54 years. Lufthansa Technik turned away USD 80 million in composite repair work in 2024 for lack of staff. EASA estimates Europe needs 3,000 additional certified technicians by 2028 but current programs graduate only 800 annually. Wage premiums in wind energy lure aerospace technicians, aggravating shortages across MRO hubs.
*Our forecasts treat driver/restraint impacts as directional, not additive. The impact forecasts reflect baseline growth, mix effects, and variable interactions.
Segment Analysis
By Material Type: CFRP Dominance Masks Aramid Acceleration
The Carbon-fibre Reinforced Polymer (CFRP) accounts for 54.69% of global revenue in 2025. Boeing 787 fuselage delamination alone generated USD 420 million in CFRP repair orders that year, underscoring the segment’s scale. Glass-fiber retains the cost-sensitive mid-market, and the U.S. Navy’s USD 28 million GFRP superstructure repair program on Arleigh Burke-class destroyers highlights its defense relevance[2]U.S. Navy, “GFRP Superstructure Life-Extension Contract,” navy.mil . Hybrid and natural-fiber systems remain niche but gain traction in infrastructure rehabilitation as environmental rules tighten.
Aramid composites occupy a swiftly growing niche. Hydrogen pipeline operators favor aramid-fibre composites that resist cryogenic embrittlement, driving a 7.85% CAGR through 2031. Ballistic-protection retrofits for military vehicles add further pull. Regulatory specificity also shapes share: FAA AC 43-214A restricts cosmetic CFRP repairs to OEM-approved materials, effectively locking lower-cost substitutes out and anchoring CFRP’s position. Taken together, CFRP keeps numerical leadership, yet aramid’s high-value opportunities and regulatory loopholes present outsized upside relative to scale.


By Product Type: Structural Repairs Command Premium Pricing
Structural generated 44.71% of 2025 value because downtime risk and certification requirements allow premiums. A composite wing-to-body fairing repair on a Boeing 777 can fetch USD 180,000, contrasting with USD 12,000 for an equivalent cosmetic fix. Semi-structural repairs, such as wind-blade trailing-edge treatments, grew as offshore turbine operators favored repair over replacement.
Cosmetic work is the fastest segment at 7.71% CAGR through 2031 but faces long-run headwinds from self-healing materials. Oak Ridge National Laboratory’s licensed thermoplastic system could trim cosmetic volumes by up to 20% inside five years. Still, near-term growth is fueled by electric-vehicle adoption: collision centers now handle CFRP battery enclosures that require certified technicians and rapid-cure epoxies. Crawford Composites developed a vacuum-infusion kit that field teams use without autoclaves, capturing semi-structural contracts across U.S. wind farms.
By Repair Process: Autoclave Growth Signals Quality Escalation
Hand lay-up produced 38.78% of 2025 revenue owing to its suitability for field work where autoclave access is limited, yet autoclave is projected to post the highest growth at an 8.15% CAGR through 2031. Lufthansa Technik’s mobile autoclave trailer demonstrates the shift toward bringing controlled cures to airport aprons, meeting EASA non-destructive testing mandates without ferry flights or component shipping. Vacuum-infusion methodologies, helped by the Technical University of Denmark’s PrintRepair 3D-mold platform, are rising in offshore wind applications where large repair areas demand precise resin-fiber ratios.
The composite repair market size for autoclave-based processes is growing as aerospace OEMs stipulate vacuum-bag consolidation for any repair covering more than 10% of a primary control surface. HAECO reports 40% margin premiums on autoclave work, prompting the firm to prioritize capital toward high-spec curing even though hand lay-up volumes rise in absolute terms. The bifurcation will likely widen: asset owners of high-liability platforms will continue to push for capital-intensive, quality-assured processes, while cost-sensitive sectors maintain reliance on field-friendly lay-up techniques.
By End-user Industry: Wind Energy Outpaces Aerospace Growth
The composite repair market size for aerospace and defense accounts for 44.22% of global revenue in 2025. Boeing’s 787 fuselage fixes alone drove USD 420 million, yet production delays capped incremental upside. Wind energy, by contrast, expanded at 7.81% through 2031 as blades exceeded 100 meters and offshore maintenance costs for depot work skyrocketed. North Sea operators spent EUR 650 million on blade repair in 2025, doubling 2023 outlays.
Automotive also accelerates as EV uptake lifts the installed base of CFRP battery enclosures. Tesla’s collision guidelines compel OEM-certified repairs, creating a captive aftermarket. Marine and construction applications round out demand: the U.S. Navy contract for GFRP superstructures and Sika’s flax-fiber bridge-repair system illustrate how defense and infrastructure budgets underpin steady, if smaller, revenue streams.

Geography Analysis
Asia-Pacific generated 38.54% of 2025 revenue for the composite repair market and is forecast to grow at 8.29% through 2031. COMAC C919 composite checks, Toray’s 20% carbon-fiber capacity expansion, and India’s 5 GW of wind-power additions in 2025 underpin multi-segment demand. HAECO’s USD 85 million Singapore repair center exemplifies regional capacity build-out, while South Korea’s frigate program embeds composite superstructures requiring long-term service infrastructure.
North America’s demand is driven by U.S. aerospace MRO concentration and wind-farm expansion across the Great Plains and Atlantic Coast. The Department of Energy’s 2024 roadmap funded mobile blade-repair training, and TD Williamson’s CAD 120 million Canadian pipeline contracts show industrial adoption beyond aerospace. Technician shortages, however, push overflow work to Mexican hubs where labor supply is more elastic though regulatory limits confine scope to non-primary structures.
Europe’s share is anchored by Lufthansa Technik’s mobile autoclave trailer and the United Kingdom’s 15 GW offshore wind capacity that produced GBP 480 million in blade repairs during 2025. Germany’s EV battery-enclosure adoption brings new collision-repair volume, and Sika’s flax-fiber system supports bridge-strengthening contracts across Germany and France. South America, the Middle East, and Africa contribute the lower share, led by Brazil’s wind build-out and Saudi pipeline retrofits that employ composite wraps for Vision 2030 infrastructure objectives.

Competitive Landscape
The top 5 firms accounted for an estimated 52% of 2025 revenue, illustrating moderate fragmentation. Hexcel’s 2024 partnership with Spain’s FIDAMC to automate wind-blade trailing-edge repairs shows materials suppliers shifting downstream to lock in recurring service income. Boeing’s USD 150 million investment in MRO partnerships across Singapore, Dubai, and Frankfurt underlines OEM intent to retain aftermarket share and mitigate production volatility. Toray mirrors the model through repair-focused joint ventures in Japan and the United States.
Specialists such as Crawford Composites and WR Composites exploit gaps in subsea-pipeline wrapping, where ISO and API standards lag and project-specific certifications provide defensible niches. Technology bifurcation deepens: aerospace and defense repairs require automated lay-up and integrated non-destructive testing systems that favor capital-rich incumbents, while wind and automotive work remains open to smaller operators leveraging hand lay-up and vacuum-infusion kits.
White-space growth avenues include mobile autoclave units for remote wind farms, integration consulting for self-healing materials, and technician-training ventures aligned with FAA and EASA curricula. Start-up activity focuses on self-healing resins; CompPair HealTech’s 2024 funding round aims to commercialize trailing-edge systems capable of reducing blade repair frequency by 30% by 2028.
Composite Repair Industry Leaders
Lufthansa Technik
3M
Henkel AG & Co. KGaA
Sika AG
Belzona International Ltd.
- *Disclaimer: Major Players sorted in no particular order

Recent Industry Developments
- January 2026: Researchers at North Carolina State University announced the development of a self-healing composite capable of repairing itself over 1,000 times. This innovation had the potential to extend the lifespan of fiber-reinforced polymers from several decades to centuries through the use of 3D-printed thermoplastic healing agents.
- January 2026: Babcock Australasia successfully trialled an advanced composite repair technology designed to reduce maintenance times and enhance fleet availability for the Royal Australian Navy and the Royal New Zealand Navy. The trials, conducted on three naval vessels, showcased the use of fibre-reinforced polymer composites as a permanent replacement for steel in in-water repairs.


Research Methodology Framework and Report Scope
Market Definitions and Key Coverage
Our study defines the composite repair market as the spending generated when damaged fiber-reinforced polymer parts, whether aircraft panels, wind-turbine blades, pipelines, or marine structures, are brought back to certified load-bearing capability through bonded patches, wraps, or scarf repairs that remain in service for at least one duty cycle. Values cover material, labor, tooling, and temporary access costs for new repair events only; retrofit strengthening, original equipment composites, and self-healing materials are outside scope.
Scope Exclusion: Routine cosmetic refinishing and unrelated civil concrete jacketing are not counted.
Segmentation Overview
- By Material Type
- Carbon-fibre Reinforced Polymer (CFRP)
- Glass-fibre Reinforced Polymer (GFRP)
- Aramid-fibre Composites
- Hybrid and Other Fibres
- By Product Type
- Structural
- Semi-structural
- Cosmetic
- By Repair Process
- Hand Lay-up
- Vacuum Infusion
- Autoclave
- Other Processes
- By End-user Industry
- Aerospace and Defense
- Wind Energy
- Automotive
- Marine
- Construction
- Other End-user Industries
- By Geography
- Asia-Pacific
- China
- Japan
- India
- South Korea
- ASEAN Countries
- Rest of Asia-Pacific
- North America
- United States
- Canada
- Mexico
- Europe
- Germany
- United Kingdom
- France
- Italy
- Spain
- NORDIC Countries
- Rest of Europe
- South America
- Brazil
- Argentina
- Rest of South America
- Middle-East and Africa
- Saudi Arabia
- South Africa
- Rest of Middle-East and Africa
- Asia-Pacific
Detailed Research Methodology and Data Validation
Primary Research
Mordor analysts interviewed MRO managers at airlines, blade-field service supervisors, and composite repair material formulators across North America, Europe, and Asia Pacific. These conversations validated repair frequency, labor-material cost shares, and the adoption curve of rapid-cure resins that secondary sources only hinted at.
Desk Research
We began with open data sets such as FAA Service Difficulty reports, EASA airworthiness directives, the US Wind Turbine Database, UN Comtrade resin and fiber trade codes, and energy output logs from IRENA. Trade-association handbooks for pipelines and class-society advisories on marine laminate failures anchored baseline incident rates. Company 10-Ks, selected investor decks, and news harvested through Dow Jones Factiva helped us benchmark typical ticket sizes. D&B Hoovers supplied revenue splits for specialist repair contractors. This list is illustrative; many additional public and paid sources were tapped for cross-checks and context.
Market-Sizing & Forecasting
A top-down incident-pool build draws on in-service fleet counts, average repair events per asset, and sampled spend per event, which are then corroborated with selective bottom-up snapshots from supplier roll-ups and channel checks. Key variables inside the model include fleet flight-cycle or operating-hour accumulation, wind-blade failure density, resin price indices, carbon-fiber import volumes, average repair labor hours, and regional technician day-rates. Forecasts use multivariate regression blended with scenario analysis; resin price elasticity, asset age mix, and policy-driven inspection intervals form the predictor set that our experts stress-test before each run. Gap handling for sparse geographies relies on regional analog substitution, followed by sanity checks against patent trends pulled through Questel.
Data Validation & Update Cycle
Outputs face variance checks against parallel metrics such as airline maintenance cost per available seat kilometer and average blade downtime. Senior reviewers sign off only after anomalies are reconciled. Reports refresh annually, while major regulatory or material-price shocks trigger interim updates; a last-mile validation pass occurs just before release.
Why Mordor's Composite Repair Baseline Deserves Buyer Confidence
Published estimates often diverge because each firm chooses its own service depth, asset pool, and inflation handling. We disclose every boundary upfront, letting decision-makers trace numbers back to observable fleets and price lines.
Key gap drivers include whether cosmetic touch-ups are blended with structural fixes, how warranty work is treated, and if aggressive technician-hour escalation is assumed.
Our annual refresh cadence captures rapidly rising wind-fleet counts, whereas some peers rely on biennial updates. Currency conversion at average yearly rates, not spot peaks, further stabilizes our view.
Benchmark comparison
| Market Size | Anonymized source | Primary gap driver |
|---|---|---|
| USD 15.34 bn (2025) | Mordor Intelligence | - |
| USD 18.60 bn (2023) | Global Consultancy A | Includes retrofit strengthening and applies constant 13 % CAGR without fleet-age weighting |
| USD 24.71 bn (2025) | Industry Source B | Counts multi-year maintenance contracts at total contract value and uses optimistic resin price freeze |
The comparison shows that once scope crevasses and pricing assumptions are aligned, the spread narrows markedly, underscoring how Mordor Intelligence offers a balanced, defensible baseline grounded in transparent variables and repeatable steps.


Key Questions Answered in the Report
What CAGR is forecast for the composite repair market between 2026 and 2031?
The market is expected to register a 6.85% CAGR, rising from USD 16.39 billion in 2026 to USD 22.82 billion by 2031.
Which region is projected to grow fastest in composite repair services?
Asia-Pacific leads with an 8.29% forecast CAGR, driven by expanding aviation fleets and offshore wind capacity.
Why are autoclave-based repairs gaining share?
Regulatory requirements and higher quality assurance in aerospace are pushing operators toward autoclave curing despite greater capital cost, resulting in an 8.15% forecast CAGR through 2031 for the process.
How will self-healing composites affect repair demand?
Commercialization of self-healing laminates could cut cosmetic repair volume by up to 20% within five years, especially in automotive and wind-energy segments.
Page last updated on:


