
Oil Shale Market Size and Share
Market Overview
| Study Period | 2021 - 2031 |
|---|---|
| Market Size (2026) | USD 3.95 Billion |
| Market Size (2031) | USD 5.25 Billion |
| Growth Rate (2026 - 2031) | 5.82 % |
| Fastest Growing Market | Asia-Pacific |
| Largest Market | North America |
| Market Concentration | Low |
Major Players *Disclaimer: Major Players sorted in no particular order Image © Mordor Intelligence. Reuse requires attribution under CC BY 4.0. | |
Oil Shale Market Analysis by Mordor Intelligence
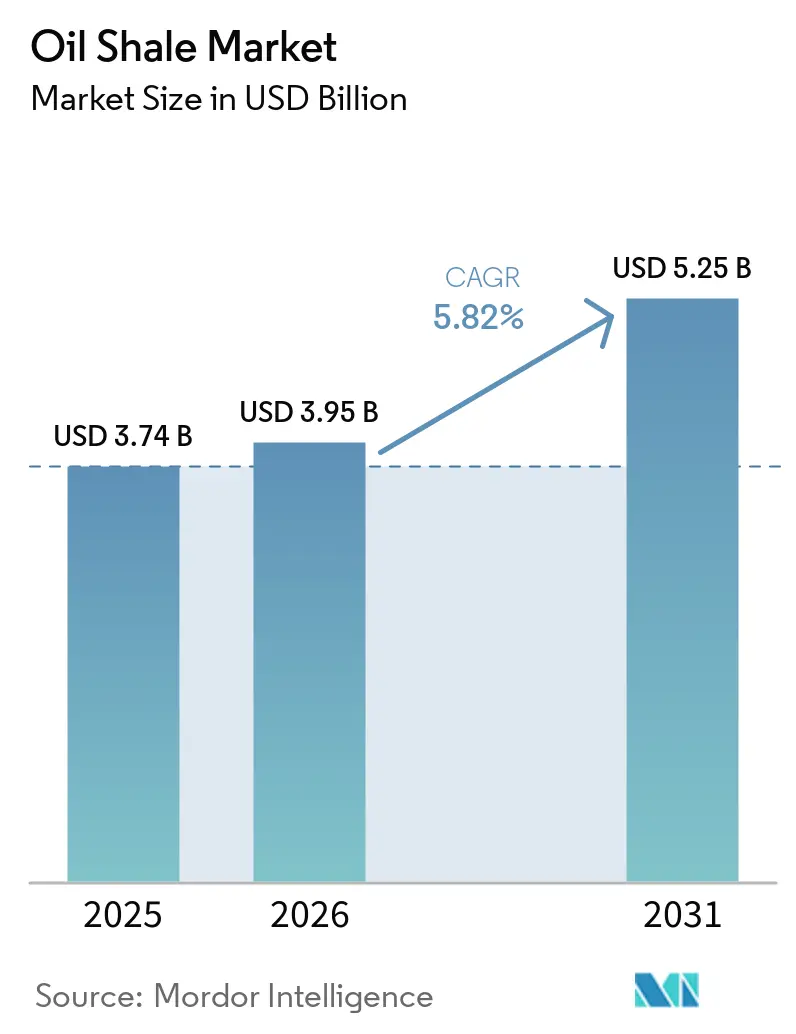
The oil shale market size is projected to expand from USD 3.74 billion in 2025 and USD 3.95 billion in 2026 to USD 5.25 billion by 2031, at a CAGR of 5.8% between 2026 and 2031. The oil shale market is supported by national efforts to reduce exposure to imported energy supplies. China, Jordan, and the United States treat domestic kerogen resources as part of their energy-security planning rather than only as conventional upstream investments.[1] This approach can support projects even when greenfield production costs remain difficult to match with conventional crude benchmarks.[2] Technology improvements in retorting and in-situ conversion are widening the range of products and reducing some operating constraints. The oil shale market also faces a clear regional split, with expansion centered in Asia-Pacific and the Middle East while European producers face tighter carbon-cost conditions. Regional diversification will remain important for the oil shale market through 2031.
Key Report Takeaways
- By process, extraction held 52.3% of revenue in 2025, while retorting is projected to record the highest CAGR at 6.9% through 2031.
- By product, diesel held 35.6% of revenue in 2025 and is projected to record the highest CAGR at 7.1% through 2031.
- By end user, energy and utilities held 39.5% of demand in 2025, while automotive and transportation are projected to record the highest CAGR at 6.3% through 2031.
- By geography, North America held 39.2% of revenue in 2025, while Asia-Pacific is projected to record the highest CAGR at 7.9% through 2031.
Note: Market size and forecast figures in this report are generated using Mordor Intelligence’s proprietary estimation framework, updated with the latest available data and insights as of January 2026.
Global Oil Shale Market Trends and Insights
Drivers Impact Analysis*
| Driver | (~) % Impact on CAGR Forecast | Geographic Relevance | Impact Timeline |
|---|---|---|---|
| Energy Security and Import-Dependence Reduction | +2.0% | Global, most acute in North America, the Middle East, and Asia-Pacific | Medium term (2-4 years) |
| Advancements in Retorting and In-Situ Conversion Technologies | +1.5% | Global, with research concentrated in China, the United States, and Estonia | Long term (≥ 4 years) |
| Alternative Liquid-Fuel and Chemical Feedstock Demand | +1.0% | Asia-Pacific, with spillover to North America and the Middle East and Africa | Medium term (2-4 years) |
| Government-Backed Domestic Unconventional Resource Development | +0.8% | North America, the Middle East, and Asia-Pacific | Short term (≤ 2 years) |
| Lower-Disturbance In-Situ Conversion Commercialization | +0.6% | China, the United States, and Jordan | Long term (≥ 4 years) |
| Oil Shale By-Product Use in Industrial Materials | +0.3% | Estonia, China, and Jordan | Medium term (2-4 years) |
| Source: Mordor Intelligence | |||
Energy Security and Import-Dependence Reduction
Energy security is a central reason for public support for the oil shale market and shapes the oil shale market investment case. Governments in Jordan, China, and the United States have considered oil shale as a domestic resource that can reduce reliance on imported supplies. This policy rationale differs from a project decision based only on prevailing crude prices. Section 15927 of U.S. law describes oil shale as a strategic unconventional fuel and calls for coordinated federal and private development. Jordan’s Attarat plant accounted for 16.7% of National Electric Power Company electricity purchases in 2025, compared with 16% in 2024. Local supply can reduce exposure to port closures, transport disruption, and changes in fuel-import costs for countries with limited domestic hydrocarbons.
Advancements in Retorting and In-Situ Conversion Technologies
Technical development is changing the operating options available to the oil shale market. A 2025 review described methods that include Shell’s in-situ conversion process, ExxonMobil’s Electrofrac approach, and Geothermic Fuel Cell technology.[3] Shell’s process uses freeze-wall wells to isolate the reservoir during underground heating, while Electrofrac uses an electrically heated body in fractured rock. Research presented in 2026 found that a reverse in-situ pyrolysis design increased oil recovery by more than 10% and improved energy efficiency by more than 60% against a conventional electric-heating design.[4] Separate 2026 research found that optimized gas-injection conditions could cut compression-energy use by 90% and carbon dioxide output by 48% in late-production phases. These changes matter because in-situ methods can limit surface disturbance and may improve permitting conditions where land impacts are a concern.
Rising Demand for Alternative Liquid-Fuel and Chemical Feedstocks
The oil shale market has uses beyond transport-fuel production. U.S. Department of Energy work identified pyridines, phenols, sulfides, and thiophenes in shale-derived streams as potential inputs for products such as agrochemicals, pharmaceuticals, surfactants, and solvents. A 2026 study reported a process that converted crude oil shale into battery-grade graphitic carbon while producing carbon-dioxide-free hydrogen. Enefit 280-2, which entered service in September 2026, produces shale oil for use in low-sulfur marine-fuel blends. These outlets give producers product choices that do not depend entirely on diesel or gasoline sales. Chemical and marine applications can also provide a different demand base from passenger-road fuels.
Government-Backed Development of Domestic Unconventional Resources
Government programs are shortening the path from resource assessment to development in several oil shale market locations. U.S. Secretarial Order 3417 directed the U.S. Geological Survey to update assessments of technically recoverable resources on federal onshore lands. China’s National Energy Administration reported that shale oil output exceeded 8.5 million tons in 2025. The Shengli Jiyang zone reached 700,000 tons of annual output one year ahead of schedule, according to the source material supplied for this report. Jordan’s Ministry of Energy and Mineral Resources places national oil shale reserves at 40-70 billion tons across 18 known sites. Public support for mine permits, transmission links, and grid connections can reduce risks that have historically limited private project finance.
Restraints Impact Analysis*
| Restraint | (~) % Impact on CAGR Forecast | Geographic Relevance | Impact Timeline |
|---|---|---|---|
| High Capital Intensity and Uncompetitive Production Costs | -2.5% | Global, most acute in North America and Europe | Short term (≤ 2 years) |
| Carbon Pricing, Emissions Regulation and Financing Constraints | -1.4% | Europe, with spillover to institutional investors globally | Medium term (2-4 years) |
| Water-Security Limits in Resource Regions | -0.8% | North America, the Middle East, and Central Asia | Long term (≥ 4 years) |
| Project-Specific Social License and Reclamation Liability | -0.4% | North America and Europe | Medium term (2-4 years) |
| Source: Mordor Intelligence | |||
High Capital Intensity and Uncompetitive Production Costs
High capital needs remain an immediate constraint on the oil shale market. University of Utah cost modeling placed supply costs at USD 97 per barrel for high-grade formations and USD 124 per barrel for lower-grade formations. The same work placed total depreciable capital for an air-fired commercial-scale plant at USD 3.3 billion to USD 3.4 billion. A Department of Energy archived engineering study reported capital costs above USD 80 million for a 2,000-barrel-per-day retorting facility, before licensing and royalty fees. Eesti Energia stated in 2026 that production-unit cost is the critical factor for global competitiveness. The narrow cost window makes projects sensitive to both crude pricing and added carbon costs.
Carbon Pricing, Emissions Regulation and Financing Constraints
Carbon rules and restricted capital access are structural constraints for the oil shale market, especially in Europe. The European Commission published benchmark information for the 2026-2030 period and announced a EUR 30 billion ETS Investment Booster in May 2026, stated in the supplied material as USD 33 billion. Eesti Energia and VKG warned that the revisions could make European oil shale production unviable between 2031 and 2033. Amundi’s oil and gas policy excludes issuers with more than 30% of revenue from unconventional fossil fuels, including oil shale. Water availability in the Colorado River Basin and comparable resource areas may limit the scale of future processing. Reclamation obligations and local acceptance also affect project timing where mining or surface facilities are planned.
*Our forecasts treat driver/restraint impacts as directional, not additive. The impact forecasts reflect baseline growth, mix effects, and variable interactions.
Segment Analysis
By Process: Retorting Gains Ground on Commercial Scale-Up
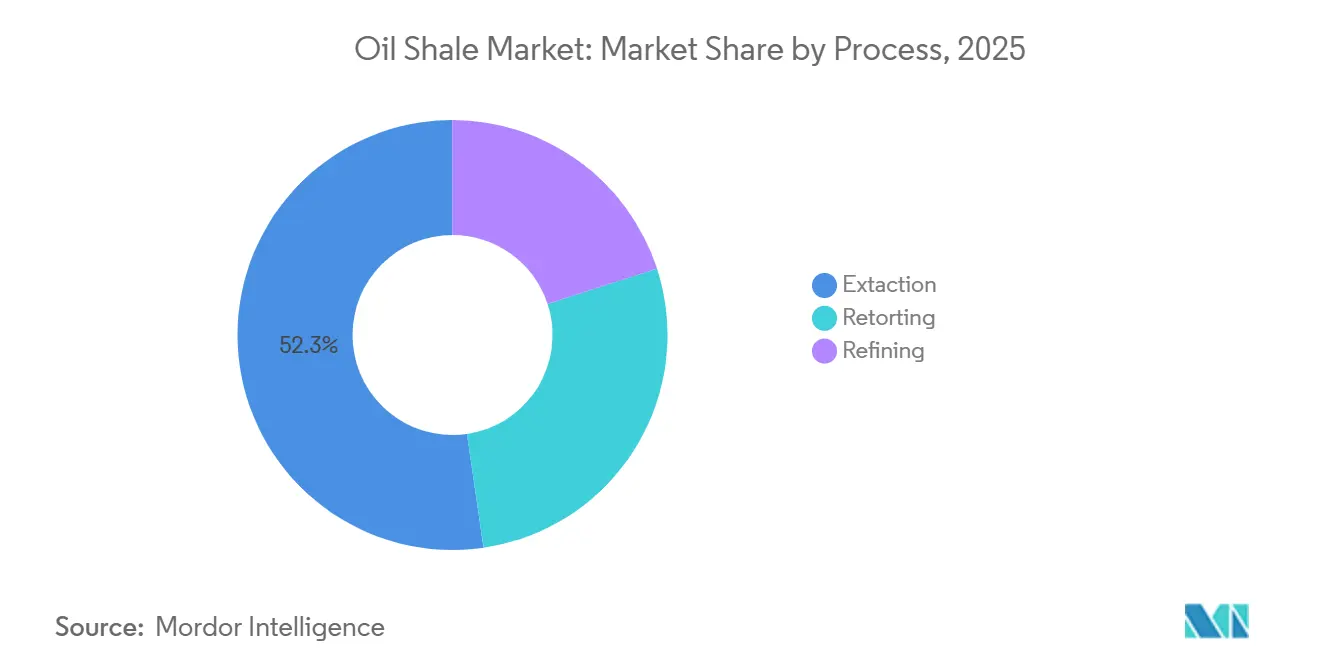
Extraction held 52.3% of process revenue in 2025, giving it the largest oil shale market share within this segmentation. Its position reflects commercial surface mining in Estonia and China’s Fushun Basin. Retorting is forecast to grow at a 6.9% CAGR through 2031, the highest process rate. It includes established ex-situ pyrolysis systems and newer in-situ pilot approaches. A March 2026 study reported that H-ATS autothermic conversion achieved an energy recovery ratio of 14.80 under optimized conditions.
The same study reported a 132% improvement compared with constant-rate injection. Refining remained the smallest process category by revenue in 2025 but upgraded shale oil into low-sulfur marine fuel, clean diesel, and specialty fractions. Enefit 280-2 entered service in Auvere in September 2026 with a capacity of 268,000 tonnes of oil per year. The facility costs more than EUR 380 million, stated in the supplied material as USD 418 million at 2026 average exchange rates. Research found that Dagong retorting reduced exergy destruction from 65.7% to 38.6% compared with Fushun processing.

By Product: Diesel Leads as Feedstock Options Expand
Diesel held 35.6% of product revenue in 2025 and accounted for the largest product position in the oil shale market size. It is also forecast to expand at a 7.1% CAGR through 2031. Freight transport, industrial operations, and power generation support middle-distillate demand in Asia-Pacific. Retorted shale oil naturally yields a large middle-distillate fraction. Gasoline was the second-largest product category, but sulfur and wax content require further hydro processing for passenger-car specifications.
LPG and kerosene supplied a smaller but stable base for industrial and residential heating. The Others category includes chemical-feedstock streams, marine-fuel blend stocks, and specialty derivatives. A 2025 study found that heat-treated oil shale semi-coke had measurable pozzolanic activity as a supplementary cementitious material. A 2026 ACS study reported graphitic-carbon anodes with 349 mAh·g⁻¹ capacity and more than 99.5% retention after 500 cycles. These applications support a less fuel-dependent product mix over time for the oil shale industry.
By End User: Energy and Utilities Anchors Demand, Automotive Accelerates
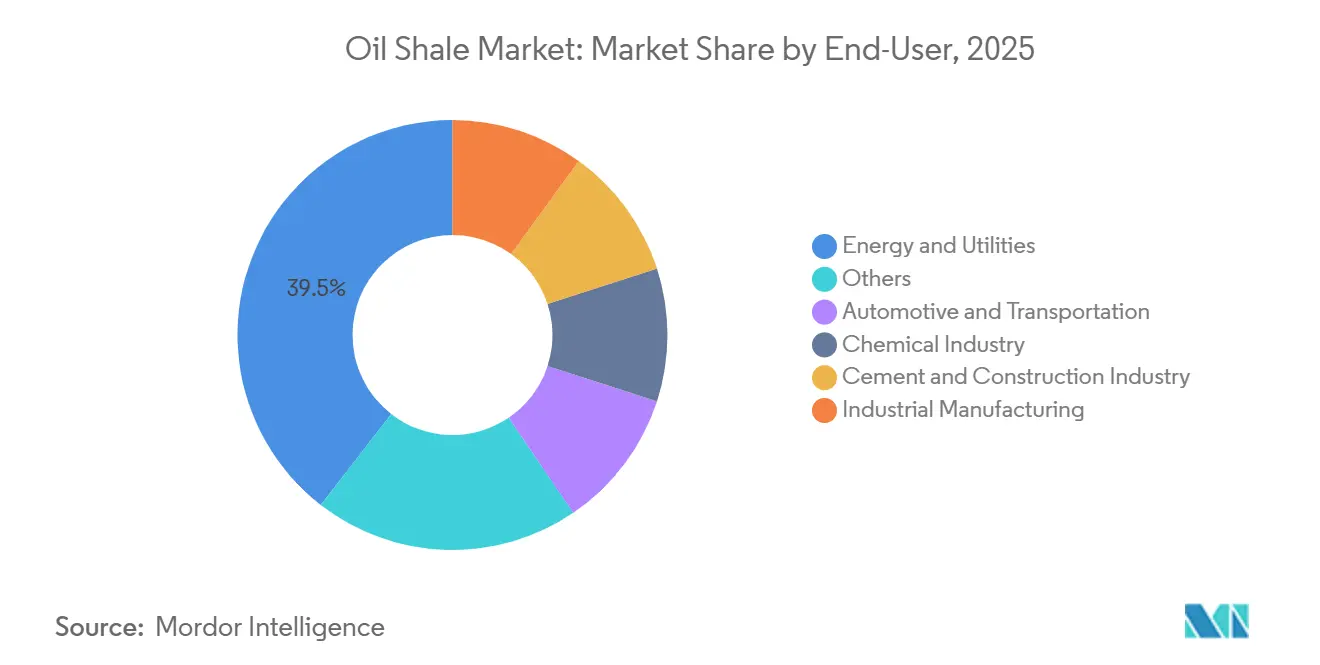
Energy and utilities held 39.5% of end-user demand in 2025, the largest end-user position in the oil shale market. Estonia and Jordan have the deepest commercial use of oil shale as a power-generation feedstock. Attarat is a USD 2.1 billion facility with 470 MW net capacity. It supplied 16.7% of National Electric Power Company electricity purchases in 2025. Automotive and transportation are forecast to grow at a 6.3% CAGR through 2031.
The chemical industry uses shale-derived inputs in plastics, solvents, agrochemicals, and petrochemicals, making demand less dependent on passenger-fuel consumption than diesel and gasoline. A 2026 study found that oil shale ash replacing 50% of ordinary Portland cement exceeded 33.5 MPa after 90 days. Cement and construction are therefore emerging end uses for processing residues, while industrial manufacturing and other categories include niche applications such as hydrogen co-production from in-situ processes.
Geography Analysis
North America held 39.2% of global revenue in 2025 and represented the largest regional oil shale market share. The U.S. Geological Survey estimated 1.5 trillion barrels of in-place oil resource in the Green River Formation’s Piceance Basin. Federal policy under 42 U.S.C. § 15927 and Secretary's Order 3417 support resource assessment. Output remains limited by USD 97-124 per barrel greenfield costs, water constraints, Canada’s oil-sands focus, and Mexico’s exploratory position.
Europe combines Estonia’s established production base with increasing carbon-policy pressure. Estonia mined just over 8 million metric tons in 2025, continuing a 3-year decline, and VKG became its largest miner. Enefit 280-2 opened in September 2026 with 268,000 tonnes of annual capacity, showing ongoing investment despite EU ETS risk. Poland’s resources remain undeveloped, while Russia’s Volga-Ural shale area is inactive under current market and sanctions conditions.
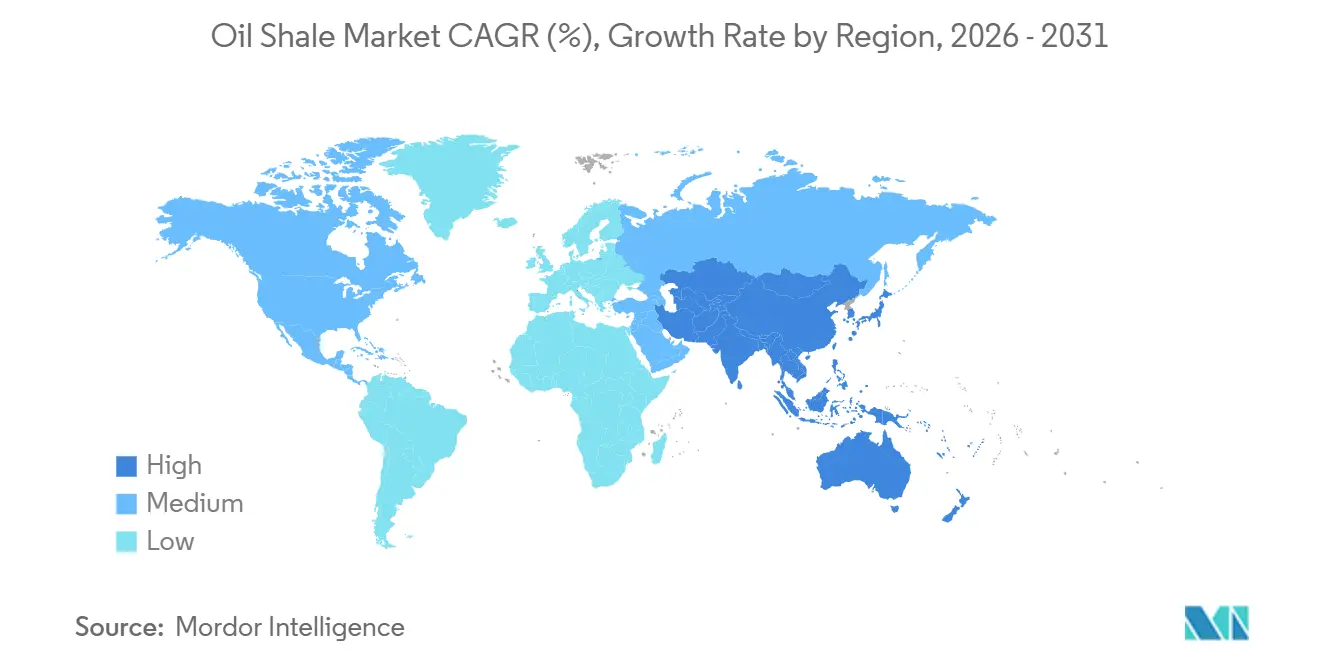
Asia-Pacific is forecast to expand at a 7.9% CAGR through 2031, the fastest regional rate for the oil shale market size. China’s state-directed development is the main driver. National shale oil output exceeded 8.5 million tons in 2025, a substantial increase. Sinopec reported more than 2 million tons of cumulative Shengli Jiyang output by May 2026. Australia has documented resources through Queensland Energy Resources, while Petrobras operates the Petrosix surface-retorting process in Brazil. Jordan leads the Middle East and Africa with 40-70 billion tons across 18 sites covering more than 60% of national territory, and Attarat supplied 16.7% of electricity purchases in 2025.
Competitive Landscape
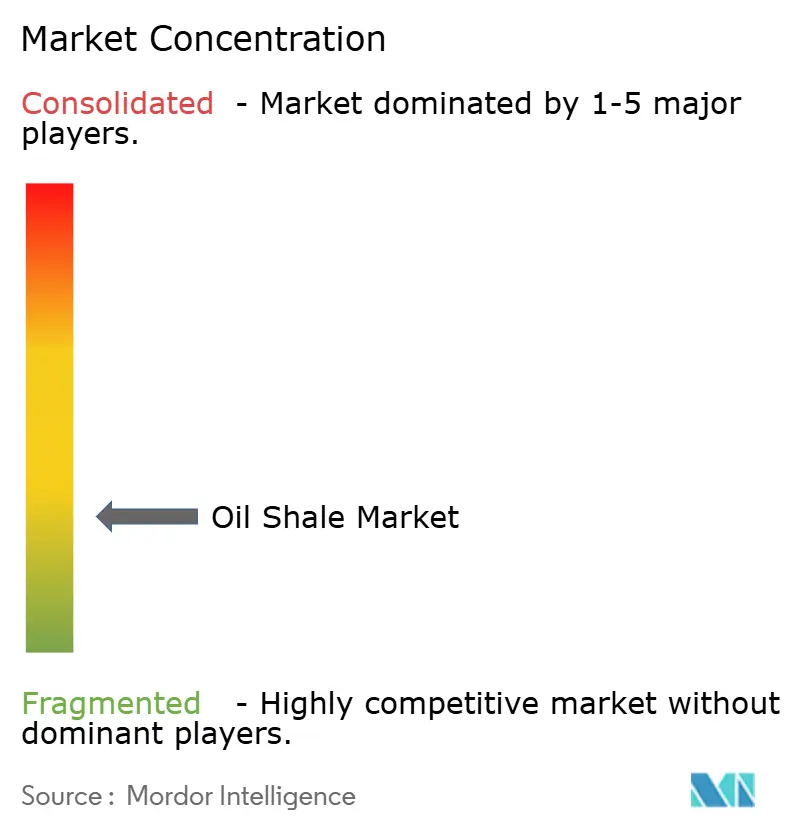
The oil shale market is fragmented and has a concentrated production core and a wider group of technology and exploration participants. Eesti Energia and VKG produce nearly all commercially traded shale oil, based on the supplied research. VKG acquired the Uus-Kiviõli mining permit from Eesti Energia for EUR 15 million (USD 16.5 million) in 2025. The transfer tripled VKG’s reserve base and secured supply through 2058. Chinese production is led by state-linked operators, including Sinopec in Shengli, PetroChina in Ordos, and Fushun Mining Group in northeast China.
Companies compete through technology, resource security, and product upgrading. Shell holds a technology position through its proprietary in-situ conversion process. Eesti Energia opened Enefit 280-2 in September 2026 with 268,000 tons of annual capacity. VKG strengthened resource security through its Uus-Kiviõli permit purchase in 2025. Sinopec’s Shengli Jiyang development exceeded two million tons of cumulative production by May 2026.
Technology licensing, by-product use, and in-situ commercialization create opportunities in the oil shale market and for the oil shale market supply chain. Oil shale ash can meet structural-strength requirements at 50% cement replacement under an optimized formulation. Research on hydrogen co-production and battery-anode carbon adds further technical pathways.
Oil Shale Industry Leaders
-
Eesti Energia AS
-
Viru Keemia Grupp AS
-
PetroChina Company Limited
-
China Petroleum and Chemical Corporation
-
Petróleo Brasileiro S.A.
- *Disclaimer: Major Players sorted in no particular order
Recent Industry Developments
- August 2026: Eesti Energia launched the Enefit 280-2 shale oil retorting plant in Auvere, Estonia, with capital spending of more than EUR 380 million, stated in the supplied material as USD 418 million. The facility can produce 268,000 tons of oil annually and primarily supplies shale oil as a blend stock for low-sulfur marine fuel.
- May 2026: Sinopec announced that cumulative production from the Shengli Jiyang National Shale Oil Demonstration Zone in Shandong Province exceeded two million tons, with fifty-nine oil wells recording peak daily output exceeding one hundred tons and the highest single-well daily production reaching 263 tons.
- April 2026: Viru Keemia Grupp (VKG) purchased the remaining mining permit for the Uus-Kiviõli oil shale mining field from state-owned Eesti Energia for EUR 15 million (approximately USD 16.5 million), as confirmed by VKG's leadership.
- April 2026: Jordan's Attarat oil shale power plant increased its share of National Electric Power Company electricity purchases to 16.7% in 2025, up from 16% in 2024. This represented 23,414 GWh of electricity and reflected the continued ramp-up of shale's role in Jordan's national energy mix.
Global Oil Shale Market Report Scope
Oil shale is an organic-rich, fine-grained sedimentary rock containing kerogen, from which liquid hydrocarbons can be produced. The oil shale market encompasses global activities involved in the exploration, mining, extraction, processing, and sale of oil shale resources.
The global oil shale market is segmented into process, product, end-user, and geography. By process, the market is segmented into extraction, retorting, and refining. By product, the market is divided among diesel, gasoline, liquefied petroleum gas, kerosene, and others. By end-user, the market is segmented into energy and utilities, automotive and transportation, chemical industry, cement and construction industry, industrial manufacturing, and others. The report also covers the market size and forecasts for the global oil shale market across 26 countries in key regions. For each segment, the market sizing and forecasts have been provided on the basis of value (USD).
| Extaction |
| Retorting |
| Refining |
| Diesel |
| Gasoline |
| Liquid Petroleum Gas |
| Kerosene |
| Others |
| Energy and Utilities |
| Automotive and Transportation |
| Chemical Industry |
| Cement and Construction Industry |
| Industrial Manufacturing |
| Others |
| North America | United States |
| Canada | |
| Mexico | |
| Europe | Germany |
| France | |
| Italy | |
| Spain | |
| United Kingdom | |
| Poland | |
| Russia | |
| Rest of Europe | |
| Asia-Pacific | China |
| India | |
| Japan | |
| South Korea | |
| Australia | |
| Indonesia | |
| Vietnam | |
| Thailand | |
| Rest of Asia-Pacific | |
| South America | Brazil |
| Argentina | |
| Chile | |
| Rest of South America | |
| Middle East and Africa | Saudi Arabia |
| United Arab Emirates | |
| Egypt | |
| South Africa | |
| Morocco | |
| Rest of Middle East and Africa |
| By Process | Extaction | |
| Retorting | ||
| Refining | ||
| By Product | Diesel | |
| Gasoline | ||
| Liquid Petroleum Gas | ||
| Kerosene | ||
| Others | ||
| By End User | Energy and Utilities | |
| Automotive and Transportation | ||
| Chemical Industry | ||
| Cement and Construction Industry | ||
| Industrial Manufacturing | ||
| Others | ||
| By Geography | North America | United States |
| Canada | ||
| Mexico | ||
| Europe | Germany | |
| France | ||
| Italy | ||
| Spain | ||
| United Kingdom | ||
| Poland | ||
| Russia | ||
| Rest of Europe | ||
| Asia-Pacific | China | |
| India | ||
| Japan | ||
| South Korea | ||
| Australia | ||
| Indonesia | ||
| Vietnam | ||
| Thailand | ||
| Rest of Asia-Pacific | ||
| South America | Brazil | |
| Argentina | ||
| Chile | ||
| Rest of South America | ||
| Middle East and Africa | Saudi Arabia | |
| United Arab Emirates | ||
| Egypt | ||
| South Africa | ||
| Morocco | ||
| Rest of Middle East and Africa | ||
Key Questions Answered in the Report
What is the projected value of the oil shale market by 2031?
The oil shale market is projected to reach USD 5.25 billion by 2031, growing at a 5.82% CAGR from 2026.
Which process is growing fastest through 2031?
Retorting is projected to record the highest process CAGR at 6.9% through 2031.
Which oil shale product leads revenue?
Diesel led product revenue with a 35.6% share in 2025 and is projected to grow at a 7.1% CAGR.
Which region has the highest forecast growth?
Asia-Pacific is forecast to grow at a 7.9% CAGR through 2031, supported mainly by China's shale oil scale-up.
Why is oil shale important to Jordan's energy system?
Attarat accounted for 16.7% of National Electric Power Company electricity purchases in 2025 and reduces reliance on imported fuel supplies.
What are the main constraints on development?
High capital costs, carbon pricing, financing limits, water constraints, and reclamation obligations constrain new development.