
Oats Market Size and Share
Market Overview
| Study Period | 2021 - 2031 |
|---|---|
| Market Size (2026) | USD 4.5 Billion |
| Market Size (2031) | USD 6.15 Billion |
| Growth Rate (2026 - 2031) | 6.43 % |
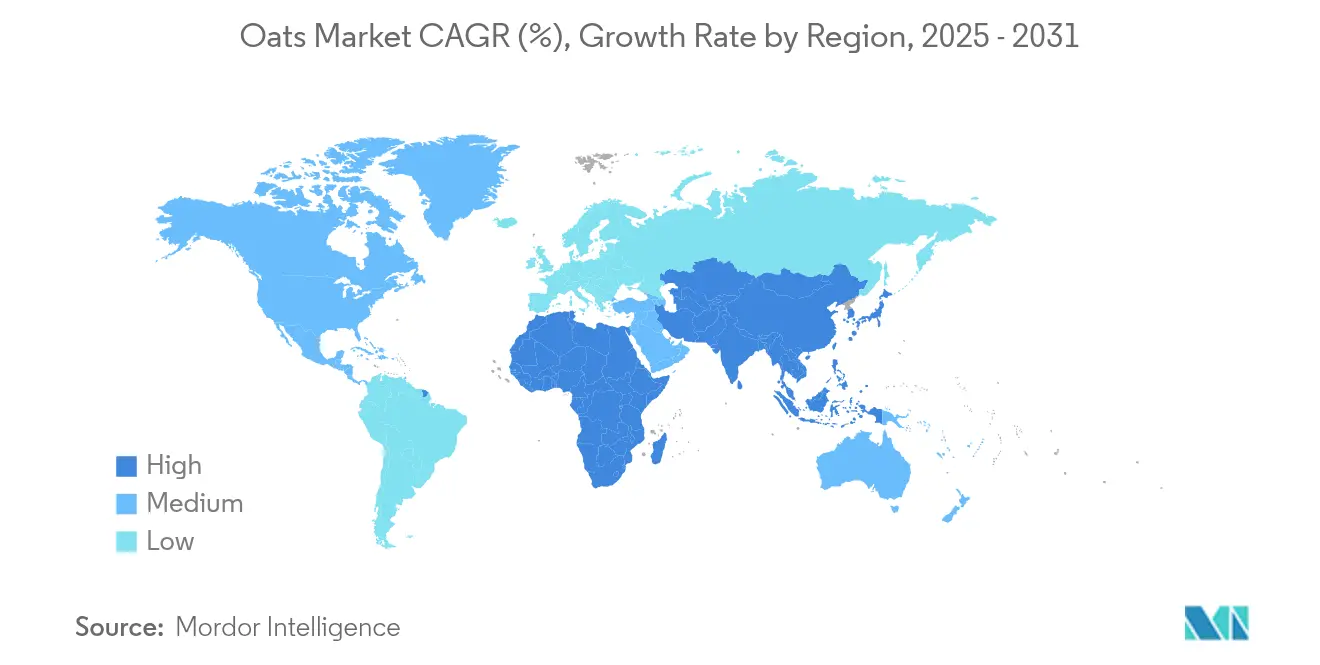
| Fastest Growing Market | Asia-Pacific |
| Largest Market | North America |
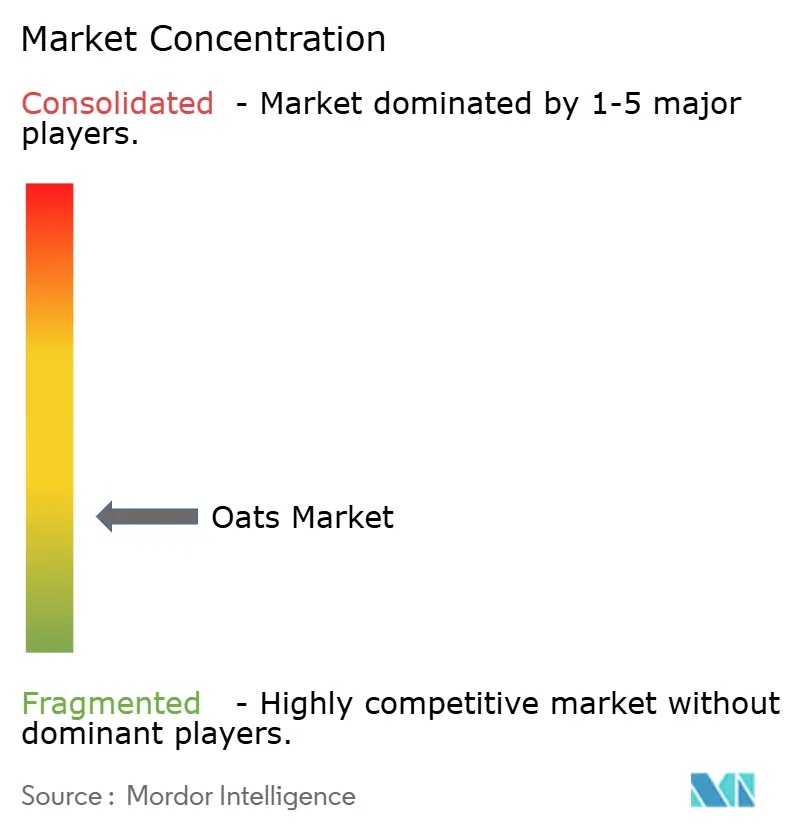
| Market Concentration | Low |
Major Players
*Disclaimer: Major Players sorted in no particular order Image © Mordor Intelligence. Reuse requires attribution under CC BY 4.0. |
|
Oats Market Analysis by Mordor Intelligence
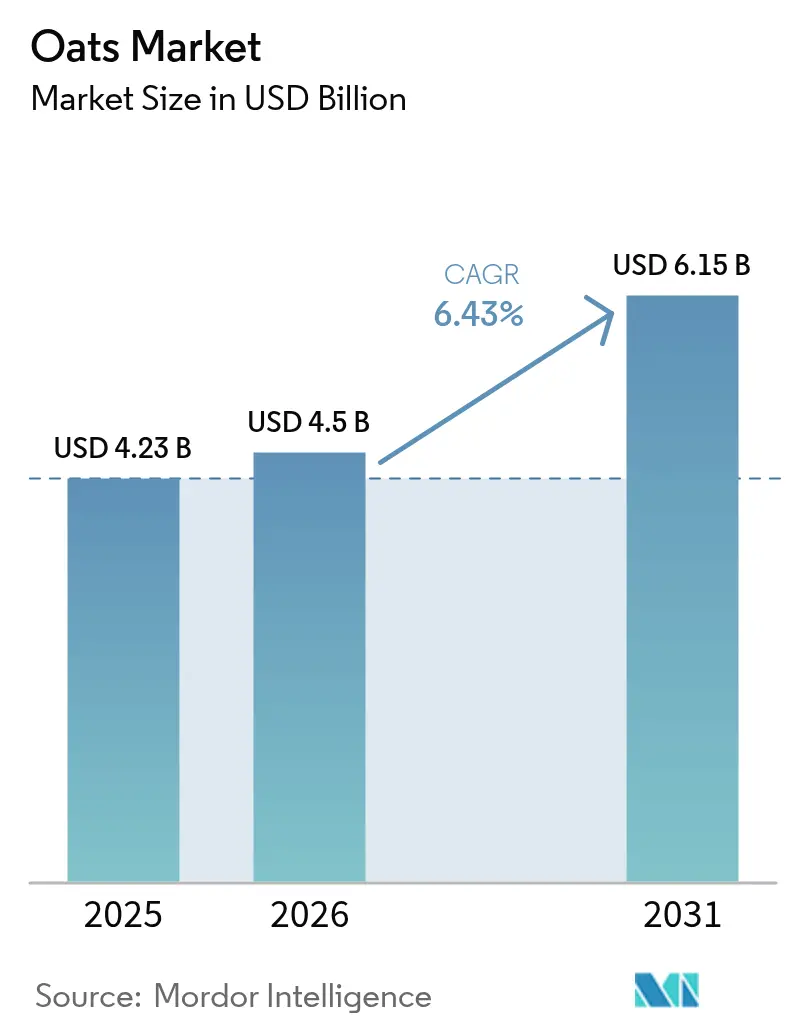
The Oats market size is expected to grow from USD 4.23 billion in 2025 to USD 4.5 billion in 2026 and is forecast to reach USD 6.15 billion by 2031 at 6.43% CAGR over 2026-2031. This growth is primarily driven by increasing consumer demand for nutrient-dense, gluten-free grains, supported by regulatory clarity from the U.S. Food and Drug Administration (FDA) on the ≤ 20 ppm gluten threshold for food labeling. This regulation enables manufacturers to confidently address the needs of celiac and gluten-sensitive consumers, further strengthening market opportunities. North America continues to exhibit steady growth, underpinned by well-established breakfast cereal consumption habits. However, the Asia-Pacific region is emerging as the fastest-growing market, fueled by rising health awareness among urban middle-class households and a shift toward healthier dietary choices. Innovations in oat processing, which enhance shelf life while preserving taste and nutritional value, are facilitating the introduction of premium products. Additionally, the rapid expansion of online grocery platforms is reducing entry barriers for new and emerging brands, allowing them to target niche consumer segments with unique value propositions. Despite these positive trends, climate-induced yield volatility poses a significant challenge to the market. To mitigate this risk, companies are increasingly diversifying their sourcing strategies and investing in resilient supply chains to ensure consistent production and supply. These efforts are expected to play a crucial role in sustaining market growth during the forecast period.
Key Report Takeaways
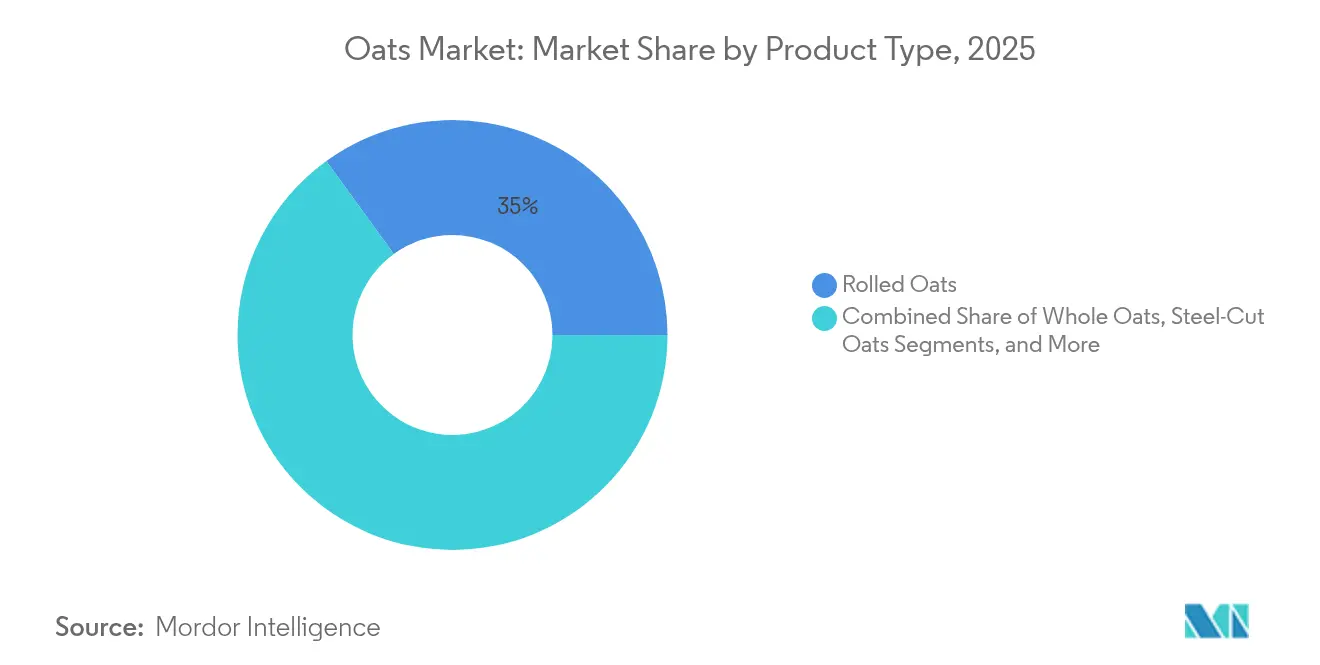
- By product type, rolled oats led with 34.98% of oats market share in 2025; oat flour is on track for the fastest 9.22% CAGR through 2031.
- By category, processed oats accounted for 71.55% of revenue in 2025, while the same segment is projected to compound at 7.38% annually to 2031.
- By nature, conventional oats commanded 67.92% of oats market size in 2025, and organic variants are expanding at a resilient 4.48% CAGR.
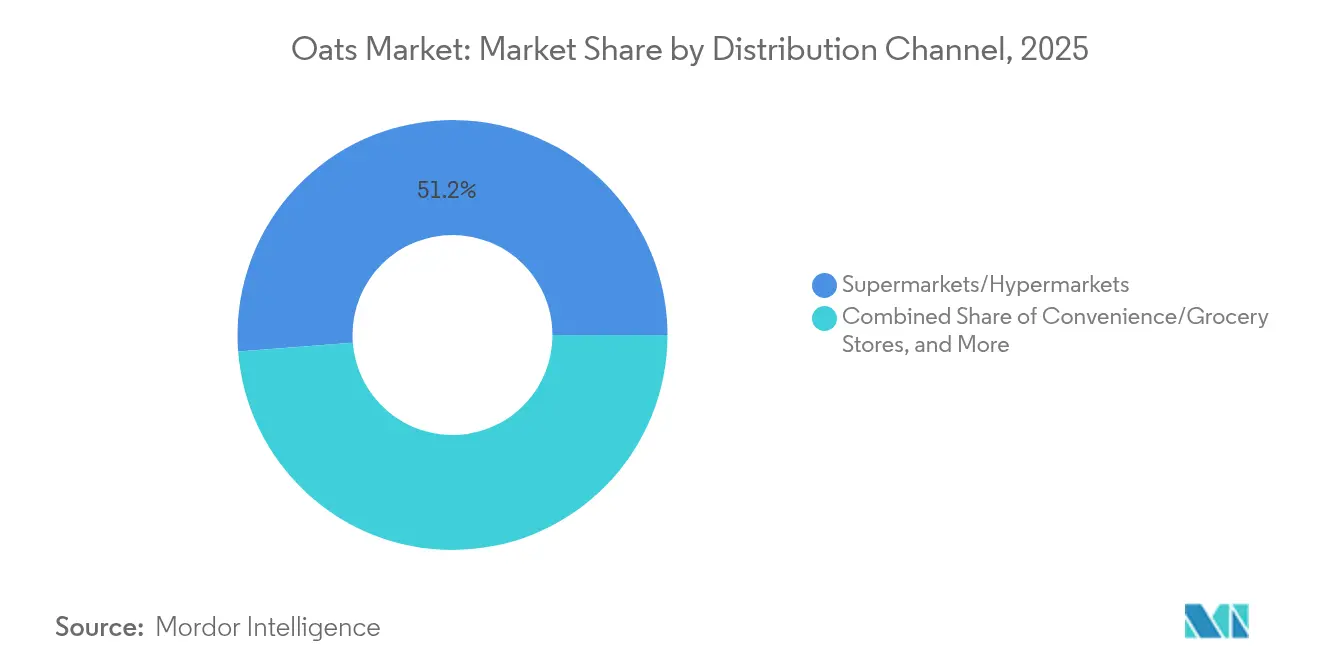
- By distribution channel, supermarkets and hypermarkets held 51.22% of Oats market share in 2025 as online retail accelerates at a 10.18% CAGR through 2031.
- By geography, North America captured 34.31% revenue in 2025 and Asia-Pacific is projected to grow the fastest at 8.05% CAGR through 2031.
Note: Market size and forecast figures in this report are generated using Mordor Intelligence’s proprietary estimation framework, updated with the latest available data and insights as of 2026.
Market Trends and Insights
Drivers Impact Analysis of Oats Market*
| Drivers | (~) % Impact on CAGR Forecast | Geographic Relevance | Impact Timeline |
|---|---|---|---|
| Increasing consumer preference for nutritious and gluten-free food options | +1.2% | Global, with strongest impact in North America and Europe | Medium term (2-4 years) |
| Expansion of clean-label trends promoting minimally processed oat products | +0.8% | North America and Europe core, spill-over to Asia-Pacific | Long term (≥ 4 years) |
| Enhanced convenience through ready-to-cook product offerings | +0.9% | Global, with early gains in urban centers | Short term (≤ 2 years) |
| Increasing adoption of oats in weight management and fitness diets | +0.7% | Asia-Pacific core, North America secondary | Medium term (2-4 years) |
| Rising consumer willingness to pay premium for organic and non-GMO oat products | +0.6% | North America and Europe primary, selective Asia-Pacific markets | Long term (≥ 4 years) |
| Growth in online retail channels enhancing oats product accessibility | +1.1% | Global, with accelerated adoption in Asia-Pacific | Short term (≤ 2 years) |
| Source: Mordor Intelligence | |||
Increasing Consumer Preference for Nutritious and Gluten-Free Food Options Drives Growth
The regulatory framework supporting gluten-free oats has generated an annual health benefit valued at USD 110 million, as per an FDA impact analysis. This benefit stems from reduced search costs for individuals with celiac disease and an expanded range of dietary options for the approximately 1% of the population affected by this condition[1]Source: Food and Drug Administration, "Food Labeling; Gluten-Free Labeling of Foods", www.fda.gov. By establishing clear guidelines, the framework allows food manufacturers to confidently label oats as gluten-free when they meet the 20 ppm threshold, resolving prior uncertainties that hindered market growth. Additionally, the U.S. Department of Agriculture (USDA) inclusion of various whole grains, including oats, in its WIC program highlights institutional support for oat consumption. This initiative provides participants with access to a wider selection of nutritious food options, positioning oats as a naturally gluten-free alternative. In response to these developments, companies have introduced specialized product lines designed for celiac disease patients and gluten-sensitive consumers. These products comply with FDA standards through stringent certification and testing protocols, ensuring safety and quality. The combination of regulatory clarity and growing consumer health awareness has created sustainable demand drivers for gluten-free oats. This demand extends beyond temporary dietary trends, firmly establishing oats as a gluten-free food product and reinforcing their long-term relevance in the industry.
Expansion of Clean-Label Trends Promoting Minimally Processed Oat Products.
Clean-label positioning has become a critical strategic differentiator as consumers increasingly scrutinize ingredient lists and demand transparency. The USDA's Summer Food Service Program guidelines emphasize the incorporation of whole grains, such as oats, into meal planning strategies that prioritize minimally processed foods. This shift particularly benefits steel-cut and whole oat products, which undergo less processing compared to instant varieties, aligning with consumer preferences for authenticity, nutritional integrity, and clean-label attributes. Furthermore, the clean-label movement intersects with organic certification requirements, creating opportunities for manufacturers to command premium pricing by demonstrating both minimal processing and sustainable sourcing practices. Advanced food preservation technologies further support this trend by extending shelf life while preserving nutritional quality, meeting consumer expectations for convenience and health benefits without compromising clean-label standards. Companies that effectively address these dual demands are well-positioned to capture a growing segment of consumers willing to pay a premium for products that align with their values of health, transparency, and environmental stewardship.
Enhanced Convenience Through Ready-To-Cook Product Offerings Increases Viability
The convenience food segment has witnessed significant structural growth, driven by the need for convenient whole grain options tailored to busy lifestyles while maintaining nutritional integrity. This trend has enabled oat processors to innovate and introduce value-added products that not only meet consumer demand for time-saving solutions but also generate higher profit margins. Advances in food preservation technologies, such as high-pressure processing and pulsed electric fields, have further supported this shift by extending product shelf life without compromising nutritional quality. These innovations address the dual consumer priorities of convenience and health. Additionally, a recent United States House of Representatives hearing highlighted critical challenges in the food supply chain, including workforce shortages and transportation inefficiencies. These challenges create opportunities for ready-to-cook oat products that require minimal preparation infrastructure, offering a practical solution to industry constraints. The intersection of convenience and nutrition presents manufacturers with the potential to develop premium-positioned products that command higher price points by delivering enhanced functionality, extended shelf life, and ease of preparation.
Increasing Adoption of Oats in Weight Management and Fitness Diets.
The growing adoption of oats in weight management and fitness diets is attributed to their nutritional benefits, particularly their high soluble fiber content, including beta-glucan. Beta-glucan slows gastric emptying, enhances satiety, and regulates appetite hormones such as leptin and peptide YY, which collectively contribute to reduced calorie intake and improved appetite control. Additionally, oats have a low glycemic index, promoting stable blood sugar levels and preventing energy crashes and cravings. Their protein content further supports muscle maintenance, which is essential during weight loss and fitness regimens. Clinical studies from National Institutes of Helath (NIH) consistently demonstrate that regular oat consumption positively impacts key health metrics, including BMI, waist circumference, lipid profiles, and gut health. These findings establish oats as a scientifically validated and practical dietary option for individuals aiming to manage weight and improve overall metabolic health.
Restraints Impact Analysis of Oats Market*
| Restraint | (~) % Impact on CAGR Forecast | Geographic Relevance | Impact Timeline |
|---|---|---|---|
| Competitive pressure from alternative grains such as quinoa and barley | -0.4% | Global, with strongest impact in health-conscious urban markets | Medium term (2-4 years) |
| Shelf life and storage challenges limits growth | -0.3% | Global, with acute impact in tropical and humid regions | Short term (≤ 2 years) |
| Logistical barriers in cold chain and storage facilities for oat-based perishable products | -0.2% | Asia-Pacific and emerging markets primarily | Medium term (2-4 years) |
| Supply variability influenced by climatic fluctuations impacting raw material availability | -0.5% | Global, with concentrated impact in major producing regions | Long term (≥ 4 years) |
| Source: Mordor Intelligence | |||
Competitive Pressure From Alternative Grains Such as Quinoa and Barley
The competitive landscape is complicated by the growing popularity of alternative grains like quinoa, which command premium pricing due to their complete amino acid profiles. This shift pressures oat producers to differentiate by emphasizing their unique benefits, such as beta-glucan content and well-established supply chains, to maintain relevance. The USDA emphasizes the increasing consumer preference for organic vegetables and pulse crops, which achieve significant price premiums in the market. This trend demonstrates how alternative grains can capture market share through premium positioning strategies. To remain competitive, companies must focus on processing innovations and functional applications for oats, rather than relying solely on nutritional claims. This approach is critical as alternative grains continue to expand their presence in health-focused retail channels, reshaping the competitive dynamics of the oats market.
Shelf Life and Storage Challenges Limits Growth
Climate change is significantly disrupting agricultural supply chains, introducing unprecedented volatility. According to USDA climate indicators, rising temperatures and shifting precipitation patterns are exerting considerable pressure on major commodity crops, including oats. The American Farm Bureau Federation's analysis of 2024 crop losses, which exceed USD 20.3 billion, underscores the severe impact of weather events on agricultural production. Drought and extreme heat alone accounted for over USD 11 billion in losses, highlighting the critical role of climate in shaping agricultural outcomes[2]Source: The American Farm Bureau Federation, "Hurricanes, Heat and Hardship: Counting 2024’s Crop Losses", www.fb.org. The U.S. Global Change Research Program further reveals that oats exhibit varied responses to increased carbon dioxide levels and warming conditions. However, elevated temperatures often lead to reduced yields due to shorter growth cycles and heightened susceptibility to pests and diseases. USDA's climate indicators emphasize that agricultural productivity is highly sensitive to climate variables, influencing key factors such as planting schedules, harvesting timelines, crop yields, and overall food security. Companies that adopt diversified sourcing strategies and strengthen their supply chain management are better positioned to mitigate these climate-related risks, ensuring consistent product availability and stable pricing in the face of ongoing challenges.
*Our forecasts treat driver/restraint impacts as directional, not additive. The impact forecasts reflect baseline growth, mix effects, and variable interactions.
Oats Market Segment Analysis
By Product Type:
Rolled Oats Dominate Through VersatilityIn 2025, rolled oats secured a commanding 34.98% share of the market, bolstered by their established consumer familiarity, versatile preparation methods, and broad retail availability. The USDA's dietary guidelines highlight rolled oats as a readily accessible whole grain, meeting daily intake recommendations while delivering essential nutrients and fiber. Decades of consumer education and marketing have positioned rolled oats as the go-to breakfast choice, with cooking times and textures tailored to mainstream preferences. The FDA's gluten-free labeling regulations, accommodating rolled oats meeting contamination thresholds, empower manufacturers to target celiac disease patients and those sensitive to gluten. Rolled oats lead the market due to their blend of convenience, nutritional benefits, and culinary adaptability, whether in traditional oatmeal, baked goods, or homemade granola and energy bars.
Oat flour is on a growth trajectory, boasting a projected 9.22% CAGR through 2031. This surge indicates a shift in focus, with consumers increasingly turning to oat flour for its functional and nutritional advantages, moving beyond its traditional role in breakfast cereals. USDA data shows Americans averaging 6.7 ounce-equivalents of daily grain consumption, underscoring the push for heightened whole grain intake. This positions oat flour as a prime choice for manufacturers aiming to bolster nutritional profiles. Riding the wave of the clean-label movement and gluten-free baking at home trends, oat flour is enhancing texture and nutritional value in breads, pastries, and other baked food. Furthermore, the USDA's Summer Food Service Program advocates for whole grain inclusion, spurring institutional demand for oat flour in foodservice settings prioritizing nutrition.



By Nature:
Conventional Oats Maintain Market LeadershipIn 2025, conventional oats maintain a dominant 67.92% market share, driven by well-established supply chains, affordability for price-sensitive consumers, and extensive availability across retail. According to USDA food availability data, grain consumption has risen significantly over the decades, with conventional production methods enabling the scalability and cost efficiency required to meet the demands of mainstream consumers. This segment benefits from mature agricultural practices, advanced processing infrastructure, and reliable distribution networks, ensuring consistent quality and competitive pricing for mass-market consumption. Conventional oats market dominance highlights their accessibility for budget-conscious consumers.
Organic oats are projected to grow at a 4.48% CAGR through 2031, reflecting their resilience despite higher production costs and stringent certification requirements. This growth is supported by increasing consumer willingness to pay premiums for products perceived as healthier and more environmentally friendly. Organic oat producers benefit from established certification systems and growing acceptance in retail channels, aligning with broader consumer trends favoring transparency and sustainability. The segment's expansion is particularly pronounced in developed markets, where consumers prioritize health and environmental considerations over price sensitivity. This creates opportunities for premium positioning and brand differentiation through a genuine commitment to organic principles, catering to a growing demand for sustainable and health-conscious products.
By Distribution Channel:
Supermarkets Dominate Traditional RetailIn 2025, supermarkets and hypermarkets hold a dominant 51.22% market share, leveraging their established position in consumer shopping patterns, superior product discovery mechanisms, and advanced inventory management systems that ensure consistent product availability. A House of Representatives hearing on food supply chain challenges identified transportation infrastructure and market concentration as critical factors influencing food distribution. This highlights the continued reliance on traditional retail channels to maintain product accessibility. These channels benefit from consumer familiarity with in-store shopping, the ability to directly compare products, and integrated promotional strategies that encourage impulse purchases and foster brand discovery. Furthermore, supermarkets and hypermarkets play a crucial role in supporting market growth by providing infrastructure for new product launches, seasonal promotions, and category management initiatives. Their market leadership underscores their role as the primary consumer touchpoint for oat products, offering a broad selection and competitive pricing that cater to diverse demographic needs, thereby reinforcing their importance in the overall market ecosystem.
Online retail channels are forecasted to grow at a robust 10.18% CAGR through 2031, significantly outpacing traditional retail channels as e-commerce adoption accelerates across packaged food categories. This growth is driven by shifting consumer preferences toward digital convenience and the increasing integration of online shopping into daily routines. The digital transformation of food retail creates significant opportunities for niche oat products and specialty brands to directly engage with consumers, bypassing traditional retail gatekeepers. These brands can build loyalty through personalized shopping experiences. E-commerce platforms also enable smaller producers to access national markets without requiring extensive distribution infrastructure, democratizing market access and fostering innovation in product development and marketing strategies. Additionally, online platforms provide valuable consumer data and relationship-building opportunities, enabling businesses to strengthen their market presence beyond traditional retail partnerships.
By Category:
Processed Oats Lead Through Convenience and Value AdditionIn 2025, processed oats command a dominant 71.55% market share and are projected to grow at a CAGR of 7.38% through 2031. This trend underscores a robust consumer inclination towards convenience-driven products. These offerings, characterized by minimal preparation time, consistent quality, and an extended shelf life, resonate deeply with today's fast-paced consumers. Reinforcing this trend, the USDA's dietary guidelines spotlight the significance of convenient whole grain options, underscoring their nutritional value and alignment with busy lifestyles. Manufacturers are elevating the processed oats category through techniques like kilning, rolling, and cutting, enhancing flavor and digestibility while preserving core nutritional benefits. The segment's leadership is bolstered by established distribution networks, widespread consumer acceptance, and its versatility in catering to retail markets. Leveraging advanced food preservation technologies, processors are not only extending shelf life but also ensuring nutritional quality, meeting the dual consumer demands of convenience and health integrity.
Institutional backing, exemplified by the USDA's WIC program broadening its scope to encompass a range of whole grains, underscores the pivotal role of processed oat products in delivering accessible nutrition to varied demographics. Technological strides in food processing empower manufacturers to craft products boasting superior nutritional profiles, prolonged shelf life, and enhanced sensory traits. Companies adeptly balancing processing efficiency with nutritional retention and a clean-label approach are reaping substantial rewards in this domain. As consumers increasingly seek convenience without sacrificing health benefits or ingredient clarity, the processed oats segment is solidifying its market foothold.
Geography Analysis
North America Oats Market
In 2025, North America commands a dominant 34.31% share of the oat market, a position bolstered by its long-standing oat cultivation, advanced processing facilities, and a strong consumer preference for oat-based breakfast items. The USDA's dietary guidelines, which advocate for whole grains to constitute at least half of grain consumption, further bolster the demand for oats in retail sectors. Instead of focusing on volume growth, the region's mature market leans towards premium positioning and innovative value additions, backed by reliable supply chains and processing capabilities that ensure consistent quality and competitive pricing. The USDA's expansion of its WIC program to encompass a variety of whole grains underscores institutional backing for oat consumption. This initiative enables participants to access a range of healthy food choices, highlighting oats as naturally gluten-free alternatives.
APAC Oats Market
Asia-Pacific is set to be the fastest-growing region, boasting an 8.05% CAGR through 2031. This growth is fueled by swift urbanization, rising disposable incomes, and heightened health awareness in key markets like China, India, and Japan. The region's growth trajectory is underpinned by demographic shifts, with urbanization spurring demand for convenient breakfast options and a growing health consciousness amplifying the appeal of oats' nutritional benefits.
EMEA and South America Oats Market
Europe, the Middle East and Africa (MEA), and South America together offer a varied growth landscape for the global oats market. In Europe, heightened health awareness and a surge in demand for plant-based, fiber-rich foods are propelling the popularity of both organic and processed oat products. This trend is especially pronounced in staple-loving nations like Germany, the UK, and the Nordic region. In South America, countries like Brazil and Argentina are not only bolstering local oat production but also witnessing a steady rise in oats' incorporation into traditional diets and breakfast routines. Meanwhile, the MEA region, though still in its infancy regarding oat consumption, is observing urban centers gradually gravitating towards convenient and nutritious food choices. Across these diverse regions, trends like clean-label preferences, an expanding retail framework, and the growing sway of Western breakfast customs are collectively amplifying the demand for oats across a myriad of product categories and sales channels.

Value Chain Analysis
The oats value chain starts with seed and agronomy inputs, farm production, and primary handling (cleaning, drying, storage) before moving into commercial milling and ingredient processing. Supply is shaped by geographically concentrated growing regions, including Canada (notably northern Alberta, northern Saskatchewan, and southern Manitoba), where weather sensitivity can translate into volatility in raw oat availability and quality. Downstream, millers convert raw oats into groats and core formats such as rolled, steel-cut, and flour, and also supply functional oat ingredients to cereal, bakery, snack, and beverage manufacturers, with quality assurance and segregation practices (for gluten-free or identity-preserved claims) adding cost and complexity.
Manufactured products flow through traditional retail, led by supermarkets and hypermarkets (51.22% share in 2025), alongside rapidly expanding e-commerce that lowers listing and distribution barriers for niche and specialty brands. Key bottlenecks and value capture points include milling capacity location and modernization, traceability systems, and storage/logistics for maintaining product integrity across climates. Recent examples of value chain repositioning include farmer-led regionalization and identity-preserved supply models, such as Green Acres Milling in Albert Lea, Minnesota, backed by farmer investment and designed to process traceable oats within a localized oat-shed, reflecting a shift toward shorter, more controlled supply chains.
Competitive Landscape
The global oats market operates in a fragmented structure with multiple regional and international players competing across value chains, from raw oats to processed oat-based products. Major companies in the market include PepsiCo, Inc., Mars, Incorporated, General Mills, Inc., Nestle S.A., and B&G Foods, Inc. These companies focus on product innovation, strategic partnerships, and geographical expansion to maintain their market positions.
The increasing demand for healthy and functional foods has intensified competition, attracting new entrants and private labels into the market. Companies are investing in research and development to create innovative oat-based products, while also strengthening their distribution networks to reach wider consumer bases.
Regional consumption patterns, particularly the growing preference for gluten-free foods in North America and Europe, further contribute to the market's fragmentation and diversity. Market players are adapting their product portfolios to meet local preferences and dietary requirements, while also implementing aggressive marketing strategies to differentiate themselves from competitors.
Oats Industry Leaders
-
PepsiCo, Inc.
-
Mars, Incorporated
-
General Mills, Inc.
-
Nestle S.A.
-
B&G Foods, Inc.
- *Disclaimer: Major Players sorted in no particular order
Oats Market Companies Covered in this Report
- PepsiCo, Inc.
- Mars, Incorporated
- General Mills, Inc.
- Nestle S.A.
- B&G Foods, Inc.
- Bob's Red Mill
- Nature's Path Foods
- Post Holdings, Inc.
- Marico
- Blue Lake Milling
- Avena Foods Limited
- Grain Millers
- Richardson International Limited
- Swedish Oat Fiber AB
- Unigrain Pty Ltd
- The Hain Celestial Group, Inc.
- Fazer
- Bagrrys India Private Limited
- Rude Health
- Bennett's Seed

Market Opportunities and Future Outlook
Opportunities are opening in higher-value processing and ingredient innovation as companies diversify oats beyond traditional bowl-based breakfast formats into ready-to-consume and functional applications. Capacity upgrades and quality systems are a visible focus: Raisio completed an expansion at its Nokia Mill in Finland in July 2026 that included a new laboratory to support quality management and production operations, strengthening export-readiness for gluten-free oat products. At the same time, Oatly began a USD 16 million multi-year expansion at Landskrona, Sweden in March 2026 to lift output capacity, highlighting continued investment in industrial-scale oat processing footprints tied to branded product pipelines.
Supply-chain whitespace centers on traceable, identity-preserved sourcing and regional milling that can stabilize supply and enable premium claims amid climate-driven variability. The farmer-owned Green Acres Milling project in Albert Lea, Minnesota (USD 68.8 million) is structured to process roughly 4 million bushels annually of identity-preserved oats, signaling demand for tighter provenance control and domestic partnerships with food manufacturers. In Asia, the expansion of domestic oat milling capacity in China (around 750,000 tonnes) demonstrates a shift from importing processed products toward local conversion, creating openings for technology transfer, specialty ingredients, and differentiated product formulations that fit local distribution and regulatory requirements.
Recent Industry Developments in Oats Market
- July 2026: PepsiCo launched Quaker Oat Shake and Go, a ready-to-drink whole grain oat-based shake designed for on-the-go consumption with no preparation. The launch expands oats into a more beverage-like convenience format and targets incremental occasions beyond traditional breakfast at home.
- December 2025: Mars completed its acquisition of Kellanova, adding a large portfolio of global snacking and cereal brands to its Mars Snacking business. The deal increases scale in adjacent grain-based categories and can reshape shelf competition and promotional dynamics for oat-containing breakfast and snack products.
- August 2024: Mars announced a definitive agreement to acquire Kellanova for USD 35.9 billion. The planned combination signaled consolidation in packaged foods, influencing how major players approach brand investment, distribution leverage, and innovation pace across cereal and snack aisles where oats are a common ingredient.


Oats Market Report Scope and Research Methodology
Market Definition and Coverage
For this study, the oats market is measured as the value of oats sold in different forms for food use, across retail and other commercial channels, tracked across major regions in current USD.
Scope exclusions: This sizing does not count non-oat cereals and does not treat oat ingredients that are primarily positioned as separate additives (such as isolated proteins) as part of the core oats market.
Segments Covered in This Report
-
By Product Type
- Whole Oats
- Oat Groats
- Steel-Cut Oats
- Rolled Oats
- Oat Flour
-
By Nature
- Conventional
- Organic
-
By Category
- Raw Oats
- Processed Oats
-
By Distribution Channel
- Supermarkets/Hypermarkets
- Convenience/Grocery Stores
- Online Retail Stores
- Other Distribution Channels
-
By Geography
-
North America
- United States
- Canada
- Mexico
- Rest of North America
-
Europe
- Germany
- United Kingdom
- Italy
- France
- Spain
- Netherlands
- Poland
- Belgium
- Sweden
- Rest of Europe
-
Asia-Pacific
- China
- India
- Japan
- Australia
- Indonesia
- South Korea
- Thailand
- Singapore
- Rest of Asia-Pacific
-
South America
- Brazil
- Argentina
- Colombia
- Chile
- Peru
- Rest of South America
-
Middle East and Africa
- South Africa
- Saudi Arabia
- United Arab Emirates
- Nigeria
- Egypt
- Morocco
- Turkey
- Rest of Middle East and Africa
-
North America
Data Sources, Market Sizing, and Validation
Desk Research
Desk work starts with building a clean supply and demand picture for oats by geography, and then mapping it to value. We typically review public sources such as USDA datasets, FAOSTAT, UN Comtrade trade statistics, and official agriculture statistics from key producing and consuming countries, which helps validate production, imports, exports, and apparent consumption.
Next, we cross-check how oats move into consumer markets by reading company annual reports and investor presentations, retailer and brand announcements covered by reputed press, and relevant association publications. For pricing and commercialization signals, we may also reference subscription tools focused on news and financials, patents, and shipment-level import and export records, which help sanity check price ranges and trade flows over time. The sources listed above are illustrative only, and many other public and paid references are used to collect data, validate assumptions, and close clarification gaps.
Primary Interviews and Surveys
Primary discussions are used to pressure test the desk-based assumptions, especially around what is counted as oats versus adjacent oat-derived products, and how pricing changes by form and channel. We speak with a mix of value chain participants and downstream experts across the Americas, EMEA, and APAC so regional consumption patterns, trade realities, and product mix shifts are reflected in the final model.
Distribution of primary research fieldwork respondents
| Company type | Respondent position | Region |
|---|---|---|
| Top tier: 27% | CXOs: 14% | APAC: 43% |
| Mid tier: 56% | Functional/Unit leaders: 30% | EMEA: 30% |
| Smaller Players: 17% | Managers: 56% | Americas: 27% |
Market-Sizing & Forecasting
Our main build uses a top-down logic where production, trade, and consumption indicators are stitched together to reconstruct the addressable oats value pool by region, and then converted to revenue using observed price bands by form and channel. To keep the totals grounded, the outputs are corroborated with selective bottom-up approximations such as sampled price times volume checks for key oat forms, and supplier and channel checks where data visibility is reasonable.
Inputs that commonly matter for oats include harvested area and yield trends, import dependence for deficit regions, share shifts across raw versus processed oats, the mix of whole, steel-cut, rolled, and flour formats, and retail channel expansion (including online). When the model needs to bridge gaps, we use conservative proxies that can be explained and repeated, such as carrying forward mix shares only after validating that no major product or channel discontinuity occurred.
For forecasting, scenario analysis is applied around a base case that is anchored in expected crop availability, trade flow stability, and price direction, and then adjusted using what industry respondents see in near-term demand for gluten-free and health-led oat consumption. Where volatility is higher, smoothing is used on the time series so one abnormal season does not over-pull the forward numbers.
Data Validation & Update Cycle
Validation is done through multiple checks that compare model outputs with independent signals, such as trade balances versus consumption direction, and price movements versus value growth. When a variance looks unusual, we re-check the underlying assumptions, revisit key inputs, and re-contact experts if the change is tied to a real market event rather than a data artifact.
Before sign-off, the work goes through a multi-step internal review so units, conversions, and regional roll-ups are consistent. The report is refreshed annually, and interim updates are made when material events can shift supply, pricing, or demand, followed by a final pre-delivery pass to ensure the latest view is reflected.
Mordor Intelligence's Oats Market Size Compared Against Other Published Estimates
Published oats market values often differ because not everyone counts the same forms, channels, and use cases, and the year selected for the headline number can also change the outcome. Differences also show up when price series are built from different reference points, or when older assumptions are carried forward without being re-checked.
The main gap comes from whether oat-derived ingredients and broader oat-based downstream products are blended into the total, and in Mordor Intelligence the sizing stays centered on oats forms tracked by product type and raw versus processed categories, which keeps adjacent ingredient-only revenue from inflating the core market value.
Benchmark comparison
| Source | Market Size | Gaps in Research Methodology |
|---|---|---|
| Mordor Intelligence | USD 4.50 B (2026) | |
| Market Research Publisher A | USD 5.16 B (2023) | Uses an earlier base year and appears to include a wider set of oat-based product and application revenues, which can lift the total versus a forms-focused oats definition. |
| Market Research Publisher B | USD 6.73 B (2024) | Headline value likely reflects broader inclusion choices (type, form, and nature definitions vary) and a different pricing and currency timing approach, which can widen the reported market size. |
The spread across sources is largely explained by scope and timing choices, followed by how price progression and mix are handled across processed forms and channels. By keeping assumptions tied to repeatable supply and consumption signals and then checking them with targeted industry feedback, the resulting market total stays transparent and easier to reconcile year to year.


Key Questions Answered in the Report
What is the current value of the oats market?
The Oats market size is valued at USD 4.5 billion in 2026, with expectations of reaching USD 6.15 billion by 2031.
Which region generates the highest revenue?
North America leads with 34.31% of global sales, supported by established breakfast habits and strong retail infrastructure.
Which product type segment is growing the fastest?
Oat flour shows the highest CAGR of 9.22% through 2031 due to rising use in gluten-free and clean-label food products.
How fast is online grocery impacting oat sales?
Online channels are forecast to expand at a 10.18% CAGR, dramatically outpacing brick-and-mortar growth as consumers favor digital convenience.
Page last updated on:


 Your data is secure and never sold or shared.


