
Nutrition Therapy Market Size and Share
Market Overview
| Study Period | 2020 - 2031 |
|---|---|
| Market Size (2026) | USD 59.29 Billion |
| Market Size (2031) | USD 80.74 Billion |
| Growth Rate (2026 - 2031) | 6.40 % |
| Fastest Growing Market | Asia-Pacific |
| Largest Market | North America |
| Market Concentration | Medium |
Major Players *Disclaimer: Major Players sorted in no particular order Image © Mordor Intelligence. Reuse requires attribution under CC BY 4.0. | |
Nutrition Therapy Market Analysis by Mordor Intelligence
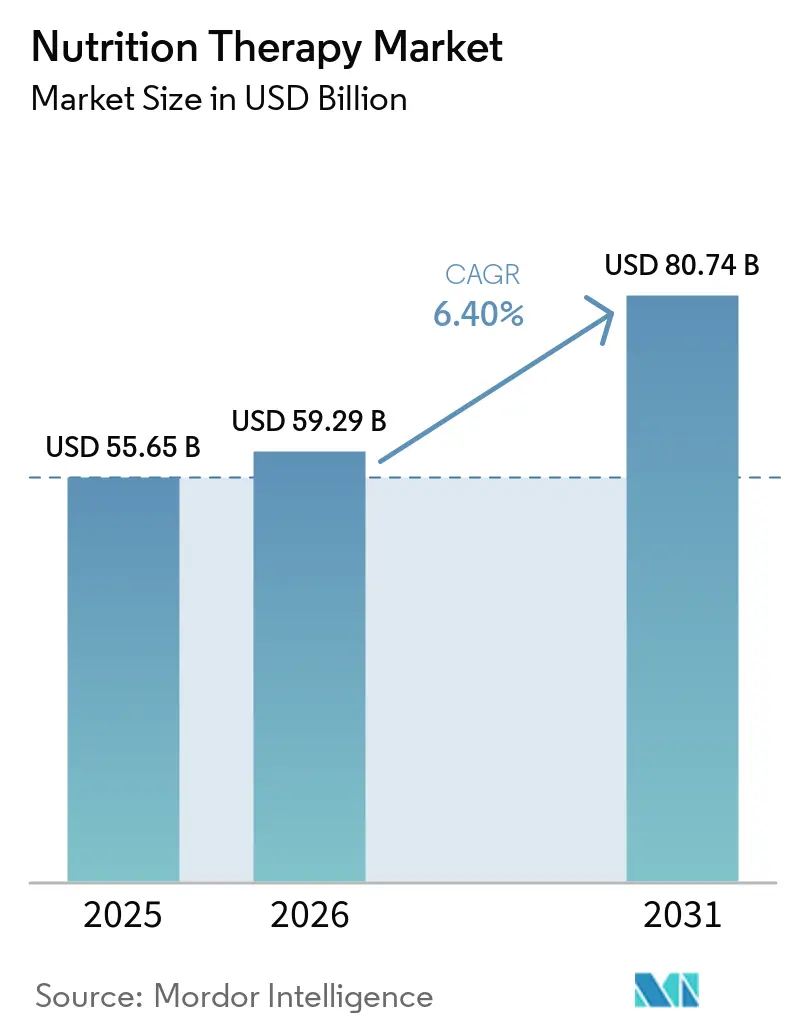
The Nutrition Therapy Market size was valued at USD 55.65 billion in 2025 and is estimated to grow from USD 59.29 billion in 2026 to reach USD 80.74 billion by 2031, at a CAGR of 6.40% during the forecast period (2026-2031).
The Nutrition therapy market includes oral nutritional supplements, tube-fed enteral formulas, parenteral nutrition, and specialized medical foods used in hospitals, homecare, long-term care, and ambulatory settings. Demand is supported by disease-related malnutrition among aging populations and people living with chronic conditions, as well as the wider use of nutrition screening in care protocols. Disease-related malnutrition in hospitalized patients shows that the clinical need extends beyond intensive-care settings. Care delivery is also shifting from hospital wards toward home and community settings, which favors convenient, ready-to-use formats and services that can support outpatient care. Competitive activity centers on clinical evidence, disease-specific products, homecare access, and portfolio expansion, although reimbursement gaps, manufacturing costs, and differing product classifications continue to limit access in several countries.
Key Report Takeaways
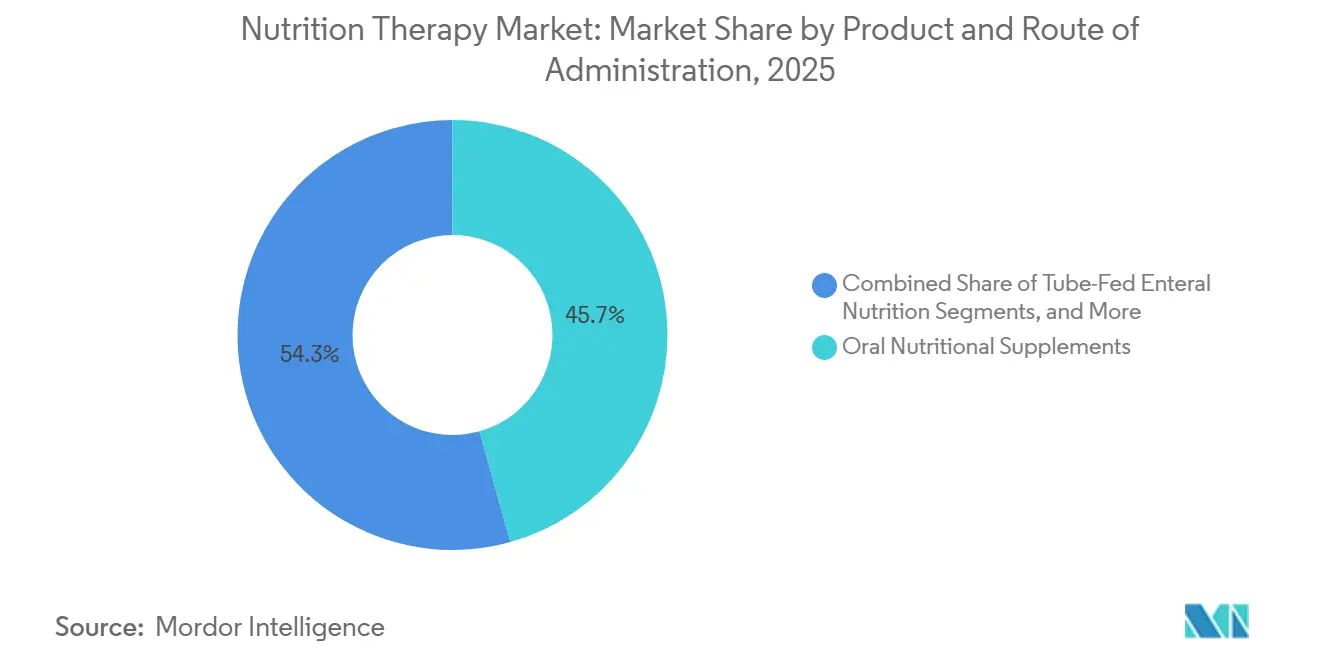
- By product and route of administration, oral nutritional supplements held 45.66% of the nutrition therapy market share in 2025 and are projected to grow at an 8.56% CAGR through 2031.
- By nutrition type, standard nutrition accounted for 38.45% of the nutrition therapy market size in 2025, while disease-specific nutrition is projected to advance at a 9.73% CAGR through 2031.
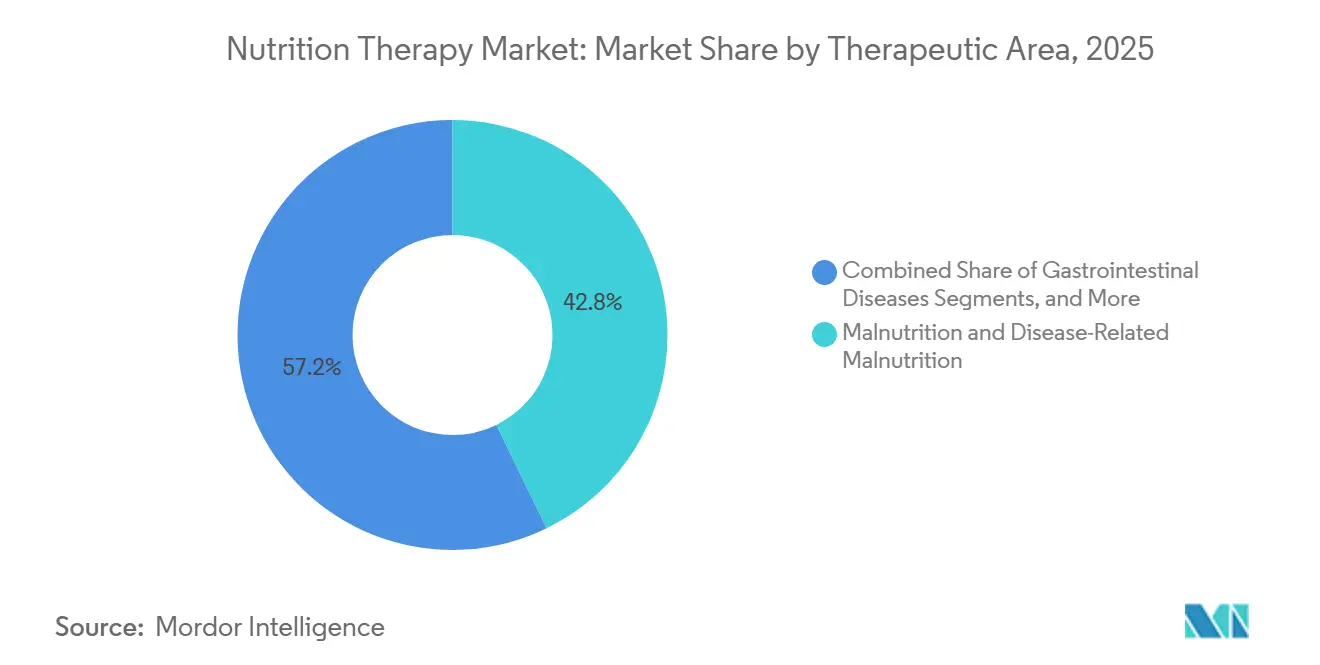
- By therapeutic area, malnutrition and disease-related malnutrition accounted for 42.78% of the nutrition therapy market share in 2025, while gastrointestinal diseases are projected to grow at a 7.93% CAGR through 2031.
- By age group, adults represented 39.89% of demand in 2025, while children are expected to grow at an 8.88% CAGR through 2031.
- By end user, hospitals and ambulatory surgical centers held 58.77% of demand in 2025, while homecare settings are projected to grow at a 9.45% CAGR through 2031.
- By distribution channel, hospital pharmacies accounted for 55.96% of demand in 2025, while E-commerce is projected to expand at a 9.67% CAGR through 2031.
- By geography, North America held 41.78% of demand in 2025, while Asia-Pacific is projected to grow at an 8.59% CAGR through 2031.
Note: Market size and forecast figures in this report are generated using Mordor Intelligence’s proprietary estimation framework, updated with the latest available data and insights as of January 2026.
Global Nutrition Therapy Market Trends and Insights
Drivers Impact Analysis*
| DRIVER | (~) % IMPACT ON CAGR FORECAST | GEOGRAPHIC RELEVANCE | IMPACT TIMELINE |
|---|---|---|---|
| Aging-linked malnutrition and sarcopenia management | +2.1% | Global, concentrated in Europe, Japan, and China | Long term (≥ 4 years) |
| Rising chronic disease and oncology nutrition demand | +1.5% | Global, with North America, Europe, and Asia-Pacific as core regions | Medium term (2-4 years) |
| Shift from hospital to home-based nutrition support | +0.9% | North America and Europe, with early adoption in Australia and South Korea | Medium term (2-4 years) |
| Mainstreaming of evidence-based nutrition care | +0.6% | Global, with Europe and North America leading | Long term (≥ 4 years) |
| GLP-1-associated muscle loss and nutritional support demand | +0.7% | North America first, followed by Europe and Asia-Pacific | Short term (≤ 2 years) |
| Formula personalization through disease, tolerance, and microbiome data | +0.5% | Europe and North America, with selective Asia-Pacific research centers | Long term (≥ 4 years) |
| Source: Mordor Intelligence | |||
Aging-Linked Malnutrition and Sarcopenia Management
Population aging remains a sustained demand driver for the nutrition therapy market. The 2025 Asian Working Group for Sarcopenia consensus expanded sarcopenia diagnostic criteria to include adults aged 50 to 64 years, broadening eligibility for oral nutritional supplements and high-protein medical foods.[1] Japan’s 2025 guidance recommended protein intake of 1.2 to 1.5 g/kg/day for older adults with disease-related malnutrition, supporting demand for high-protein enteral products. A 2025 network meta-analysis found that resistance training combined with nutritional supplementation delivered better sarcopenia outcomes than either intervention alone.[2] This evidence supports nutrition care before and after hospitalization and expands dispensing opportunities across homecare and retail settings.
Rising Chronic Disease and Oncology Nutrition Demand
Chronic disease and oncology care are increasing the need for systematic nutrition assessment and treatment in the nutrition therapy market. Cancer-related malnutrition affects 30% to 85% of oncology patients, while nutrition support protocols remain inconsistently integrated across care pathways. The Crohn’s & Colitis Foundation stated in its 2025 white paper that exclusive enteral nutrition is a first-line option for inducing remission in Crohn’s disease, with pediatric remission rates of 67% to 80%.[3]
A 2025 cohort study reported that infliximab combined with partial enteral nutrition improved the 14-week clinical response rate to 87.01%, compared with 74.75% for monotherapy, and the 54-week endoscopic remission rate to 84.42%, compared with 65.66%.[4] Danone’s 2026 partnership with the Union for International Cancer Control shows that nutrition advocacy is becoming part of commercial efforts to improve access to oncology care. ESPEN’s 2025 guidance also incorporated nutrition risk assessment from pre-admission through post-discharge, embedding nutrition care within the broader clinical pathway.
GLP-1-Associated Muscle Loss and Nutritional Support Demand
The rising use of GLP-1 receptor agonists for obesity care has created a new demand channel for nutrition therapy. A 2025 joint clinical advisory reported that lean body mass represented 38% of average total weight loss in GLP-1 trials, while muscle represented 20% of total weight lost. The advisory recommended protein intake of 1.2 to 1.6 g/kg/day during active weight loss and identified risks of deficiencies in iron, calcium, magnesium, zinc, and vitamins A, D, B1, and B12. Appetite suppression can make these nutritional targets difficult to achieve through regular meals. Limited access to registered dietitian counseling creates opportunities for oral nutritional supplements and outpatient services that support monitored intake.
Shift from Hospital to Home-Based Nutrition Support
Home-based nutrition support is reshaping product requirements and delivery models in the nutrition therapy market. The National Home Infusion Association reported that 220,000 Americans depend on home enteral nutrition annually, while 32,000 depend on home parenteral nutrition, based on 2025 to 2026 data. Shelf-stable, ready-to-hang enteral formulas, premixed parenteral nutrition bags, and high-protein oral supplements are better suited to home administration than hospital-compounded alternatives. The Healthcare Nutrition Council’s 2026 work on H.R. 2172, the Preserving Patient Access to Home Infusion Act, highlights the policy focus on provider economics and patient access.
Restraints Impact Analysis*
| RESTRAINT | (~) % IMPACT ON CAGR FORECAST | GEOGRAPHIC RELEVANCE | IMPACT TIMELINE |
|---|---|---|---|
| Uneven reimbursement for oral and home enteral nutrition | -0.6% | North America and Europe, while emerging markets face limited structural coverage | Long term (≥ 4 years) |
| High clinical-grade manufacturing and compliance costs | -0.4% | Global, with the greatest pressure on multi-jurisdiction manufacturers | Medium term (2-4 years) |
| Fragmented product classification across food, medical food, and drug rules | -0.3% | North America, Europe, and Asia-Pacific, each with different classification frameworks | Long term (≥ 4 years) |
| Limited interoperability between nutrition data and clinical workflows | -0.2% | Global, with greatest friction in systems without integrated electronic health records | Medium term (2-4 years) |
| Source: Mordor Intelligence | |||
Uneven Reimbursement for Oral and Home Enteral Nutrition
Reimbursement gaps for oral nutritional supplements and home enteral nutrition restrict patient access despite clear clinical need. National Home Infusion Association analysis of CMS data showed that Medicare home enteral nutrition kit suppliers declined by 31%, while beneficiaries receiving home enteral nutrition fell by 27% between 2014 and 2023. The supplied data also showed that the average cost of preparing a home parenteral nutrition bag increased by 75.4% from 2016 through 2024, while average service reimbursement declined from 2022 to 2024. These cost and reimbursement pressures challenge the operational viability of smaller specialized providers. Delayed access to clinically indicated nutrition products can postpone treatment until hospitalization becomes unavoidable.
High Clinical-Grade Manufacturing and Compliance Costs
Sterile manufacturing and clinical validation require substantial investment, favoring large, well-capitalized nutrition suppliers. The U.S. Food and Drug Administration took emergency action in September 2026 to address a neonatal starter parenteral nutrition supply shortage after two outsourcing facilities permanently closed. This event highlighted limited redundancy in high-compliance nutrition manufacturing. Compliance with the Food Safety Modernization Act, European Good Manufacturing Practice, and country-specific medical food authorization requirements increases costs and delays product launches. Suppliers serving GCC countries, Japan, and Australia also face national registration requirements that can extend time to market by 12 to 24 months. Differing food, medical food, and drug classifications create additional regulatory uncertainty across regions.
*Our forecasts treat driver/restraint impacts as directional, not additive. The impact forecasts reflect baseline growth, mix effects, and variable interactions.
Segment Analysis
By Product and Route of Administration: Oral Nutritional Supplements Lead Demand While Real-Food Enteral Products Gain Ground
Oral nutritional supplements held 45.66% of the nutrition therapy market share in 2025 and are projected to grow at an 8.56% CAGR from 2026 to 2031. They support disease-related malnutrition, oncology, surgical recovery, hospital care, and ambulatory treatment. Tube-fed enteral nutrition remains important in intensive care, oncology, and neurological care, while parenteral nutrition serves patients with complex clinical needs. A 2025 review reported that polymeric enteral formulas achieved remission induction in up to 85% of pediatric Crohn’s disease cases.
Baxter’s 2025 and 2026 patent activity for terminally heat-sterilized multichamber parenteral nutrition bags focused on simplifying bedside preparation and reducing dosing errors. Danone’s July 2025 acquisition of a majority stake in Kate Farms combined Kate Farms, Nutricia, Real Food Blends, and Functional Formularies within a North American medical nutrition platform. The platform is eligible for Medicare, Medicaid, and WIC coverage in 35 states and is present in more than 1,500 U.S. hospitals. Fresenius Kabi launched NutriChef in September 2026 across six European markets, with ingredients from 21 plants and more than 75% real-food content.

By Nutrition Type: Disease-Specific Formulas Strengthen Clinical Value
Standard nutrition commanded 38.45% of demand in 2025, supported by its broad use in hospital formularies for general calorie and macronutrient requirements. Disease-specific nutrition is forecast to grow at a 9.73% CAGR from 2026 to 2031. These formulas address renal disease, liver disease, cancer, and malabsorption through targeted amino acid, protein, and micronutrient profiles. Elemental and semi-elemental formulas support patients with inflammatory bowel disease and malabsorption who cannot tolerate intact proteins.
The 2025 ECCO consensus recommended polymeric formulas as the preferred enteral option for inflammatory bowel disease due to comparable efficacy and better palatability. Modular nutrition is increasingly used for protein augmentation in GLP-1 care protocols. Medical foods for inborn errors of metabolism require controlled manufacturing and regulatory compliance, while payers increasingly seek therapeutic-outcome evidence for reimbursement. Danone opened its OneBiome Lab in Paris-Saclay in 2025 to combine microbiology and clinical nutrition research.
By Therapeutic Area: Malnutrition Drives Volume While Gastrointestinal Disease Drives Growth
Malnutrition and disease-related malnutrition accounted for 42.78% of demand in 2025, making this the largest therapeutic application across hospital, long-term care, surgical, and outpatient settings. ESPEN’s 2025 geriatric guideline included 82 evidence-based recommendations for nutrition care among malnourished and at-risk older adults. Gastrointestinal diseases are forecast to grow at a 7.93% CAGR from 2026 to 2031, supported by evidence for exclusive and partial enteral nutrition in Crohn’s disease.
Oncology remains strategically important because nutrition care affects treatment tolerance and recovery. Danone’s 2026 UICC partnership seeks to establish nutritional care as a recognized component of cancer treatment pathways. Renal, neurological, cardiovascular, liver, respiratory, and diabetes-related care require highly specified formulas. These specialized segments favor established manufacturers with broad clinical portfolios, strong clinical evidence, and regulatory capabilities.
By Age Group: Children Record the Fastest Growth as Pediatric Evidence Expands
Adults represented 39.89% of demand in 2025, reflecting their large share of hospital admissions, long-term care use, and outpatient oncology treatment. Children are forecast to grow at an 8.88% CAGR from 2026 to 2031, supported by public insurance coverage and stronger evidence for nutritional care in childhood inflammatory bowel disease. Early disease-specific intervention can improve long-term outcomes and reduce hospitalization costs. Kate Farms launched Kids Nutrition in March 2025 for children aged 1 to 13 years, with eligibility for Medicare, Medicaid, and WIC.
Neonates and infants remain a smaller but clinically critical group. Fresenius Kabi introduced its Pedismof range in Europe in June 2026 for preterm neonates through adolescents. The ready-to-use three-chamber bags combine glucose, balanced amino acids, and SMOFlipid with omega-3 fatty acids, reducing risks associated with nonstandard pediatric compounding. Older adults remain the second-largest cohort, with demand linked to sarcopenia management and disease-related malnutrition.
By End User: Hospital Demand Remains Largest While Homecare Gains Pace
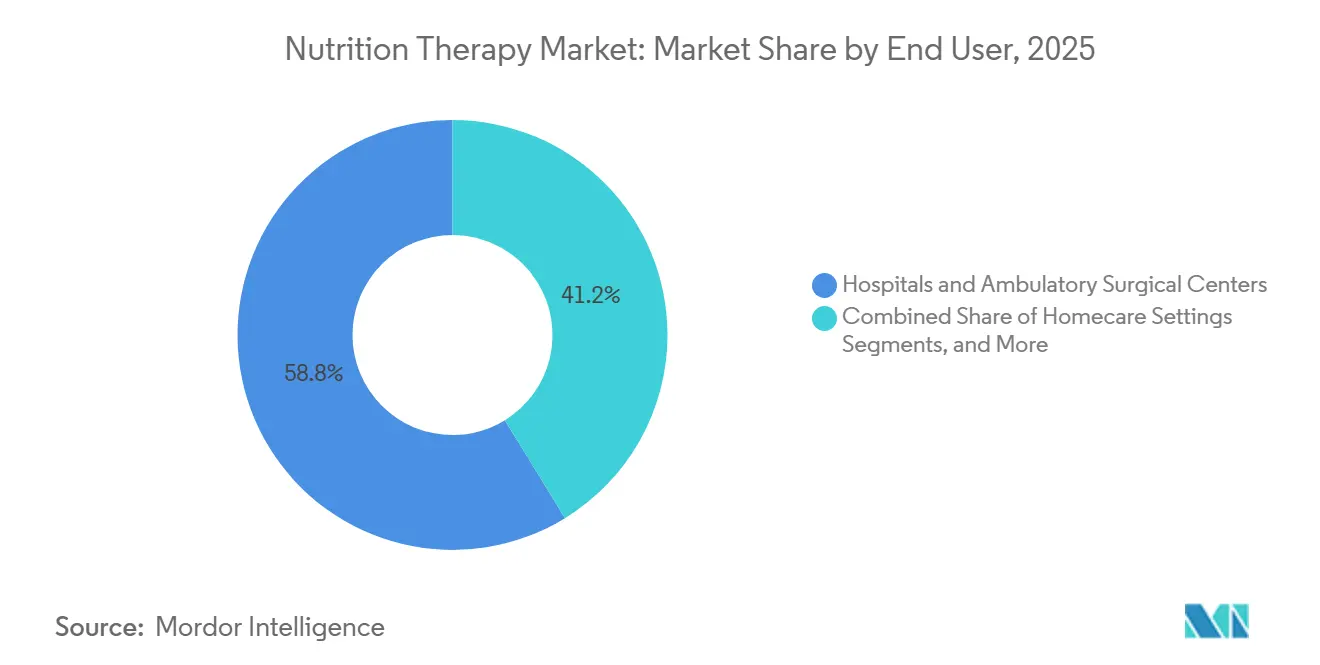
Hospitals and ambulatory surgical centers held 58.77% of demand in 2025, reflecting the central role of hospital dietitians, clinicians, and formulary committees. Hospitals are often where providers identify nutritional risk and initiate treatment. Homecare settings are forecast to grow at a 9.45% CAGR from 2026 to 2031, driven by early-discharge policies, patient preference for home-based care, and broader support coverage.
Nursing homes and senior homes remain steady users due to aging demographics and the prevalence of frailty. Specialty clinics serve patients with renal disease, cancer, and metabolic disorders requiring close clinical management, while rehabilitation centers increasingly include nutrition in post-acute recovery protocols. The CMS memorandum cited in the supplied research encouraged investment in hospital nutrition services in 2026 and may increase referrals of clinically stable patients to homecare providers. Suppliers require formats that support both care settings, with clear administration guidance and reliable distribution.
By Distribution Channel: E-Commerce Expands Access Alongside Clinical Dispensing
Hospital pharmacies accounted for 55.96% of distribution in 2025 because clinical dispensing supports traceability, supervision, and patient monitoring. E-commerce is forecast to grow at a 9.67% CAGR from 2026 to 2031. Direct-to-patient storefronts and online pharmacy fulfillment expand access to covered medical nutrition and support patients continuing therapy after discharge. Medical supervision requirements under U.S. and European frameworks continue to limit unrestricted direct-to-consumer models.
Retail pharmacies remain relevant for ambulatory oral supplement users and patients transitioning from hospital to home. Kate Farms expanded its High Protein Nutrition Shake to more than 6,800 Walmart and CVS locations in August 2026, representing a sevenfold increase in retail distribution. The expansion connected insurance-covered medical nutrition with mass-retail access. Suppliers must balance access with traceability, medical supervision, and payer requirements, strengthening the case for integrated fulfillment and patient-support models in the nutrition therapy market.
Geography Analysis
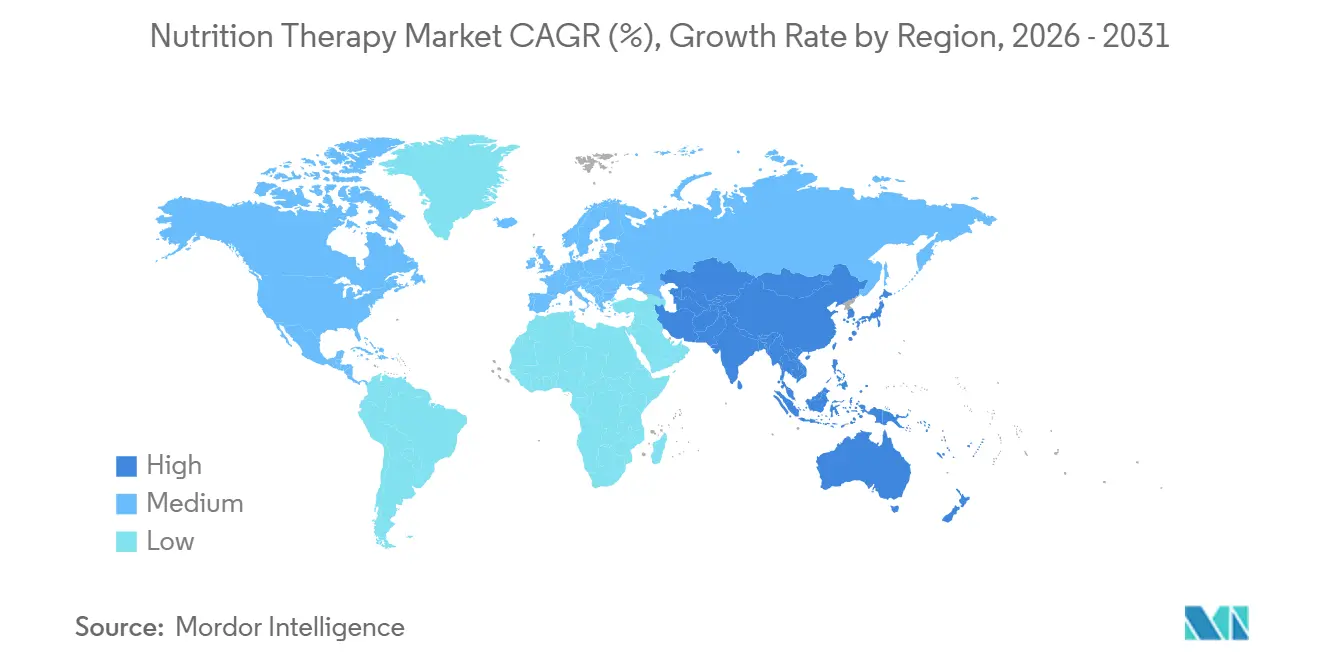
North America held 41.78% of the nutrition therapy market share in 2025, supported by established hospital infrastructure and medical food oversight. The region has a strong demand for hospital- and home-based clinical nutrition. National Home Infusion Association data show that home parenteral nutrition bag preparation costs increased by 75.4% from 2016 to 2024, while Medicare home enteral nutrition suppliers declined by 31% from 2014 to 2023. These constraints affect provider capacity despite rising patient needs. The Healthcare Nutrition Council’s 2026 support for H.R. 2172 and the CMS memorandum cited in the supplied research indicate greater policy focus on improving access.
Asia-Pacific is forecast to grow at a CAGR of 8.59% from 2026 to 2031, driven by aging populations and expanding insurance coverage for clinical nutrition in China, Japan, and South Korea. In its November 2025 presentation, Fresenius Kabi identified itself as the leading parenteral nutrition supplier in China. Japan’s 2025 guidelines provide specific nutritional management standards for sarcopenia and frailty. The 2025 AWGS consensus broadened the age range for sarcopenia screening, potentially expanding the eligible patient population in South Korea, Australia, and India. Europe has established nutrition protocols in Germany, France, and the United Kingdom, where disease-specific formulas and homecare models are key competitive areas. ESPEN’s 2025 surgical and geriatric guidelines support nutrition interventions across a broader patient population.
GCC health strategies increasingly position clinical nutrition within noncommunicable disease management, supporting structured market entry across the Middle East and Africa. In South America, Brazil leads the market, with the SUS public health system continuing to expand enteral nutrition coverage, according to the supplied research. Argentina relies more heavily on private healthcare networks as the primary distribution channel. These regional differences require suppliers to tailor reimbursement, registration, and distribution strategies to each healthcare system.
Competitive Landscape
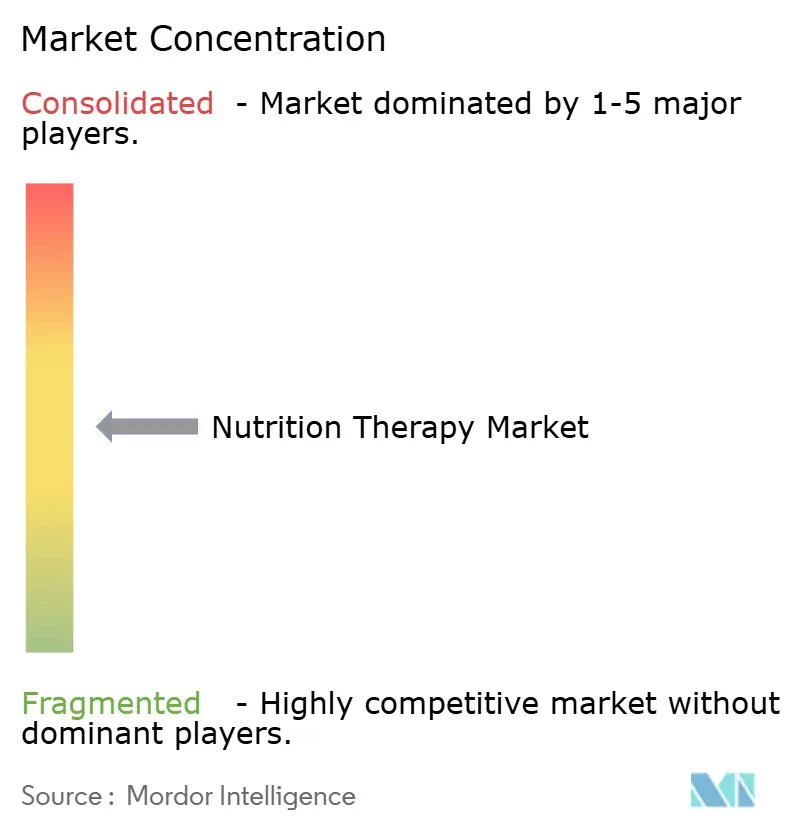
The nutrition therapy market is moderately concentrated, with Fresenius Kabi, Nestlé Health Science, Abbott, and Danone holding leading positions in global clinical nutrition. Fresenius Kabi reported 7% organic revenue growth in the third quarter of 2025 and positioned itself as the leading global parenteral nutrition provider and the second-largest enteral nutrition supplier in Europe and China. Its 2026 launches included Pedismof, Fresubin PLANT-BASED Tube Feed, and NutriChef, creating a portfolio expansion pace that smaller suppliers may find difficult to match.
Danone expanded its medical nutrition position by acquiring a majority stake in Kate Farms in July 2025, combining plant-based, whole-food, and clinical formula capabilities. Fresenius Kabi launched Fresubin PLANT-BASED Tube Feed in Europe in March 2026, offering a 1.5 kcal/ml, 100% soy-protein, 500 ml ready-to-use product with halal and kosher certifications. Its September 2026 NutriChef launch added a plant-derived enteral nutrition option with real-food ingredients across six European countries, while Danone’s OneBiome Lab strengthened the focus on clinical and microbiome research.
Specialist brands, including Kate Farms, Real Food Blends, Functional Formularies, Smartfish, AYMES, Nutrisens, and Vegenat, address specific nutrition therapy needs, including oncology and disease-related malnutrition. Baxter’s patent examples focused on ready-to-use multichamber parenteral nutrition bags with integrated micronutrients to improve clinical workflows. ISO 22000, European Regulation 609/2013, sterile production requirements, and national registration standards create significant barriers for smaller entrants, while leading companies benefit from broad portfolios, clinical evidence capabilities, and regulatory resources.
Nutrition Therapy Industry Leaders
-
Abbott Laboratories
-
Fresenius Kabi AG
-
Danone S.A.
-
Nestlé S.A.
-
Baxter International Inc.
- *Disclaimer: Major Players sorted in no particular order
Recent Industry Developments
- September 2026: Fresenius Kabi launched NutriChef, a plant-derived enteral formula containing ingredients from 21 plants and more than 75% real-food content, across six European countries.
- August 2026: Kate Farms expanded distribution of its GLP-1-targeted High Protein Nutrition Shake to more than 6,800 Walmart and CVS stores nationwide, representing a sevenfold increase.
- June 2026: Fresenius Kabi launched the Pedismof pediatric parenteral nutrition range in Europe, offering age-specific, ready-to-use three-chamber bags for preterm neonates through adolescents.
- February 2026: Danone partnered with the Union for International Cancer Control on World Cancer Day to promote nutritional care within global cancer treatment pathways.
Global Nutrition Therapy Market Report Scope
As per the scope of the report, nutrition therapy, often formally referred to as medical nutrition therapy (MNT), is an evidence-based clinical treatment plan that uses tailored dietary changes, nutrition education, and targeted metabolic management to help treat or manage specific health conditions.
The nutrition therapy market is segmented by product and route of administration, nutrition type, therapeutic area, age group, end user, distribution channel, and geography. By product and route of administration, the market includes oral nutritional supplements, tube-fed enteral nutrition, parenteral nutrition, and others. By nutrition type, the market is segmented into standard nutrition, specialized nutrition, disease-specific nutrition, elemental and semi-elemental nutrition, modular nutrition, and medical foods for inborn errors of metabolism. By therapeutic area, the market is categorized into malnutrition and disease-related malnutrition, oncology, diabetes, gastrointestinal diseases, neurological diseases, renal diseases, respiratory diseases, cardiovascular diseases, liver diseases, and others. By age group, the market is segmented into neonates, infants, children, adults, and older adults. By end user, the market is segmented into hospitals and ambulatory surgical centers, home care settings, nursing homes and senior homes, specialty clinics, rehabilitation centers, and others. By distribution channel, the market is segmented into hospital pharmacies, retail pharmacies, e-commerce, and others. By geography, the market is analyzed across North America, Europe, Asia-Pacific, the Middle East and Africa, and South America. The report also covers the estimated market sizes and trends for 17 countries across major regions globally. The report offers market sizes and forecasts in terms of value (USD) for the above segments.
| Oral Nutritional Supplements |
| Tube-Fed Enteral Nutrition |
| Parenteral Nutrition |
| Others |
| Standard Nutrition |
| Specialized Nutrition |
| Disease-Specific Nutrition |
| Elemental and Semi-Elemental Nutrition |
| Modular Nutrition |
| Medical Foods for Inborn Errors of Metabolism |
| Malnutrition and Disease-Related Malnutrition |
| Oncology |
| Diabetes |
| Gastrointestinal Diseases |
| Neurological Diseases |
| Renal Diseases |
| Respiratory Diseases |
| Cardiovascular Diseases |
| Liver Diseases |
| Others |
| Neonates |
| Infants |
| Children |
| Adults |
| Older Adults |
| Hospitals and Ambulatory Surgical Centers |
| Homecare Settings |
| Nursing Homes and Senior Homes |
| Specialty Clinics |
| Rehabilitation Centers |
| Others |
| Hospital Pharmacies |
| Retail Pharmacies |
| E-Commerce |
| Others |
| North America | United States |
| Canada | |
| Mexico | |
| Europe | Germany |
| United Kingdom | |
| France | |
| Italy | |
| Spain | |
| Rest of Europe | |
| Asia-Pacific | China |
| India | |
| Japan | |
| Australia | |
| South Korea | |
| Rest of Asia-Pacific | |
| Middle East and Africa | GCC |
| South Africa | |
| Rest of Middle East and Africa | |
| South America | Brazil |
| Argentina | |
| Rest of South America |
| By Product and Route of Administration | Oral Nutritional Supplements | |
| Tube-Fed Enteral Nutrition | ||
| Parenteral Nutrition | ||
| Others | ||
| By Nutrition Type | Standard Nutrition | |
| Specialized Nutrition | ||
| Disease-Specific Nutrition | ||
| Elemental and Semi-Elemental Nutrition | ||
| Modular Nutrition | ||
| Medical Foods for Inborn Errors of Metabolism | ||
| By Therapeutic Area | Malnutrition and Disease-Related Malnutrition | |
| Oncology | ||
| Diabetes | ||
| Gastrointestinal Diseases | ||
| Neurological Diseases | ||
| Renal Diseases | ||
| Respiratory Diseases | ||
| Cardiovascular Diseases | ||
| Liver Diseases | ||
| Others | ||
| By Age Group | Neonates | |
| Infants | ||
| Children | ||
| Adults | ||
| Older Adults | ||
| By End User | Hospitals and Ambulatory Surgical Centers | |
| Homecare Settings | ||
| Nursing Homes and Senior Homes | ||
| Specialty Clinics | ||
| Rehabilitation Centers | ||
| Others | ||
| By Distribution Channel | Hospital Pharmacies | |
| Retail Pharmacies | ||
| E-Commerce | ||
| Others | ||
| By Geography | North America | United States |
| Canada | ||
| Mexico | ||
| Europe | Germany | |
| United Kingdom | ||
| France | ||
| Italy | ||
| Spain | ||
| Rest of Europe | ||
| Asia-Pacific | China | |
| India | ||
| Japan | ||
| Australia | ||
| South Korea | ||
| Rest of Asia-Pacific | ||
| Middle East and Africa | GCC | |
| South Africa | ||
| Rest of Middle East and Africa | ||
| South America | Brazil | |
| Argentina | ||
| Rest of South America | ||
Key Questions Answered in the Report
What is the size of the nutrition therapy market?
The Nutrition therapy market is valued at USD 59.21 billion in 2026 and is projected to reach USD 80.74 billion by 2031, at a 6.40% CAGR.
Which product category leads nutrition therapy demand?
Oral Nutritional Supplements led demand with a 45.66% share in 2025 and are forecast to grow at an 8.56% CAGR through 2031.
What is driving demand for clinical nutrition products?
Aging, disease-related malnutrition, chronic illness, cancer care, GLP-1-associated nutritional needs, and homecare adoption are expanding demand.
Which therapeutic area is growing fastest?
Gastrointestinal Diseases are projected to grow at a 7.93% CAGR through 2031, supported by evidence for enteral nutrition in Crohn's disease.
Which region is growing fastest for nutrition therapy?
Asia-Pacific is projected to grow at an 8.59% CAGR from 2026 to 2031, driven by aging populations and wider clinical nutrition coverage.
How is homecare changing clinical nutrition delivery?
Homecare Settings are projected to grow at a 9.45% CAGR through 2031, which increases demand for ready-to-use products, digital support, and reliable fulfillment.