Market Overview
| Study Period | 2021 - 2031 |
|---|---|
| Forecast Data Period | 2026 - 2031 |
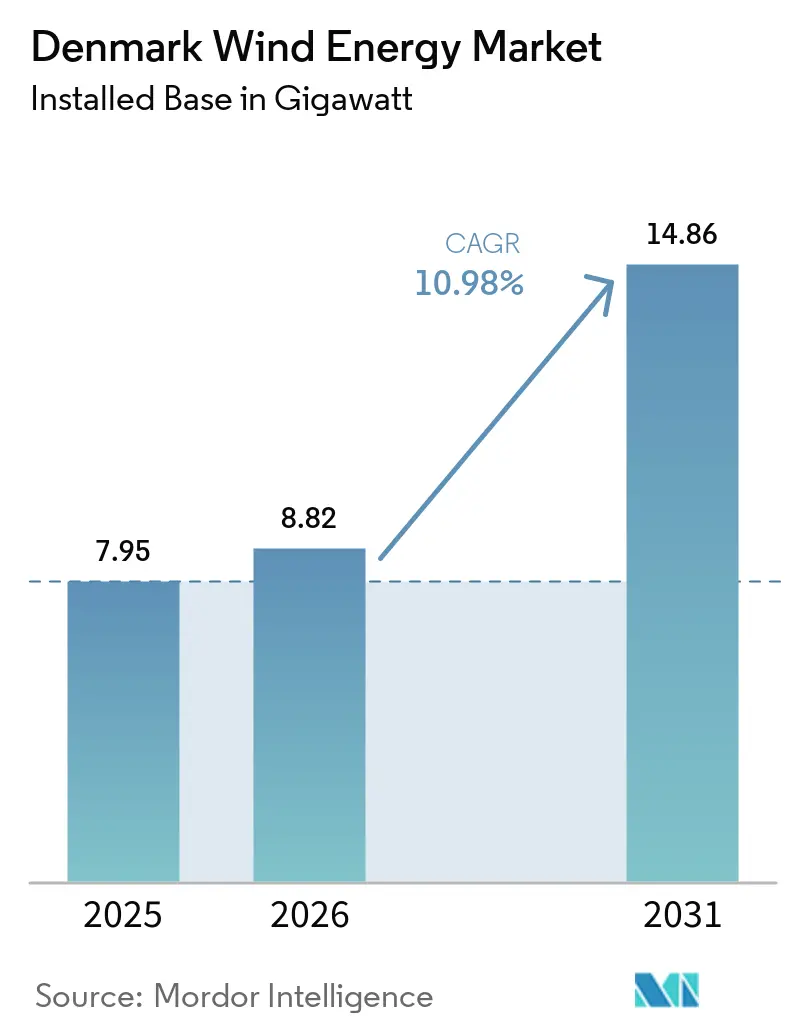
| Base Year Market Size (2025) | 7.95 gigawatt |
| Market Volume (2026) | 8.82 gigawatt |
| Market Volume (2031) | 14.86 gigawatt |
| Growth Rate (2026 - 2031) | 10.98% CAGR |
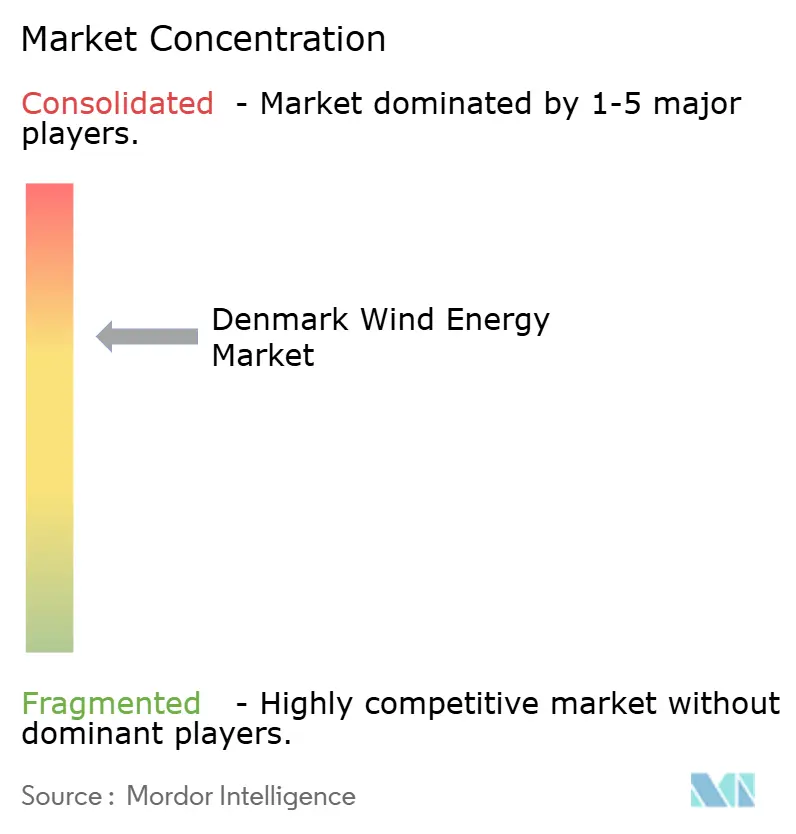
| Market Concentration | Medium |
Major Players *Disclaimer: Major Players sorted in no particular order Image © Mordor Intelligence. Reuse requires attribution under CC BY 4.0. | |
Denmark Wind Energy Market Analysis by Mordor Intelligence
The Denmark Wind Energy Market size in terms of installed base is expected to grow from 7.95 gigawatt in 2025 to 8.82 gigawatt in 2026 and is forecast to reach 14.86 gigawatt by 2031 at 10.98% CAGR over 2026-2031.
A supportive policy mix that includes a 12 GW offshore-wind tender pipeline, a new CO₂ tax, and the lowest levelized cost of energy in the European Union underpins the sector’s momentum. The maturing onshore fleet is now being repowered with larger machines, while energy-island hubs in the North and Baltic Seas open export routes that de-risk long-term cash flows. Corporate power-purchase agreements from data-center operators and heavy industry intensify demand, and Denmark’s extensive OEM and component supply chain keeps delivery costs competitive. Nonetheless, grid congestion, permitting delays, and a shortage of offshore installation vessels weigh on near-term build-out schedules.
Key Report Takeaways
- By location, onshore wind leads with 64.50% revenue share in 2025, and the same is projected to expand at 11.28% CAGR through 2031.
- By turbine capacity, up to 3 MW turbines captured 47.95% of the Denmark wind energy market share in 2025; above 6 MW turbines are forecast to rise at an 17.95% CAGR to 2031.
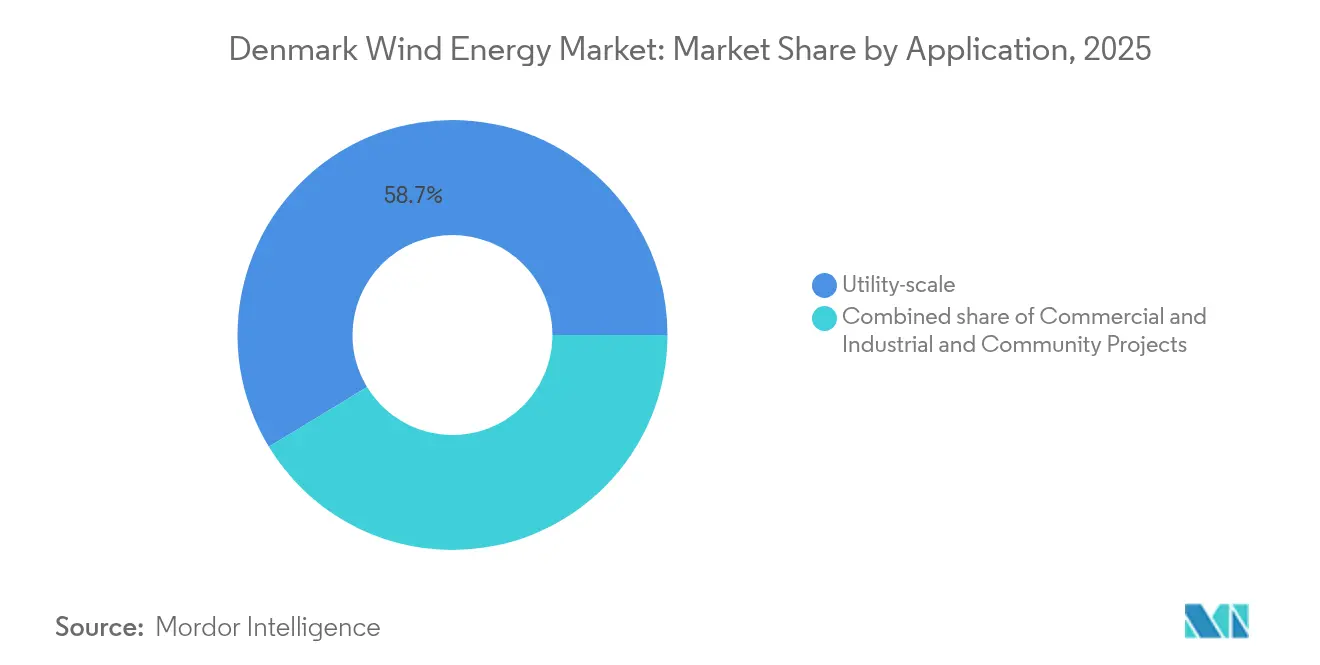
- By application, utility-scale accounted for a 58.70% share of the Denmark wind energy market size in 2025, while industrial and commercial users are advancing at a 17.24% CAGR through 2031.
Note: Market size and forecast figures in this report are generated using Mordor Intelligence’s proprietary estimation framework, updated with the latest available data and insights as of 2026.
Denmark Wind Energy Market Trends and Insights
Drivers Impact Analysis*
| Driver | (~) % Impact on CAGR Forecast | Geographic Relevance | Impact Timeline |
|---|---|---|---|
| Aggressive offshore-wind tenders through 2030 | +3.2% | National, North Sea and Baltic zones | Long term (≥ 4 years) |
| Lowest LCOE in EU due to mature supply base | +2.1% | National, Nordic trade links | Medium term (2-4 years) |
| Surging corporate-PPA demand | +2.5% | Greater Copenhagen, Jutland | Medium term (2-4 years) |
| EU & Danish CO₂-pricing incentives | +1.8% | Nationwide | Long term (≥ 4 years) |
| Energy-Island hybrid hubs | +1.4% | Bornholm, North Sea | Long term (≥ 4 years) |
| Onshore repowering of pre-2005 turbines | +1.3% | Jutland, coastal districts | Short term (≤ 2 years) |
| Source: Mordor Intelligence | |||
Aggressive Offshore-Wind Tenders Through 2030
Denmark reset its build-out trajectory after canceling a 6 GW auction in December 2024, then relaunched a scaled-back 3 GW tender in May 2025, bundled with state subsidies. The policy pivot favors bankable projects over headline volumes and places larger execution risk on developers. RWE’s 1.1 GW Thor field, green-lighted in October 2024, anchors this pragmatism with 72 Siemens Gamesa SG 14-236 DD turbines scheduled for 2025-2027 installation. Energy-Island concepts at Bornholm and in the North Sea add a hybrid layer by combining offshore wind, battery storage, and HVDC export lines to Germany, the Netherlands, and the UK. A December 2024 240 MW permit award further signals that smaller increments will run parallel to marquee auctions, emphasizing delivery certainty over ambitious megawatt targets.
Lowest LCOE in EU Due to Mature OEM & Supply Base
Three decades of domestic turbine manufacturing keep Denmark’s LCOE among Europe’s lowest. Vestas assembled and installed its V236-15 MW prototype at Thyborøn in March 2024, leveraging short transport routes and specialized ports that minimize logistics costs.[1]Danish Energy Agency, “Technology Catalogue 2030,” ens.dk Siemens Gamesa’s Danish nacelle plants apply similar proximity advantages, while Esbjerg port streamlines offshore component pre-assembly for the Thor project. The result is a 10-15% cost edge versus markets that import equipment over longer supply chains. Competing hubs in the Netherlands and Scotland are closing the gap, yet Denmark remains the preferred test bed for >15 MW platforms ahead of wider European rollout.
Surging Corporate-PPA Demand From Data Centers & Industry
Data-center electricity needs are forecast to hit 6 TWh annually by 2026, equivalent to one-fifth of national demand, spurring a wave of long-term PPAs. Microsoft’s agreement with European Energy, STARK Group’s 132 GWh annual PPA inked in September 2024, and Ørsted’s portfolio serving Amazon, Danfoss, and TSMC show how corporates underwrite fresh capacity. Eurowind Energy paired an 85 MW hybrid park at GreenLab Skive with a 10-year offtake, bundling wind, solar, and storage to deliver a steadier load profile.[2]Eurowind Energy, “Annual Report 2024,” eurowind.dk Fixed-price contracts help developers mitigate captured-price volatility, accelerate final investment decisions, and diversify revenue away from tender-linked subsidies.
EU & Danish decarbonisation incentives / CO₂ taxation
Denmark’s escalating CO₂ levy, set to reach DKK 750 /t by 2030, lifts renewable competitiveness versus fossil generation.[3]Danish Ministry of Climate, Energy and Utilities, “Energy and Climate Outlook 2025,” klimaministeriet.dk The levy dovetails with EU Fit for 55 targets and the Carbon Border Adjustment Mechanism, tightening the economics for unabated thermal power. Variable renewable energy supplied 70% of Danish electricity in 2024, up from 63% in 2023, according to the IEA. While higher taxes favor wind, they also squeeze merchant margins during low-price, high-wind hours, nudging developers toward storage co-location or corporate contracts for price certainty.
Restraints Impact Analysis*
| Restraint | (~) % Impact on CAGR Forecast | Geographic Relevance | Impact Timeline |
|---|---|---|---|
| Grid bottlenecks and substation limits | -1.5% | Jutland, west coast | Medium term (2-4 years) |
| Lengthy permitting and local opposition | -0.9% | Rural municipalities | Short term (≤ 2 years) |
| Offshore installation-vessel shortage | -1.2% | National offshore zones | Medium term (2-4 years) |
| Captured-price erosion at high VRE share | -1.1% | Nationwide | Long term (≥ 4 years) |
| Source: Mordor Intelligence | |||
Grid Bottlenecks & Limited Substation Capacity
Energinet earmarked DKK 23 billion for backbone upgrades through 2030, yet substation capacity in Jutland still lags new connections, forcing developers to co-finance reinforcements that raise project capex by 10-15%.[4]Energinet, “Grid Development Plan 2030,” energinet.dk High VRE penetration stresses voltage control and reactive-power support, once handled by centralized fossil plants, leading to localized curtailment. Offshore assets connect via dedicated high-voltage substations, but onshore queues now exceed 18 months, prompting some developers to pivot toward repowering or hybrid options that require smaller incremental grid capacity.
Lengthy Permitting & Local Opposition for New Onshore Sites
Municipal approvals, avian studies, and noise assessments prolong onshore project lifecycles beyond five years, despite national carbon goals.[5]Danish Energy Agency, “Offshore Wind Permitting Portal,” ens.dk Community veto power over siting results in patchy geographic rollout; western Jutland councils approve projects faster than Zealand or Funen, where visual-impact concerns dominate. Developers increasingly propose revenue-sharing or community ownership to secure social license, yet these mechanisms dilute returns and add contractual complexity.
*Our forecasts treat driver/restraint impacts as directional, not additive. The impact forecasts reflect baseline growth, mix effects, and variable interactions.
Segment Analysis
By Location: Onshore Dominance, Offshore Scale Up
Onshore wind contributed 64.50% to the Denmark wind energy market in 2025, buoyed by the repowering of legacy fleets that leverage existing grid ties. The segment’s 11.28% CAGR to 2031 is underpinned by modular upgrade kits from Vestas and Siemens Gamesa, which reduce downtime and lower per-megawatt capital outlays. Although planning hurdles persist, community co-ownership schemes are easing local acceptance in high-resource municipalities. Offshore wind, despite a smaller base, benefits from 12 GW in pipeline tenders. RWE’s Thor project anchors near-term capacity, while Energy-Island hubs promise multi-country offtake flexibility that expands the Denmark wind energy market size beyond domestic demand. Vessel scarcity and subsidy realignments remain critical variables for final investment decisions.
The capital intensity of offshore projects commands larger balance sheets, attracting global utilities and infrastructure funds. Meanwhile, smaller developers gravitate toward onshore and community-scale arrays where capital barriers are lower. As grid-upgrade schedules solidify, the Denmark wind energy market could see offshore’s share surpass 40% post-2030, contingent on tender delivery and vessel availability.


By Turbine Capacity: Legacy Upgrades vs. Offshore Giants
Units up to 3 MW still represented 47.95% of Denmark's wind energy market share in 2025 because of early-mover deployments during the 1990s-2000s. Repowering will gradually erode that dominance as onshore sites adopt 4-6 MW platforms that improve capacity factors and reduce maintenance. Turbines above 6 MW enjoy the fastest growth at 17.95% CAGR, driven by offshore mega-projects like Thor and prototype installations such as Vestas's 15 MW V236 at Thyborøn. Larger rotors deliver >60% capacity factors in Danish waters, cutting foundation counts and installation days, even though they demand higher crane capacities.
As OEM roadmaps shift toward 18-20 MW machines for post-2030 rollouts, foundation design and grid-code compliance will remain bottlenecks. Denmark's R&D institutions, notably DTU, are already modeling 22 MW reference turbines to capture future scale efficiencies. Over time, the Denmark wind energy market size will increasingly concentrate in the super-large class offshore, while onshore caps out near 6 MW due to transport logistics.
By Application: PPA-Led Commercial & Industrial Uptick
Utility-scale assets held 58.70% of capacity in 2025, reflecting historic reliance on state auctions. Yet the commercial and industrial segment is growing faster, at 17.24% CAGR, as data-center developers and manufacturers seek fixed-price hedges under Scope 2 disclosure regimes. PPAs with Microsoft, STARK Group, and Amazon illustrate the breadth of demand. Hybrid parks bundling wind, solar, and batteries cater to load-matching needs, not solely energy volumes, thereby diversifying revenue streams for asset owners. Community projects remain niche, mostly because of limited financing depth and competition from larger entities that secure better equipment pricing.
A rising CO₂ price, volatile spot rates, and corporate net-zero targets position the C&I segment to reach 25-30% of the Denmark wind energy market by 2031. If grid-balancing markets mature, hybrid assets could additionally tap ancillary-service payments, providing another upside lever to the Denmark wind energy industry.
Geography Analysis
Denmark’s western Jutland coastline hosts the densest onshore fleet because of superior wind resources and immediate access to Esbjerg port logistics. Offshore zones in the North Sea and Baltic Sea benefit from shallow waters of 15-40 m, allowing cost-effective monopile foundations. The Viking Link interconnector enables west-to-east power flows, exporting surplus to the UK when domestic demand saturates. Bornholm’s planned Energy Island will serve as a cross-border hub, dispatching into Polish and German grids and producing green hydrogen for northern German industry clusters. This configuration amplifies the Denmark wind energy market size far beyond the country’s 35 TWh annual load.
Regional permitting differences influence build rates. Municipalities in western Jutland approve projects faster thanks to legacy familiarity and local economic gains, whereas Zealand and Funen see heightened opposition tied to tourism and visual impacts. Offshore projects sidestep some of these issues under centralized seabed leasing, but must coordinate with fishing routes and shipping lanes, particularly around the North Sea Energy Island. Should Germany and the Netherlands reach similar renewable penetration by 2030, export margins may shrink, escalating the need for domestic demand sinks such as hydrogen electrolyzers and industrial electrification.
Energinet’s transmission roadmap prioritizes 400 kV reinforcements and DKK 23 billion in substation upgrades, yet construction lags capacity additions. Curtailment incidents in West Jutland already signal localized oversupply. Developers, therefore, cluster new capacity near existing high-voltage nodes or in hybrid parks with storage that can soak up off-peak generation. Long-term, the Denmark wind energy industry will hinge on simultaneously scaling interconnections, storage, and industrial offtake to prevent stranded output when weather-driven surpluses coincide across Europe.
Competitive Landscape
Ørsted, Vestas, and Siemens Gamesa form the core triumvirate shaping Denmark’s supply chain, development pipeline, and technology roadmap. Ørsted’s domestic and international assets support a diversified cash-flow base, yet its late-2024 sale of four UK offshore stakes to Brookfield underscores capital-allocation pressures in a higher-rate environment. Vestas leverages its Danish facilities as a proving ground for 15 MW class machines, gaining first-mover learning-curve advantages before scaling to other regions. Siemens Gamesa, while restructuring post-merger, secured the Thor turbine contract, reflecting sustained offshore competitiveness. Second-tier players, including Copenhagen Infrastructure Partners and Eurowind Energy, expand distributed and hybrid models that bypass congested grid nodes and minimize merchant risk through long-term PPAs.
Service and technology niches are widening. Reblade’s AI-driven drone inspections, DecomBlades’ recycling pilots, and DTU spin-offs offering advanced control algorithms highlight a transition from greenfield growth to asset-optimization rivalry. Blade recycling projects matter as thousands of pre-2005 units near decommissioning. Market entry barriers decrease for software-centric offerings, while capital-intensive manufacturing remains concentrated among incumbent OEMs. Overall, the Denmark wind energy market shows moderate concentration, with the top three players controlling an estimated 60-70% of combined capacity and service revenues.
Denmark Wind Energy Industry Leaders
Orsted AS
Vattenfall AB
Vestas Wind Systems A/S
Copenhagen Infrastructure Partners
RWE Renewables
- *Disclaimer: Major Players sorted in no particular order

Recent Industry Developments
- May 2025: Denmark agreed on three new offshore projects totalling 3 GW, adding state-backed revenue guarantees to de-risk construction.
- May 2025: Ørsted reported operational earnings uplift from Gode Wind 3 but discontinued Hornsea 4 owing to rising costs.
- April 2025: Vattenfall reached FID on Nordlicht 1&2 and signed a 450 GWh PPA with LyondellBasell.
- March 2025: Vestas received a gigawatt-scale order for 15 MW turbines for Nordlicht 1&2, including a five-year service pact.


Denmark Wind Energy Market Report Scope
The Denmark wind energy market report include:
By Location
| Onshore |
| Offshore |
By Turbine Capacity
| Up to 3 MW |
| 3 to 6 MW |
| Above 6 MW |
By Application
| Utility-scale |
| Commercial and Industrial |
| Community Projects |
By Component (Qualitative Analysis)
| Nacelle/Turbine |
| Blade |
| Tower |
| Generator and Gearbox |
| Balance-of-System |
| By Location | Onshore |
| Offshore | |
| By Turbine Capacity | Up to 3 MW |
| 3 to 6 MW | |
| Above 6 MW | |
| By Application | Utility-scale |
| Commercial and Industrial | |
| Community Projects | |
| By Component (Qualitative Analysis) | Nacelle/Turbine |
| Blade | |
| Tower | |
| Generator and Gearbox | |
| Balance-of-System |


Key Questions Answered in the Report
How large is the Denmark wind energy market in 2026?
Capacity reaches about 8.82 GW in 2026, tracking toward 14.86 GW by 2031.
What is the expected CAGR for Danish wind capacity through 2031?
The market is forecast to grow at 10.98% CAGR over the 2026-2031 period.
Why did Denmark scale back its 6 GW offshore tender?
The government cited unsustainable subsidy demands and relaunched a 3 GW auction with revised financial support in 2025.
Which turbine size class is growing the fastest?
Turbines above 6 MW, driven by offshore projects, are advancing at an 17.95% CAGR.
How are corporate PPAs influencing new projects?
Data-center and industrial buyers lock in long-term fixed prices, reducing merchant risk and boosting the commercial and industrial segment’s 17.24% CAGR.
What challenges limit new onshore wind farms?
Grid congestion, lengthy municipal permitting, and local opposition extend timelines beyond five years and inflate costs.
Page last updated on:


