Market Overview
| Study Period | 2021 - 2031 |
|---|---|
| Forecast Data Period | 2025 - 2031 |
| Historical Data Period | 2021 - 2024 |
| Market Size (2026) | USD 511.92 Million |
| Market Size (2031) | USD 633.68 Million |
| Growth Rate (2025 - 2031) | 4.36% CAGR |
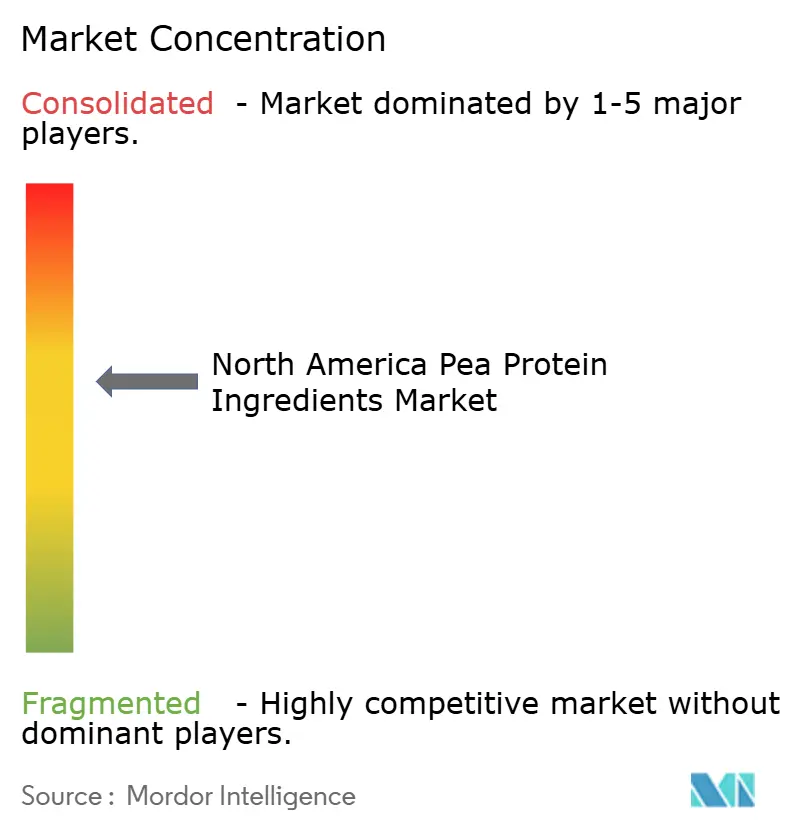
| Market Concentration | Medium |
Major Players
*Disclaimer: Major Players sorted in no particular order Image © Mordor Intelligence. Reuse requires attribution under CC BY 4.0. |
|

North America Pea Protein Ingredients Market Analysis by Mordor Intelligence
The North America Pea Protein Ingredients Market was valued at USD 511.92 million in 2026 and is projected to reach USD 633.68 million by 2031, registering a compound annual growth rate (CAGR) of 4.36% during the forecast period. This growth is primarily driven by the increasing shift toward plant-based nutrition, as consumers prioritize protein sources that align with health, sustainability, and ethical values. Pea protein has gained significant popularity due to its plant-based origin, hypoallergenic properties, and versatility in food, feed, and nutrition applications. It serves as a preferred alternative to animal-based and allergen-intensive proteins. The rising adoption of vegan and flexitarian diets, coupled with the growing trend of protein fortification in everyday foods and supplements, continues to expand the market's potential consumer base.
Key Report Takeaways
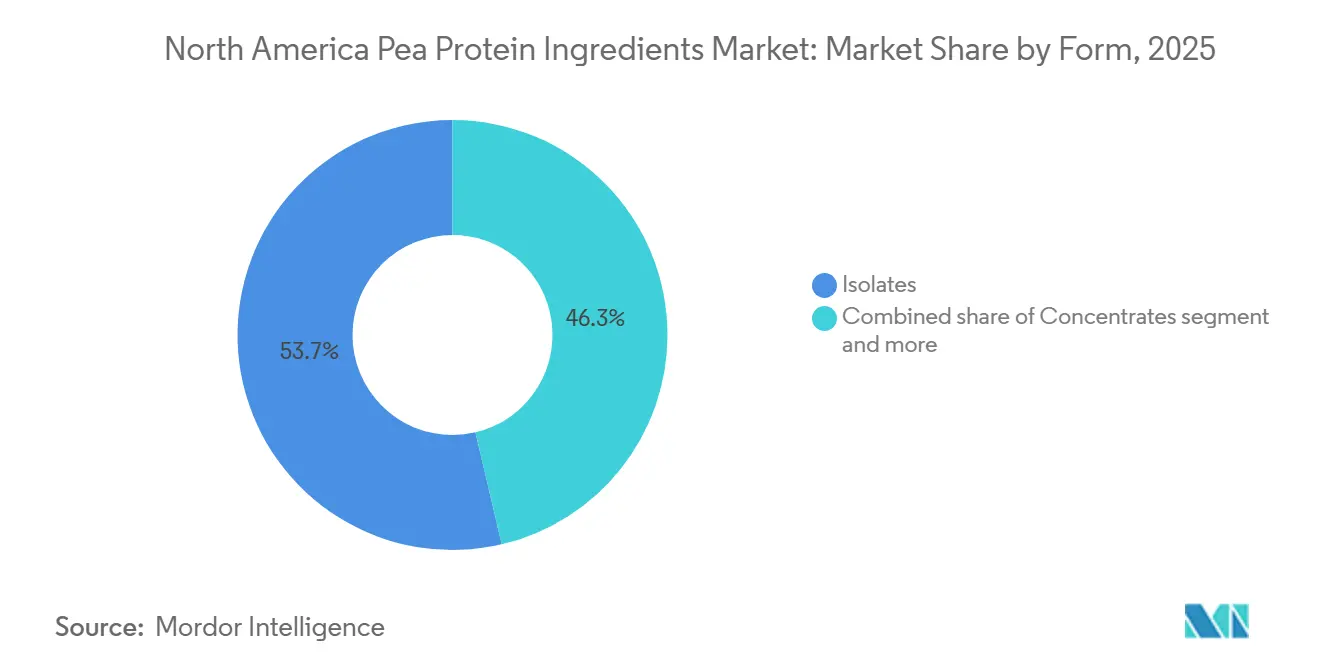
- By form, isolates held 53.68% of the North America pea protein ingredients market share in 2025, and concentrates are forecast to log the fastest 4.67% CAGR through 2031.
- By nature, conventional products accounted for 76.54% of revenue in 2025, whereas organic variants are projected to grow at 5.78% a year.
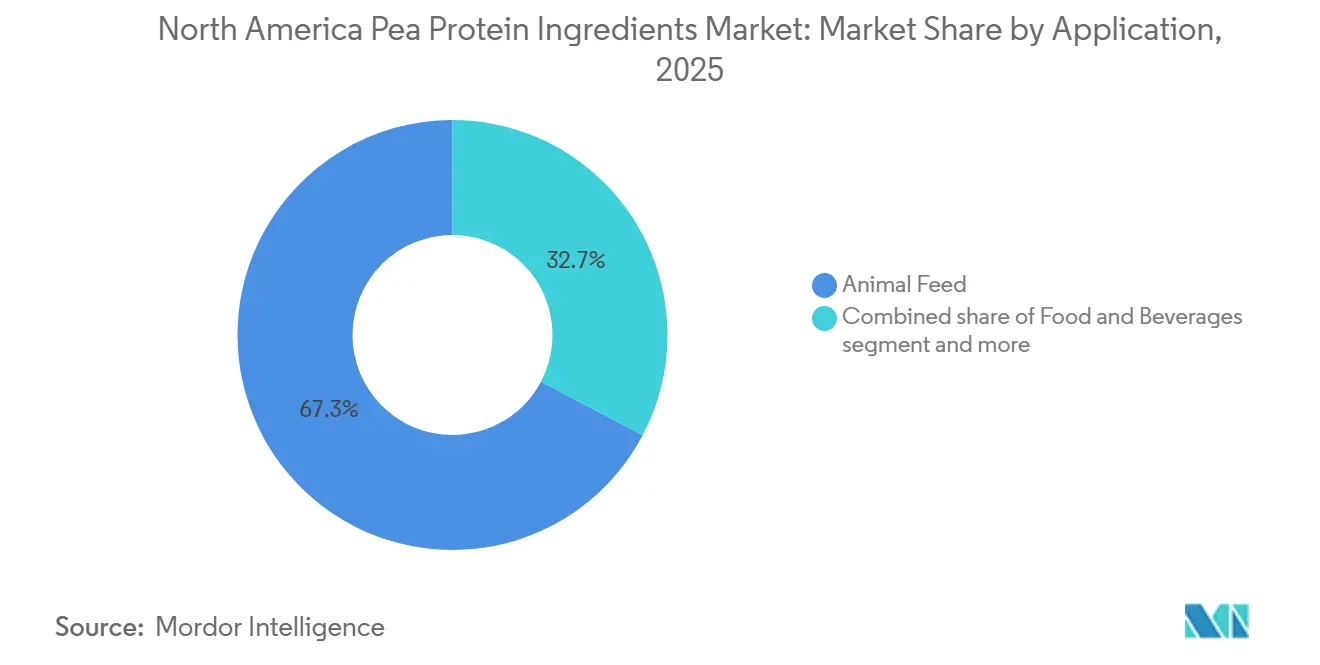
- By application, animal feed represented 67.28% of the North America pea protein ingredients market size in 2025, and supplements are expected to expand at a 5.91% CAGR to 2031.
- By geography, the United States generated 69.23% of 2025 revenue, while Mexico is set for a 6.06% CAGR through 2031.
Note: Market size and forecast figures in this report are generated using Mordor Intelligence’s proprietary estimation framework, updated with the latest available data and insights as of January 2026.
North America Pea Protein Ingredients Market Trends and Insights
Drivers Impact Analysis*
| Driver | (~) % Impact on CAGR Forecast | Geographic Relevance | Impact Timeline |
|---|---|---|---|
| Technological advancements in extraction and processing | +1.2% | United States, Canada, with early adoption in food-processing hubs (California, Illinois, Manitoba) | Medium term (2-4 years) |
| Consumer preference for clean and transparent labeling | +0.9% | United States, Canada, Mexico, strongest in urban centers and natural/organic retail channels | Short term (≤ 2 years) |
| Rising vegan and flexitarian diet adoption | +0.8% | United States, Canada, with spillover to urban Mexico (Mexico City, Guadalajara, Monterrey) | Medium term (2-4 years) |
| Rising focus on sustainability and lower environmental footprint | +0.7% | North America-wide, strongest in United States West Coast, British Columbia, and institutional foodservice sectors | Long term (≥ 4 years) |
| Superior emulsification, foaming, gelling, and thickening properties | +0.6% | United States, Canada, particularly in dairy alternatives and meat analog manufacturing regions | Short term (≤ 2 years) |
| Expansion of meat substitutes and dairy alternatives | +1.0% | United States, Canada, urban Mexico, concentrated in refrigerated and frozen plant-based food categories | Medium term (2-4 years) |
| Source: Mordor Intelligence | |||
Technological advancements are driving the market
Technological advancements are a key driver for the pea protein ingredients market, significantly improving product quality, functionality, and application potential. Continuous progress in protein extraction and fractionation technologies, including advanced wet and dry processing methods, is achieving higher protein yields while maintaining nutritional integrity. Techniques such as enzymatic hydrolysis, membrane filtration, and controlled thermal processing are enhancing solubility, dispersibility, and digestibility, while effectively minimizing off-flavors and grittiness traditionally associated with pea protein. These developments enable the seamless incorporation of pea protein into high-protein beverages, meat alternatives, dietary supplements, and specialized nutrition products, where sensory performance and consistency are essential. Additionally, technology-driven customization, such as application-specific isolates and concentrates with improved heat stability, emulsification, or water-binding properties, allows manufacturers to meet diverse formulation needs.
Consumer preference for clean and transparent labeling
Consumer preference for clean and transparent labeling is a significant driver for the pea protein ingredients market. Shoppers are increasingly examining ingredient lists and favoring products marketed as natural, organic, minimally processed, and free from artificial additives. Pea protein meets these expectations due to its plant-based origin, non-GMO status, allergen-friendly nature, and compatibility with short, easily recognizable ingredient lists. This makes it a preferred choice for clean-label reformulation in food, beverage, and nutrition products. The shift is further reinforced by evolving consumer perceptions of health and wellness. For example, according to the International Food Information Council (IFIC), in 2024, 36% of Americans actively sought foods labeled as natural, organic, or healthy, underscoring the growing impact of transparent labeling on purchasing decisions [1]Source: International Food Information Council (IFIC), "2024 IFIC Food & Health SURVEY", ific.org. As brands reformulate products to eliminate synthetic ingredients and enhance label clarity, pea protein is increasingly adopted as a reliable protein source that supports clean-label claims without compromising functionality.
Rising vegan and flexitarian diet adoption
The increasing adoption of vegan and flexitarian diets is a key driver for the growth of the pea protein ingredients market. Consumers are progressively transitioning to plant-based eating habits due to health, ethical, and environmental considerations. Pea protein has gained prominence as a preferred protein source in these diets because of its complete amino acid profile, plant-based origin, and allergen-friendly properties. These characteristics make it suitable for various meat, dairy, and egg alternative products. As flexitarian consumers aim to reduce animal protein consumption without compromising nutrition or taste, food manufacturers are reformulating products to incorporate pea protein in meat substitutes, plant-based dairy alternatives, protein snacks, and nutritional beverages. The ingredient's versatility, neutral flavor, and functional properties allow brands to replicate familiar textures and sensory experiences while meeting the expectations of vegan and flexitarian consumers.
Rising focus on sustainability and lower environmental footprint
The growing emphasis on sustainability and reducing environmental impact is driving the market, as both food manufacturers and consumers increasingly prioritize ingredients produced through environmentally responsible methods and resource-efficient practices. Pea protein is recognized for its lower greenhouse gas emissions, reduced water consumption, and its role in supporting soil health through nitrogen fixation, compared to many animal-based protein sources. These sustainability benefits position pea protein as a preferred option for brands aiming to achieve corporate sustainability objectives, meet ESG commitments, and adhere to responsible sourcing standards, all while maintaining nutritional value and functionality. As companies in the food, feed, and nutrition industries intensify efforts to minimize their environmental footprint, pea protein is being increasingly utilized in plant-based formulations and hybrid products to reduce dependence on animal proteins.
Restraints Impact Analysis*
| Restraint | (~) % Impact on CAGR Forecast | Geographic Relevance | Impact Timeline |
|---|---|---|---|
| Competition from other plant proteins (soy, rice, hemp) | -0.8% | United States, Canada, particularly in price-sensitive animal feed and commodity food applications | Short term (≤ 2 years) |
| Supply chain disruptions and geographic concentration in Saskatchewan | -0.5% | Canada (Saskatchewan, Manitoba), with cascading effects on United States processors and Mexican importers | Short term (≤ 2 years) |
| Sensory and taste limitations (beany notes, chalky mouthfeel) | -0.6% | United States, Mexico, most acute in unflavored beverages and lightly flavored sports nutrition products | Medium term (2-4 years) |
| Regulatory and labeling hurdles across jurisdictions | -0.3% | United States (state-level variance), Mexico (pending COFEPRIS guidance), Canada (bilingual requirements) | Medium term (2-4 years) |
| Source: Mordor Intelligence | |||
Competition from other plant proteins
Competition from other plant proteins serves as a significant restraint on the pea protein ingredients market. Formulators have access to a growing variety of alternative protein sources, including soy, fava bean, chickpea, lentil, rice, oat, and mycoprotein. Many of these alternatives benefit from established supply chains, well-known functionality, or cost and performance advantages in specific applications, which can hinder the adoption of pea protein. For example, soy protein remains popular due to its high protein content and strong functional properties, while newer options like fava bean and chickpea are gaining attention for their improved flavor profiles and perceived sustainability benefits. Furthermore, certain plant proteins offer better solubility, emulsification, or amino acid completeness for specific applications, encouraging manufacturers to use multi-protein blends instead of relying exclusively on pea protein. This increasingly competitive environment adds complexity to formulations and slows market penetration in certain segments.
Supply chain disruptions
Supply chain disruptions pose a significant restraint for the pea protein ingredients market, as the availability and consistency of raw materials depend heavily on agricultural yields, seasonal variations, and processing capacity. Pea protein production requires stable harvests and efficient logistics across farming, storage, and fractionation stages. Disruptions caused by climate variability, transportation delays, labor shortages, or processing interruptions can result in irregular supply and quality inconsistencies. This instability complicates long-term sourcing strategies for food, feed, and nutrition manufacturers, particularly those needing consistent functional performance and standardized protein specifications. Furthermore, delays in cross-border trade and limited processing infrastructure in certain regions hinder timely delivery and scale-up, increasing formulation challenges for manufacturers.
*Our forecasts treat driver/restraint impacts as directional, not additive. The impact forecasts reflect baseline growth, mix effects, and variable interactions.
Segment Analysis
By Form: Isolates Anchor Premium Applications
Pea protein isolates, which held a 53.68% market share in 2025, are transitioning from a functional protein source to a highly refined, application-focused ingredient, driving innovation in the pea protein ingredients market. This dominance is attributed to their compatibility with high-protein, low-carbohydrate formulations, where food and nutrition manufacturers emphasize neutral flavor, rapid solubility, and consistent performance. Technological advancements in wet fractionation, membrane filtration, and enzymatic processing are enhancing taste neutrality, dispersibility, and mouthfeel. These improvements address earlier challenges such as beany off-notes and sedimentation, making isolates a preferred choice for diverse applications, including plant-based beverages, protein bars, and meat alternatives.
Pea protein concentrates, projected to grow at a 4.67% CAGR through 2031, are emerging as a cost-effective and versatile alternative in the pea protein ingredients market. They are particularly suited for applications prioritizing moderate protein enrichment, texture enhancement, and clean-label appeal over ultra-high protein purity. Their growth is fueled by increasing demand for whole-food-style formulations that retain more of the pea’s native components, aligning with consumer preferences for minimally processed and naturally derived ingredients. Innovations in dry fractionation and gentle processing techniques are improving flavor profiles and functional consistency, reducing bitterness while preserving fiber-related benefits such as satiety and digestive support.


By Nature: Organic Premiums Drive Niche Growth
Conventional pea protein, which accounted for a dominant 76.54% share in 2025, remains a key component in the pea protein ingredients market due to its widespread availability, consistent functional properties, and versatility in high-volume food and nutrition applications. This dominance is attributed to its strong suitability for mainstream product categories, where manufacturers prioritize reliable supply, standardized quality, and predictable processing characteristics. Conventional pea protein benefits from a well-established agricultural and processing infrastructure, ensuring stable raw material sourcing and scalable production. This supports its extensive use in both industrial and foodservice formulations.
Organic pea protein, projected to grow at a 5.78% CAGR through 2031, is emerging as a high-value segment within the pea protein ingredients market, driven by increasing demand for certified organic, clean-label, and transparently sourced ingredients. Its growth is fueled by rising adoption in premium plant-based foods, organic nutritional supplements, infant nutrition, and natural health products, where certification credibility and ingredient traceability play a significant role in brand differentiation. Manufacturers are increasingly utilizing organic pea protein to support claims related to free-from attributes and sustainability, including non-GMO, pesticide-free, and environmentally responsible farming practices. These attributes appeal to health-conscious and environmentally aware consumers.
By Application: Feed Dominance Meets Supplement Momentum
Animal feed, which accounted for a significant 67.28% share in 2025, highlights pea protein's essential role as a nutritionally efficient, plant-based protein source across livestock, aquaculture, and pet nutrition segments. This dominance is attributed to its strong digestibility, favorable amino acid profile, and functional versatility, making it suitable for feed formulations for poultry, swine, ruminants, fish, and companion animals. Pea protein is increasingly used as a partial replacement for soy meal and animal-derived proteins, enabling feed formulators to diversify protein sources while maintaining key performance metrics such as growth rates, feed conversion efficiency, and gut health. Its low allergen profile and reduced anti-nutritional factors, compared to some traditional plant proteins, further support its adoption, particularly in aquafeed and premium pet food formulations.
Supplements, projected to grow at a 5.91% CAGR through 2031, are emerging as a dynamic application segment for pea protein ingredients, driven by the increasing adoption of fitness, wellness, and active lifestyles. This growth is closely tied to rising participation in structured fitness activities. For example, according to the Health & Fitness Association, nearly 77 million Americans utilized fitness facilities in 2024, underscoring the large consumer base seeking protein supplementation to support muscle recovery, endurance, and overall health [2]Source: Health & Fitness Association, "2025 US Health & Fitness Consumer Report" healthandfitness.org. Pea protein is gaining popularity in dietary supplements due to its plant-based origin, high digestibility, and hypoallergenic properties, making it suitable for a wide range of consumers, including vegans, lactose-intolerant individuals, and those avoiding soy or whey proteins.
Geography Analysis
The United States, which accounted for a dominant 69.23% market share in 2025, represents the most mature and commercially advanced market for pea protein ingredients in North America. This leadership is attributed to the country’s well-established food and beverage processing infrastructure, the strong presence of global ingredient suppliers, and clear regulatory and labeling frameworks that facilitate the rapid commercialization of plant-based proteins. The United States market benefits from the extensive use of pea protein across animal feed, food manufacturing, dietary supplements, and sports nutrition. This is supported by robust Research and Development (R&D) capabilities and close collaboration between ingredient suppliers and brand owners.
Mexico, projected to grow at a 6.06% CAGR through 2031, is emerging as the fastest-growing market in the region, driven by structural changes in food consumption and manufacturing. Factors such as rapid urbanization, increasing exposure to modern retail formats, and the expansion of localized manufacturing of plant-based dairy alternatives and fortified foods are accelerating the adoption of pea protein ingredients. Mexico is also benefiting from growing investments by multinational food companies aiming to establish regional production hubs, which enable easier access to plant-based ingredients and reduce reliance on imports. As domestic food and beverage producers increasingly incorporate pea protein into affordable, mass-market products, Mexico is expected to play an increasingly significant role in driving regional volume growth over the forecast period.
Canada holds a strategically important position in the North American pea protein market, primarily due to its dominance in upstream pea cultivation and processing. According to the Saskatchewan Pulse Growers, Canada is one of the world’s leading producers of yellow peas, providing a reliable and high-quality raw material base that supports both domestic consumption and exports. In 2023/24, Canadian production consisted of 86% yellow peas, 11% green peas, and 3% other types [3]Source: Saskatchewan Pulse Growers, "Pea Market Opportunities", saskpulse.com. This upstream strength enhances supply security for the region and supports long-term growth by ensuring consistent quality, traceability, and scalability across food, feed, and nutrition applications.
Competitive Landscape
The North American pea protein ingredients market demonstrates moderate concentration, with a mix of large, diversified ingredient suppliers and a growing number of regional and application-focused players. Key companies such as Archer Daniels Midland Company, Bunge Global SA, Cargill, Incorporated, Glanbia PLC, and Ingredion Incorporated dominate the market. These companies leverage extensive access to raw materials, global processing networks, and strong relationships with manufacturers in the food, feed, and nutrition industries. Their competitive advantage is further enhanced by economies of scale, vertically integrated supply chains, and comprehensive product portfolios, including isolates, concentrates, and texturized proteins, catering to both high-volume and specialized applications.
Technology adoption has become a critical factor in maintaining competitiveness. Leading players are making significant investments in advanced technologies such as fractionation, enzymatic treatment, and flavor-masking to enhance the solubility, taste neutrality, and functional consistency of pea protein ingredients. Innovation in application-specific solutions, such as heat-stable isolates for beverages, high-water-binding concentrates for meat alternatives, and digestibility-enhanced proteins for animal feed, enables companies to differentiate their offerings beyond pricing. Additionally, strategic partnerships, co-development agreements with food brands, and the expansion of Research and Development (R&D) centers bolster their market position by accelerating the commercialization of customized formulations that align with the growing demand for clean-label and plant-based products.
New opportunities are arising in niche segments such as hypoallergenic infant formula, elderly and clinical nutrition, and aquaculture feed. These areas are experiencing increased demand for highly digestible, allergen-free, and nutritionally precise protein sources. Both established players and smaller innovators have the potential to develop high-value, specialized pea protein solutions with tailored amino-acid profiles and functional attributes to meet these needs. As competition intensifies, companies are shifting their focus toward premiumization, sustainability, and application-driven innovation rather than solely pursuing volume expansion. This approach is shaping a competitive landscape that balances the advantages of scale with technological and nutritional differentiation.
North America Pea Protein Ingredients Industry Leaders
-
Archer Daniels Midland Company
-
Bunge Global SA
-
Cargill, Incorporated
-
Glanbia PLC
-
Ingredion Incorporated
- *Disclaimer: Major Players sorted in no particular order

Recent Industry Developments
- January 2025: Axiom Foods has launched Vegotein N Neutral, a pea protein ingredient, to address the growing demand for pea protein in the market. It contains 80% protein concentration and is fully digestible. The ingredient is produced using yellow non-GMO peas grown in North America.
- December 2024: Burcon NutraScience Corporation introduced PeazazzC, a clean-tasting pea protein developed for the expanding plant-based protein market. Derived from North American non-GMO field peas, it is suitable for various applications, including beverages, dairy alternatives, baked goods, and nutrition bars.
- July 2024: Ingredion Incorporated introduced its North American-grown and produced protein fortification product, VITESSENCE Pea 100 HD, a pea protein specifically designed for cold-pressed bars. This product helps maintain the softness of cold-pressed bars throughout their shelf life, enhances texture and sensory attributes, and adds nutritional value to meet consumer preferences.


North America Pea Protein Ingredients Market Report Scope
Pea protein is a high-quality, plant-based protein powder made from yellow split peas, popular in vegan, dairy-free, and allergen-friendly diets, valued for its digestibility, iron content, and essential amino acids. The North American pea protein ingredients are segmented by form, nature, application, and geography. By form, the market is segmented into concentrates, isolates, and textured/hydrolyzed. By nature, the market is segmented into conventional and organic. By application, the market is segmented into animal feed, personal care and cosmetics, food and beverages, and Supplements. By geography, the market is segmented into the United States, Canada, Mexico, and the rest of North America. The Market Forecasts are Provided in Terms of Value (USD) and Volume (Tons).
By Form
| Concentrates |
| Isolates |
| Textured/Hydrolyzed |
By Nature
| Conventional |
| Organic |
By Application
| Animal Feed | |
| Personal Care and Cosmetics | |
| Food and Beverages | Bakery |
| Beverages | |
| Breakfast Cereals | |
| Condiments/Sauces | |
| Dairy and Dairy Alternative Products | |
| Meat/Poultry/Seafood and Meat Alternative Products | |
| RTE/RTC Food Products | |
| Snacks | |
| Supplements | Baby Food and Infant Formula |
| Elderly Nutrition and Medical Nutrition | |
| Sport/Performance Nutrition |
By Geography
| United States |
| Canada |
| Mexico |
| Rest of North America |
| By Form | Concentrates | |
| Isolates | ||
| Textured/Hydrolyzed | ||
| By Nature | Conventional | |
| Organic | ||
| By Application | Animal Feed | |
| Personal Care and Cosmetics | ||
| Food and Beverages | Bakery | |
| Beverages | ||
| Breakfast Cereals | ||
| Condiments/Sauces | ||
| Dairy and Dairy Alternative Products | ||
| Meat/Poultry/Seafood and Meat Alternative Products | ||
| RTE/RTC Food Products | ||
| Snacks | ||
| Supplements | Baby Food and Infant Formula | |
| Elderly Nutrition and Medical Nutrition | ||
| Sport/Performance Nutrition | ||
| By Geography | United States | |
| Canada | ||
| Mexico | ||
| Rest of North America | ||


Market Definition
- End User - The Protein Ingredients Market operates on a B2B basis. Food, Beverages, Supplements, Animal Feed, and Personal Care & Cosmetic manufacturers are considered to be end-consumers in the market studied. The scope excludes manufacturers buying liquid/dry whey to be used for application as a binding agent or thickener or other non-protein applications.
- Penetration Rate - Penetration Rate is defined as the percentage of Protein-Fortified End User Market Volume in the Overall End User Market Volume.
- Average Protein Content - Average protein content is the average protein content present per 100 g of product manufactured by all end-user companies considered under the scope of this report.
- End User Market Volume - End-user market volume is the consolidated volume of all types and forms of end-user products in the country or region.
| Keyword | Definition |
|---|---|
| Alpha-lactalbumin (α-Lactalbumin) | It is a protein that regulates the production of lactose in the milk of almost all mammalian species. |
| Amino acid | It is an organic compound that contains both amino and carboxylic acid functional groups, which are required for the synthesis of body protein and other important nitrogen-containing compounds, such as creatine, peptide hormones, and some neurotransmitters. |
| Blanching | It is the process of briefly heating vegetables with steam or boiling water. |
| BRC | British Retail Consortium |
| Bread improver | It is a flour-based blend of several components with specific functional properties designed to modify dough characteristics and give quality attributes to bread. |
| BSF | Black Soldier Fly |
| Caseinate | It is a substance produced by adding an alkali to acid casein, a derivative of casein. |
| Celiac disease | Celiac disease is an immune reaction to eating gluten, a protein found in wheat, barley, and rye. |
| Colostrum | It is a milky fluid that’s released by mammals that have recently given birth before breast milk production begins. |
| Concentrate | It is the least processed form of protein and has a protein content ranging from 40-90% by weight. |
| Dry protein basis | It refers to the percentage of "pure protein" present in a supplement after the water in it is completely removed through heat. |
| Dry whey | It is the product resulting from drying fresh whey which has been pasteurized and to which nothing has been added as a preservative. |
| Egg protein | It is a mixture of individual proteins, including ovalbumin, ovomucoid, ovoglobulin, conalbumin, vitellin, and vitellenin. |
| Emulsifier | It is a food additive that facilitates the blending of foods that are immiscible with one another, such as oil and water. |
| Enrichment | It is the process of addition of micronutrients that are lost during the processing of the product. |
| ERS | Economic Research Service of the USDA |
| Extrusion | It is the process of forcing soft mixed ingredients through an opening in a perforated plate or die designed to produce the required shape. The extruded food is then cut to a specific size by blades. |
| Fava | Also known as Faba, it is another word for yellow split beans. |
| FDA | Food and Drug Administration |
| Flaking | It is a process in which typically a cereal grain (like corn, wheat, or rice) is broken down into grits, cooked with flavors and syrups, and then pressed into flakes between cooled rollers. |
| Foaming agent | It is a food ingredient that makes it possible to form or maintain a uniform dispersion of a gaseous phase in a liquid or solid food. |
| Foodservice | It refers to the part of the food industry which includes businesses, institutions, and companies which prepare meals outside the home. It includes restaurants, school and hospital cafeterias, catering operations, and many other formats. |
| Fortification | It is the deliberate addition of micronutrients that are not found in them naturally or which are lost during processing, to improve a food product's nutritional value. |
| FSANZ | Food Standards Australia New Zealand |
| FSIS | Food Safety and Inspection Service |
| FSSAI | Food Safety and Standards Authority of India |
| Gelling agent | It is an ingredient that functions as a stabilizer and thickener to provide thickening without stiffness through the formation of gel. |
| GHG | Greenhouse Gas |
| Gluten | It is a family of proteins found in grains, including wheat, rye, spelt, and barley. |
| Hemp | It is a botanical class of Cannabis sativa cultivars grown specifically for industrial or medicinal use. |
| Hydrolysate | It is a form of protein manufactured by exposing the protein to enzymes that can partially break the bonds between the protein's amino acids and break down large, complicated proteins into smaller pieces. Its processing makes it easier and quicker to digest. |
| Hypoallergenic | It refers to a substance that causes fewer allergic reactions. |
| Isolate | It is the purest and most processed form of protein which has undergone separation to obtain a pure protein fraction. It typically contains ≥ 90% of protein by weight. |
| Keratin | It is a protein that helps form hair, nails, and the outer layer of skin. |
| Lactalbumin | It is the albumin contained in milk and obtained from whey. |
| Lactoferrin | It is an iron‑binding glycoprotein that is present in the milk of most mammals. |
| Lupin | It is the yellow legume seeds of the genus Lupinus. |
| Millenial | Also known as Generation Y or Gen Y, it refers to the people born from 1981 to 1996. |
| Monogastric | It refers to an animal with a single-compartmented stomach. Examples of monogastric include humans, poultry, pigs, horses, rabbits, dogs, and cats. Most monogastric are generally unable to digest much cellulose food materials such as grasses. |
| MPC | Milk protein concentrate |
| MPI | Milk protein isolate |
| MSPI | Methylated soy protein isolate |
| Mycoprotein | Mycoprotein is a form of single-cell protein, also known as fungal protein, derived from fungi for human consumption. |
| Nutricosmetics | It is a category of products and ingredients that act as nutritional supplements to care for skin, nails, and hair natural beauty. |
| Osteoporosis | It is a medical condition in which the bones become brittle and fragile from loss of tissue, typically as a result of hormonal changes, or deficiency of calcium or vitamin D. |
| PDCAAS | Protein digestibility-corrected amino acid score (PDCAAS) is a method of evaluating the quality of a protein based on both the amino acid requirements of humans and their ability to digest it. |
| Per-capita consumption of animal protein | It is the average amount of animal protein (such as milk, whey, gelatin, collagen, and egg proteins) that is readily available for consumption by each person in an actual population. |
| Per-capita consumption of plant protein | It is the average amount of plant protein (such as soy, wheat, pea, oat, and hemp proteins) that is readily available for consumption by each person in an actual population. |
| Quorn | It is a microbial protein manufactured using mycoprotein as an ingredient, in which the fungus culture is dried and mixed with egg albumen or potato protein, which acts as a binder, and then is adjusted in texture and pressed into various forms. |
| Ready-to-Cook (RTC) | It refers to food products that include all of the ingredients, where some preparation or cooking is required through a process that is given on the package. |
| Ready-to-Eat (RTE) | It refers to a food product prepared or cooked in advance, with no further cooking or preparation required before being eaten. |
| RTD | Ready-to-Drink |
| RTS | Ready-to-Serve |
| Saturated fat | It is a type of fat in which the fatty acid chains have all single bonds. It is generally considered unhealthy. |
| Sausage | It is a meat product made of finely chopped and seasoned meat, which may be fresh, smoked, or pickled and which is then usually stuffed into a casing. |
| Seitan | It is a plant-based meat substitute made out of wheat gluten. |
| Softgel | It is a gelatin-based capsule with a liquid fill. |
| SPC | Soy protein concentrate |
| SPI | Soy protein isolate |
| Spirulina | It is a biomass of cyanobacteria that can be consumed by humans and animals. |
| Stabilizer | It is an ingredient added to food products to help maintain or enhance their original texture, and physical and chemical characteristics. |
| Supplementation | It is the consumption or provision of concentrated sources of nutrients or other substances that are intended to supplement nutrients in the diet and is intended to correct nutritional deficiencies. |
| Texturant | It is a specific type of food ingredient that is used to control and alter the mouthfeel and texture of food and beverage products. |
| Thickener | It is an ingredient that is used to increase the viscosity of a liquid or dough and make it thicker, without substantially changing its other properties. |
| Trans fat | Also called trans-unsaturated fatty acids or trans fatty acids, it is a type of unsaturated fat that naturally occurs in small amounts in meat. |
| TSP | Textured soy protein |
| TVP | Textured vegetable protein |
| WPC | Whey protein concentrate |
| WPI | Whey protein isolate |


Research Methodology
Mordor Intelligence follows a four-step methodology in all our reports.
- Step-1: Identify Key Variables: The quantifiable key variables (industry and extraneous) pertaining to the specific product segment and country are selected from a group of relevant variables & factors based on desk research & literature review; along with primary expert inputs. These variables are further confirmed through regression modeling (wherever required).
- Step-2: Build a Market Model: In order to build a robust forecasting methodology, the variables and factors identified in Step-1 are tested against available historical market numbers. Through an iterative process, the variables required for market forecast are set and the model is built on the basis of these variables.
- Step-3: Validate and Finalize: In this important step, all market numbers, variables and analyst calls are validated through an extensive network of primary research experts from the market studied. The respondents are selected across levels and functions to generate a holistic picture of the market studied.
- Step-4: Research Outputs: Syndicated Reports, Custom Consulting Assignments, Databases & Subscription Platforms


