
Market Overview
| Study Period | 2020 - 2031 |
|---|---|
| Forecast Data Period | 2026 - 2031 |
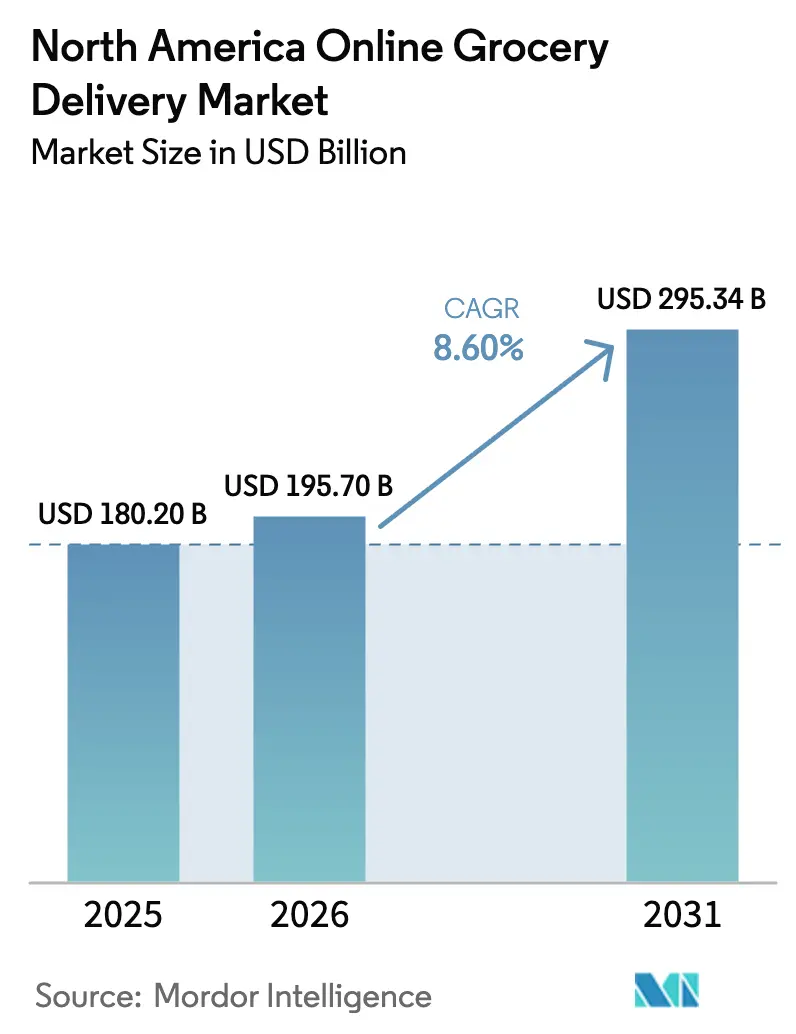
| Base Year Market Size (2025) | USD 180.2 Billion |
| Market Size (2026) | USD 195.7 Billion |
| Market Size (2031) | USD 295.34 Billion |
| Growth Rate (2026 - 2031) | 8.60 % |
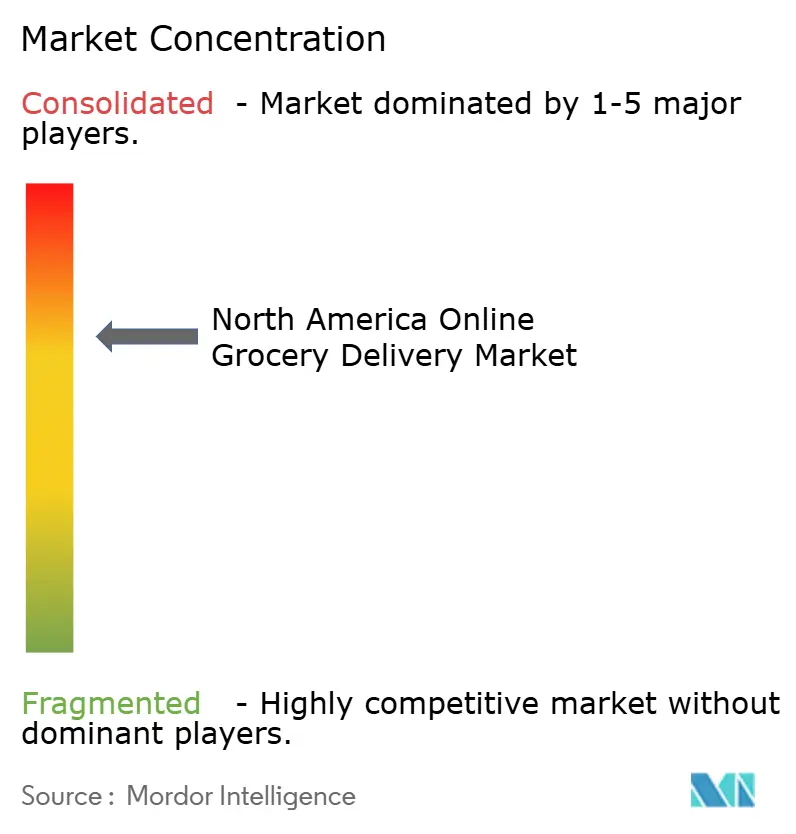
| Market Concentration | Medium |
Major Players *Disclaimer: Major Players sorted in no particular order Image © Mordor Intelligence. Reuse requires attribution under CC BY 4.0. | |
North America Online Grocery Delivery Market Analysis by Mordor Intelligence
North America online grocery delivery market size in 2026 is estimated at USD 195.7 billion, growing from 2025 value of USD 180.2 billion with 2031 projections showing USD 295.34 billion, growing at 8.60% CAGR over 2026-2031. Structural shifts such as subscription programs, the digitization of SNAP benefits, and record-high infrastructure investment have made digital grocery a permanent habit rather than a pandemic spike. Established omnichannel retailers leverage their store footprints as last-mile nodes, while pure-play platforms double down on data-driven personalization to protect share. Same-day fulfilment networks, AI-assisted demand planning, and low-emission vehicle rollouts lower unit costs and raise service quality. Together, these forces set a clear path for sustained volume gains in the North America online grocery delivery market. [1]
Key Report Takeaways
- By product type, retail delivery led with 62.38% of the North America online grocery delivery market share in 2025, whereas quick commerce is forecast to grow at 20.3% CAGR through 2031.
- By delivery speed, same-day services captured 45.35% of the North America online grocery delivery market size in 2025, while instant delivery under two hours is expected to advance at 25.9% CAGR to 2031.
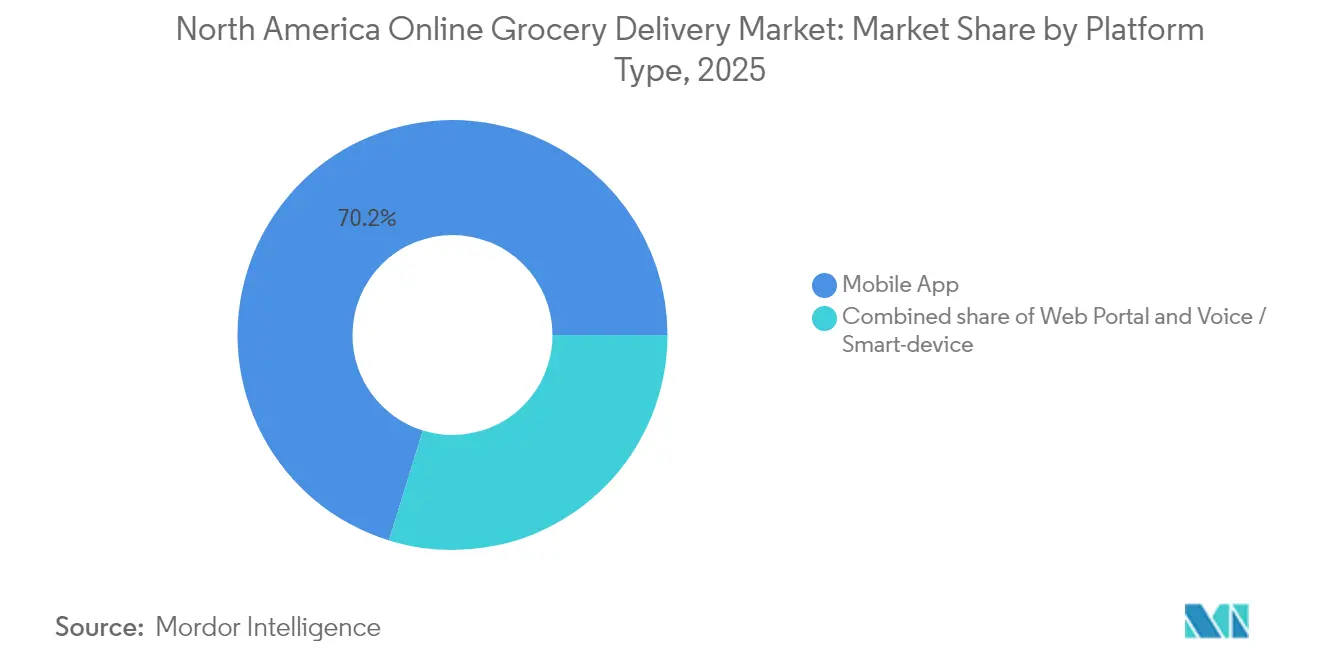
- By platform type, mobile apps dominated with 70.22% revenue share in 2025; voice and smart-device interfaces show the fastest projected CAGR at 17.2% through 2031.
- By customer type, household consumers accounted for 90.35% share of the North America online grocery delivery market size in 2025, but corporate and institutional demand is set to grow 13.6% annually through 2031.
- By country, the United States retained 85.60% of the North America online grocery delivery market share in 2025, whereas Mexico is on track for a 15.95% CAGR through 2031.
Note: Market size and forecast figures in this report are generated using Mordor Intelligence’s proprietary estimation framework, updated with the latest available data and insights as of 2026.
Market Trends and Insights
Drivers Impact Analysis of North America Online Grocery Delivery Market*
| Driver | (~) % Impact on CAGR Forecast | Geographic Relevance | Impact Timeline |
|---|---|---|---|
| Subscription services' recurring-revenue flywheel | 1.80% | North America, with strongest adoption in US urban markets | Medium term (2-4 years) |
| SNAP Online expansion & EBT digitisation | 1.20% | US nationwide, with concentrated impact in food desert regions | Short term (≤ 2 years) |
| Same-day fulfilment infrastructure roll-out | 2.10% | US metropolitan areas, expanding to Canada secondary markets | Medium term (2-4 years) |
| AI-powered demand-forecasting for perishables | 0.90% | Global, with early deployment in US and Canadian operations | Long term (≥ 4 years) |
| Dark-store micro-fulfilment economics | 1.40% | US urban cores, pilot expansion to Mexico City | Medium term (2-4 years) |
| ESG-led switch to low-emission last-mile fleets | 0.70% | California leading, spreading to Northeast US and Canadian provinces | Long term (≥ 4 years) |
| Source: Mordor Intelligence | |||
Subscription Services’ Recurring-Revenue Flywheel
Paid memberships such as Walmart+ convert one-off shoppers into predictable, high-frequency customers. Bundled perks—free delivery, fuel discounts, streaming content—reduce churn and lift average order frequency, letting retailers subsidize shipping without eroding margin. Amazon, Safeway and regional grocers alike exploit first-party data from subscriptions to personalize offers and optimize inventory, deepening competitive moats around scale.
SNAP Online Expansion & EBT Digitization
Forty-one million SNAP participants now enjoy digital purchase capability, after the USDA expanded the program to every state in 2024. Kroger, DoorDash and Shipt quickly integrated EBT check-out, unlocking incremental demand from food-insecure households and cutting fraud through chip-enabled cards. California’s statewide chip-and-tap rollout beginning January 2025 accelerates the shift, widening the addressable base for the North America online grocery delivery market. [2]
Same-Day Fulfilment Infrastructure Roll-Out
Amazon serves 40 million U.S. shoppers with same-day delivery, while Walmart lifted <3-hour deliveries by 91% in 2025 through store-based micro-fulfilment. Regional chains such as Save Mart deploy automated dark stores to cut pick times, proving that robotics can level the playing field against national giants. Speed now trumps price once networks hit scale, evidenced by 30% of Walmart customers opting to pay extra for accelerated service.
AI-Powered Demand Forecasting for Perishables
Algorithms ingest sales trends, weather data and promotions to predict fresh-item demand, lowering waste by up to 25% and reducing stockouts. Albertsons’ DC Forecasts tool already automates purchasing across 17 U.S. distribution centers. Independent grocers adopt cloud-based AI suites to remain competitive on availability despite lower volumes, reinforcing data scale as a barrier to entry.
Restraints Impact Analysis of North America Online Grocery Delivery Market*
| Restraint | (~) % Impact on CAGR Forecast | Geographic Relevance | Impact Timeline |
|---|---|---|---|
| Last-mile cost inflation outpacing basket value | -2.30% | North America, particularly US metropolitan areas | Short term (≤ 2 years) |
| Driver & warehouse labour shortages | -1.70% | US and Canada, acute in urban centers | Medium term (2-4 years) |
| Cold-chain capacity bottlenecks | -1.10% | North America, concentrated in secondary markets | Medium term (2-4 years) |
| Municipal fee caps & Proposition-22 style rules | -0.80% | California leading, potential spread to other states | Long term (≥ 4 years) |
| Source: Mordor Intelligence | |||
Last-Mile Cost Inflation Outpacing Basket Value
Urban minimum-wage ordinances for gig workers lift delivery costs faster than basket values grow. Platforms must choose between absorbing losses or raising fees, pressuring unit economics in the North America online grocery delivery market. Regulatory scrutiny of fee structures, such as the CFPB’s probe into Walmart, compounds compliance expense.
Driver & Warehouse Labor Shortages
The trucking sector may face a 160,000-driver shortfall by 2030, intensifying wage competition for last-mile couriers and fulfilment staff. Walmart has automated 45% of U.S. eCommerce operations to offset labour scarcity, highlighting automation’s role as both cost lever and strategic hedge.
*Our forecasts treat driver/restraint impacts as directional, not additive. The impact forecasts reflect baseline growth, mix effects, and variable interactions.
North America Online Grocery Delivery Market Segment Analysis
By Product Type:
Retail Delivery Retains LeadershipRetail delivery held 62.38% of the North America online grocery delivery market share in 2025. Consumers favour full-basket shopping that mirrors in-store experiences, driving sustained volume through omnichannel retailers. Quick commerce, though only a minority today, is the fastest-growing slice at a 20.3% CAGR thanks to urban demand for immediacy. Meal-kit providers face margin pressure as HelloFresh anticipates double-digit revenue decline, while supermarkets roll out in-house kits to win back share.
Quick commerce startups like Gopuff launch convenience hubs across major metros, but unit profitability hinges on dense order pools and premium fees. Specialty ethnic and wellness categories gain traction as demographic diversity rises. Pharmacy integration boosts basket size, reinforcing the revenue potential embedded within the North America online grocery delivery market.


By Delivery Speed:
Same-Day Becomes Table StakesSame-day options commanded 45.35% of the North America online grocery delivery market size in 2025 and continue to expand as retailers retrofit stores into micro-fulfilment nodes. Instant services promise sub-2-hour turnaround and are projected to grow at 25.9% CAGR. Yet sustainability of ultra-rapid delivery remains in question outside dense cores, where order density fails to absorb high fixed costs.
Next-day delivery survives for bulk pantry staples and value-oriented customers. Platforms now segment service levels, charging premiums for speed while keeping standard tiers price-competitive, allowing refined revenue management across the North America online grocery delivery market.
By Platform Type:
Mobile Apps Dominate, Voice RisesMobile apps captured 70.22% share in 2025, benefiting from mature UX design and in-app loyalty features. Voice assistants recorded the highest growth trajectory at 17.2% CAGR, with Amazon Alexa enabling hands-free reorders and predictive replenishment that blurs shopping into an ambient experience. Web portals remain indispensable for corporate buyers who need bulk uploads and invoice management.
Augmented-reality shelf browsing and smart-fridge sensors inch closer to mainstream, underscoring how digital interfaces widen the funnel for the North America online grocery delivery industry.
By Customer Type:
Households Anchor Volume; Corporates AccelerateHouseholds accounted for 90.35% of 2025 revenues, validating grocery’s historic consumer focus. Corporate and institutional customers, however, are expanding at 13.6% annually. Offices, hospitals and universities increasingly outsource pantry management for employee retention and operational simplicity. Larger baskets and predictable cycles enhance margin, turning B2B an attractive growth avenue inside the North America online grocery delivery market.
Geography Analysis
United States Online Grocery Delivery Market
The United States drives the lion’s share of demand, with the North America online grocery delivery market size in the country mirroring overall regional growth. Robust SNAP participation, same-day networks serving 40 million addresses, and omnichannel leaders such as Walmart (37% eGrocery share) create a high barrier to new entrants. Californian zero-emission mandates push fleets toward electric vans, while the Northeast prioritizes dense-city logistics and the Southeast focuses on suburban pickup models.
Canada Online Grocery Delivery Market
Canada contributes a smaller but stable slice, leveraging a CAD 6.5 billion investment by Walmart to expand Supercentres and modernize supply chains. Domestic chains like Loblaw counter U.S. brands through locally tailored assortments and loyalty ecosystems. Click-and-collect remains prominent, reflecting lower urban density outside Toronto and Vancouver.
Mexico Online Grocery Delivery Market
Mexico offers the steepest curve, propelled by Walmex’s plan to add 1,500 stores and two robotics-equipped DCs by 2030. eCommerce sales rose 25% to USD 34 billion in 2024, yet online penetration in grocery sits in single digits, indicating ample runway. Local sourcing (83% of goods made in Mexico) bolsters supplier networks and keeps pricing competitive, positioning Mexico as a breakout contributor to the North America online grocery delivery market.
Regulatory Landscape
Regulatory scrutiny in the United States is sharpening around fee transparency and pricing practices in online food and grocery delivery. On April 16, 2026, the Federal Trade Commission (FTC) issued an Advance Notice of Proposed Rulemaking (Project No. P267101) to seek public comment on unfair or deceptive fee practices in online food and grocery delivery services, raising compliance stakes for platforms and retailers that rely on service fees, minimum baskets, and promotional pricing.
Policy activity is also widening beyond fees into consumer-data-driven pricing and program access. Bills introduced in 2026, including H.R. 8895 and S. 3892, target surveillance-based or personal-data-driven dynamic pricing, while H.R. 8046 proposes amendments to the Food and Nutrition Act of 2008 to set clearer online and delivery standards for SNAP participants, reinforcing the importance of compliant EBT/SNAP checkout, item eligibility logic, and delivery execution in digital grocery.
Value Chain Analysis
The value chain begins with branded manufacturers and fresh suppliers, then flows through retailers and distributors that manage inventory, pricing, and assortment, before moving into picking and packing across three primary fulfillment modes: store-based picking, micro-fulfillment/dark stores, and regional eCommerce warehouses. In North America, established omnichannel players increasingly use stores as last-mile nodes for same-day service, while platforms such as Instacart and DoorDash connect retailers to demand, providing order capture, shopper/driver networks, and customer service layers alongside payment and fraud controls (including EBT/SNAP checkout where enabled).
Downstream, delivery execution relies on route optimization, cold-chain handling, substitutions logic, and customer communications, with cost-to-serve shaped by labor availability and density. Recent industry evidence points to a shift away from purely warehouse-heavy approaches toward store-first fulfillment models and hybrid networks that mix ultra-fast local delivery with sub-same-day ship-to-home, supported by retailer investments in automation and AI across inventory, merchandising, and fulfillment to reduce picking labor and waste while maintaining service levels.
Competitive Landscape
Competition intensifies as physical retailers weaponize store networks to match pure-play speed. Walmart’s omnichannel model, Instacart’s platform economics, and Amazon’s robotics-driven fulfilment illustrate diverging strategies converging on scale and data mastery. Patent filings for autonomous delivery, such as DoorDash’s vehicle-to-third-party communication system, underscore a race toward capital-heavy logistics innovation.
Retail media networks emerge as lucrative adjacencies—Instacart’s 2024 ad revenue topped USD 1 billion, while Walmart Connect grew 26%—monetizing supplier budgets and insulating margins. Quick commerce remains a contested niche; players experiment with 20-minute promises yet grapple with profitability outside dense urban pockets. Smaller grocers pursue differentiation via sustainable packaging and local provenance rather than speed, carving defensible micro-segments inside the vast North America online grocery delivery market.
Scale economics and automation widen the gap between leaders and followers. Capital requirements for robotics, AI and EV fleets deter new entrants, suggesting the market is trending toward oligopoly with periodic niche insurgents. [4]
North America Online Grocery Delivery Industry Leaders
-
Walmart Inc.
-
Amazon.com Inc.
-
Instacart
-
Costco Wholesale Corp.
-
The Kroger Co.
- *Disclaimer: Major Players sorted in no particular order
North America Online Grocery Delivery Market Companies Covered in this Report
- Walmart Inc.
- Amazon.com Inc. (Amazon Fresh)
- Instacart
- Albertsons Companies Inc.
- Ahold Delhaize USA (Peapod)
- The Kroger Co.
- FreshDirect LLC
- Shipt LLC (Target)
- Thrive Market Inc.
- DoorDash Inc. (DashMart)
- Gopuff LLC
- Misfits Market Inc.
- Boxed.com Inc.
- Imperfect Foods Inc.
- Costco Wholesale Corp. (Costco Grocery)
- H-E-B, LP (Favor Delivery)
- Loblaw Companies Ltd. (PC Express)
- Metro Inc. (Metro Online)
- Publix Super Markets Inc.
- 7-Eleven, Inc. (7NOW)
Read Analysis of North America Online Grocery Delivery Companies
Market Opportunities and Future Outlook
Ultra-fast delivery and service-tier monetization represent a clear whitespace as retailers operationalize 30-minute propositions across more metros. Same-day delivery accounted for about 80% of all delivery orders in Q1 2026 in surveyed tracking, and Walmart expanded 30-minute delivery to 33 US markets in May 2026, signaling that speed-led baskets are moving from pilot to scaled execution. This expands opportunity for micro-fulfillment, store backroom reconfiguration, and decentralized nodes that increase order density and reduce time-in-transit for fresh and convenience missions.
Compliance-ready affordability and digital access are another growth lever, tied to SNAP Online standards and evolving expectations on transparent fees and pricing. With USDA SNAP Online shopping expanded nationwide by 2024 and proposed legislation (H.R. 8046) seeking more explicit online and delivery standards for SNAP participants, platforms that tighten eligibility, substitutions, and delivery integrity can improve conversion for assisted shoppers. At the same time, the FTCs April 2026 rulemaking initiative on deceptive fee practices and 2026 federal bills targeting surveillance-based pricing elevate demand for auditable fee disclosure, promotion governance, and data use controls, creating room for vendors offering compliant checkout, pricing transparency tooling, and retail media monetization that does not depend on opaque fee structures.
Recent Industry Developments in North America Online Grocery Delivery Market
- July 2026: Walmart pursued additional online fulfillment capacity at the store level by filing a zoning variance request to expand its online fulfillment space at its 1881 Baltimore Pike location in Hanover, Pennsylvania, with a public hearing scheduled for July 28, 2026. The move highlights how store-adjacent expansions are being used to increase picking and staging capacity to support faster delivery windows. It also reinforces the shift toward localized nodes rather than relying solely on distant eCommerce warehouses for grocery orders.
- June 2026: Amazon expanded its 30-minute delivery service, Amazon Now, to additional cities within its same-day grocery network. Broadening ultra-fast coverage tightens competitive benchmarks for instant and sub-hour grocery missions in major metro areas. The rollout also increases pressure on rivals to match speed while managing cold-chain and labor costs at higher service levels.
- May 2026: Walmart announced an expansion of its 30-minute delivery service, operating across 33 US markets at the time of the update. Scaling this offer increases the addressable base for quick top-up baskets and convenience-led grocery ordering beyond traditional same-day expectations. The expansion underscores how last-mile execution, store labor orchestration, and localized inventory placement are becoming core differentiators in North American online grocery delivery.
North America Online Grocery Delivery Market Report Scope and Research Methodology
Market Definition and Coverage
For this report, the market is the value of grocery orders placed online and delivered to the customer in North America, covering food and everyday household items sold through retailer apps, marketplaces, or delivery platforms.
Scope exclusions: offline grocery sales are excluded, and click-and-collect only orders are excluded if they are not delivered.
Segments Covered in This Report
- By Product Type
- Retail Delivery
- Quick Commerce (?30-min)
- Meal-kit Delivery
- Specialty and Ethnic Grocery
- Pharmacy and Health Items
- By Delivery Speed
- Standard (next-day +)
- Same-day
- Instant (<2 hours)
- By Platform Type
- Mobile App
- Web Portal
- Voice / Smart-device
- By Customer Type
- Household Consumers
- Corporate / Institutional
- By Country
- United States
- Canada
- Mexico
Data Sources, Market Sizing, and Validation
Desk Research
Desk research is used to set the ground truth for grocery demand size, how quickly online adoption is changing, and what delivery options are being offered across the US, Canada, and Mexico. We start from public statistics and sector reporting to frame addressable spend, then connect those figures to online ordering behavior and delivery penetration.
Sources commonly reviewed include official data and publications such as US Census Bureau e-commerce releases, Statistics Canada retail trade tables, the US Department of Agriculture (food spending and price series), and trade bodies and public trackers such as FMI and Brick Meets Click summaries. We also review company filings, investor decks, and credible press coverage to validate strategy shifts like micro-fulfillment, subscription programs, and SNAP online enablement. Where needed, paid subscriptions are used for company financial intelligence, news and financials, patent databases, and shipment-level import-export checks for selected grocery categories. This desk research list is illustrative, and additional sources were also used for data collection, validation, and clarification.
Primary Interviews and Surveys
Primary work focuses on confirming what customers are doing (frequency, basket size, and delivery fees) and what operators are seeing in the fulfillment mix across delivery, pickup, and ship-to-home. We interview grocery retailers, delivery operations leaders, packaging and cold chain service providers, and industry experts across North America so assumptions on margins, substitution from in-store, and promotional intensity can be corrected before totals are finalized.
Distribution of primary research fieldwork respondents
| Company type | Respondent position |
|---|---|
| Top tier: 37% | CXOs: 20% |
| Mid tier: 41% | Functional/Unit leaders: 24% |
| Smaller Players: 22% | Managers: 56% |
Market-Sizing & Forecasting
Sizing starts with a top-down build where retail grocery spend and e-commerce ordering signals are used to reconstruct the online grocery demand pool, which is then filtered to only the delivery portion. To keep the model practical, totals are cross-checked with selective bottom-up approximations such as sampled order volume by fulfillment type, observed delivery share trends, and basket value checks from interviews.
Key inputs that move the model include online grocery penetration by country, delivery mix within eGrocery, average basket value by channel, delivery fee and subscription effects on effective price paid, and last-mile capacity signals such as the spread of same-day coverage and micro-fulfillment rollouts. Where bottom-up inputs are incomplete, gaps are handled by applying conservative ranges anchored to publicly visible adoption curves, then tightening those ranges with interview feedback.
For forecasting, scenario analysis is used with a base case that reflects expected adoption and capacity expansion, and alternative cases that reflect faster or slower price sensitivity and promotional intensity. Assumptions on basket growth and delivery share are adjusted with primary feedback so the forecast does not rely only on historical momentum.
Data Validation & Update Cycle
Outputs are checked against independent signals such as total digital grocery sales, delivery share movement, and reported monthly sales run-rates, and then reviewed for outliers at country and platform level. If a variance looks large, we recheck unit economics assumptions like delivery fees, basket size, and currency conversion timing, and then re-contact experts when the explanation is not clean.
A multi-step review is followed before sign-off so final totals align with the defined scope and consistent price logic. Reports refresh annually, with interim updates triggered by material events such as major service model changes, regulation shifts, or sharp inflation moves. Before delivery, analysts do a fresh pass so clients receive the latest updated view.
Mordor Intelligence's North America Online Grocery Delivery Market Size Compared Against Other Published Estimates
Published market sizes for online grocery delivery in North America often do not match because sources treat delivery, pickup, and ship-to-home differently, and they may not align on whether fees and subscriptions are counted as part of the transaction value. Timing choices also matter, since the same year can look different depending on whether nominal or inflation-adjusted spending is used.
The biggest gap drivers tend to be refresh cadence and currency timing, followed by how average selling price per order is carried forward when promotions and membership discounts change behavior. In our workflow, those inputs are re-validated against monthly run-rate signals and fulfillment-mix checks before lock-in, which keeps the 2025 baseline consistent with the latest available evidence in Mordor Intelligence.
Benchmark comparison
| Source | Market Size | Gaps in Research Methodology |
|---|---|---|
| Mordor Intelligence | USD 180.2 B (2025) | |
| Industry Tracker A | USD 65.8 B (2024) | This figure is closer to a US-only delivery spend implied by digital grocery sales multiplied by delivery share, so it undercounts Canada and Mexico and does not fully align with a North America delivery-only boundary. |
| Industry Database B | USD 166.3 B (2025) | This estimate is for US online grocery sales revenue and can include pickup and ship-to-home elements, which makes it directionally comparable but not a clean delivery-only, North America total. |
The spread in the table is mainly explained by geography coverage and whether the value is delivery-only versus broader online grocery revenue. By keeping scope rules explicit and rechecking pricing and mix assumptions against observable demand signals, the final number becomes easier to trace and repeat when conditions change.
Key Questions Answered in the Report
What is the current size of the North America online grocery delivery market?
The market reached USD 195.7 billion in 2026 and is forecast to hit USD 295.34 billion by 2031.
Which delivery speed segment is growing fastest?
Instant services that arrive in under two hours are projected to expand at a 25.9% CAGR through 2031.
How important are subscription programs to market growth?
Subscriptions add +1.8% to the overall CAGR by boosting order frequency and lowering churn.
Which country shows the highest growth potential?
Mexico leads with a 15.95% forecast CAGR thanks to large-scale investment and rising smartphone adoption.
What technologies most reduce operating costs?
AI demand forecasting and automated micro-fulfilment cut waste and labour needs, directly improving unit economics.
Are corporate customers a meaningful opportunity?
Yes, corporate and institutional buyers are the fastest-growing customer group at 13.6% CAGR, offering larger baskets and predictable demand.