North America Juices Market Size and Share
Market Overview
| Study Period | 2026 - 2031 |
|---|---|
| Forecast Data Period | 2026 - 2031 |
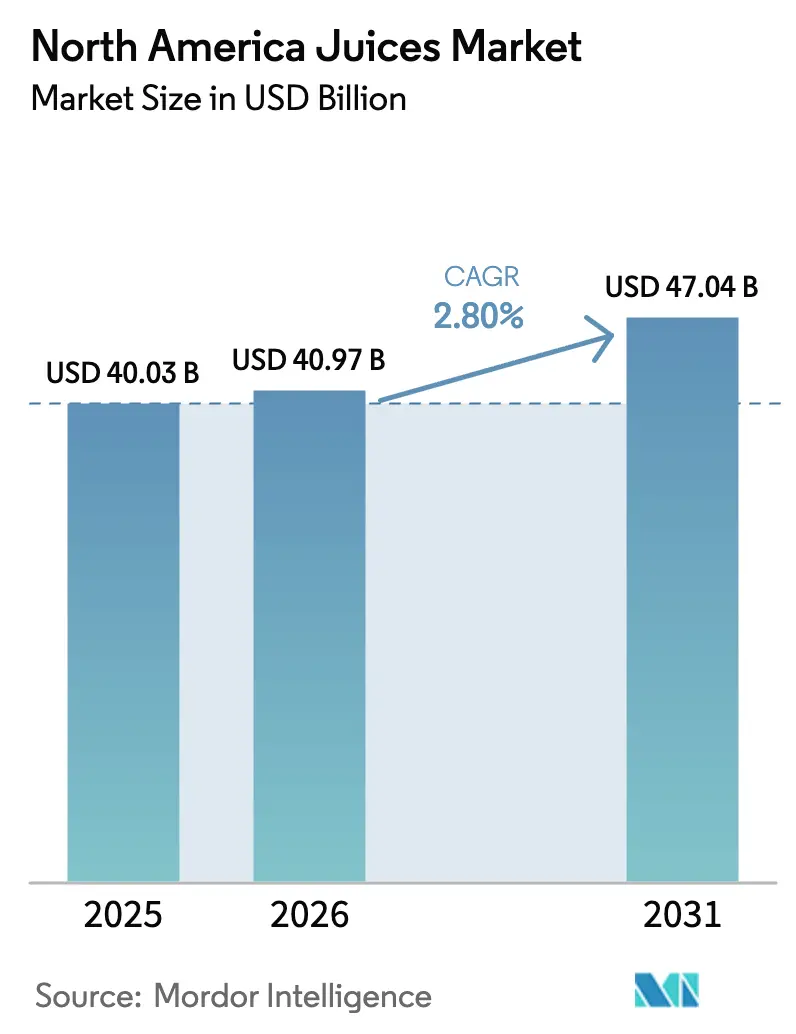
| Base Year Market Size (2025) | USD 40.03 Billion |
| Market Size (2026) | USD 40.97 Billion |
| Market Size (2031) | USD 47.04 Billion |
| Growth Rate (2026 - 2031) | 2.80% CAGR |
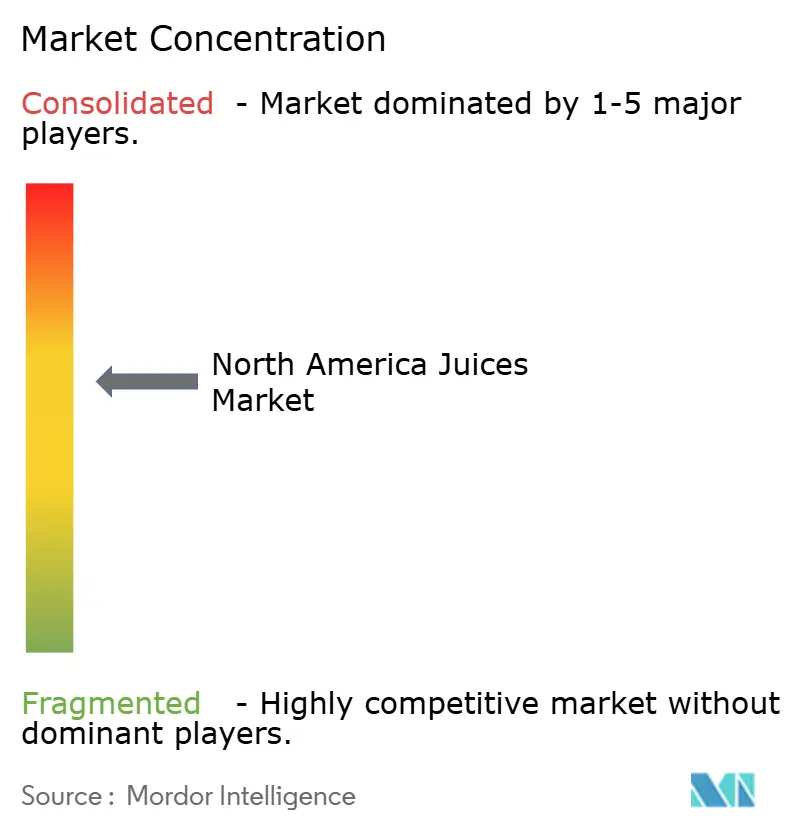
| Market Concentration | Medium |
Major Players *Disclaimer: Major Players sorted in no particular order Image © Mordor Intelligence. Reuse requires attribution under CC BY 4.0. | |
North America Juices Market Analysis by Mordor Intelligence
The North America Juices Market is projected to grow from USD 40.03 billion in 2025 to USD 40.97 billion in 2026, reaching USD 47.04 billion by 2031, with a compound annual growth rate (CAGR) of 2.80% during 2026 to 2031. Growth remains steady as premium cold-pressed, functional, and organic juice offerings generate higher revenue per unit, despite contributing modestly to volume increases. Retailers are expanding refrigerated sections, beverage manufacturers are reformulating products to avoid added-sugar warnings, and packaging suppliers are introducing connected cartons to enhance consumer engagement. Meanwhile, citrus greening has significantly reduced domestic orange supply, driving up concentrate costs and encouraging brands to diversify fruit inputs. This dynamic creates a market that balances affordability in juice drinks with value creation in 100% juice, organic, and functional options. This balance supports ongoing consolidation among major players while providing opportunities for differentiated regional brands.
Key Report Takeaways
- By product type, juice drinks containing up to 24% juice led with 45.43% revenue share of the North America Juices market in 2025 while 100% juice is advancing at a 3.63% CAGR through 2031.
- By packaging type, PET bottles held 39.32% of the North America Juices market size in 2025 and aseptic packages are expanding at a 4.01% CAGR to 2031.
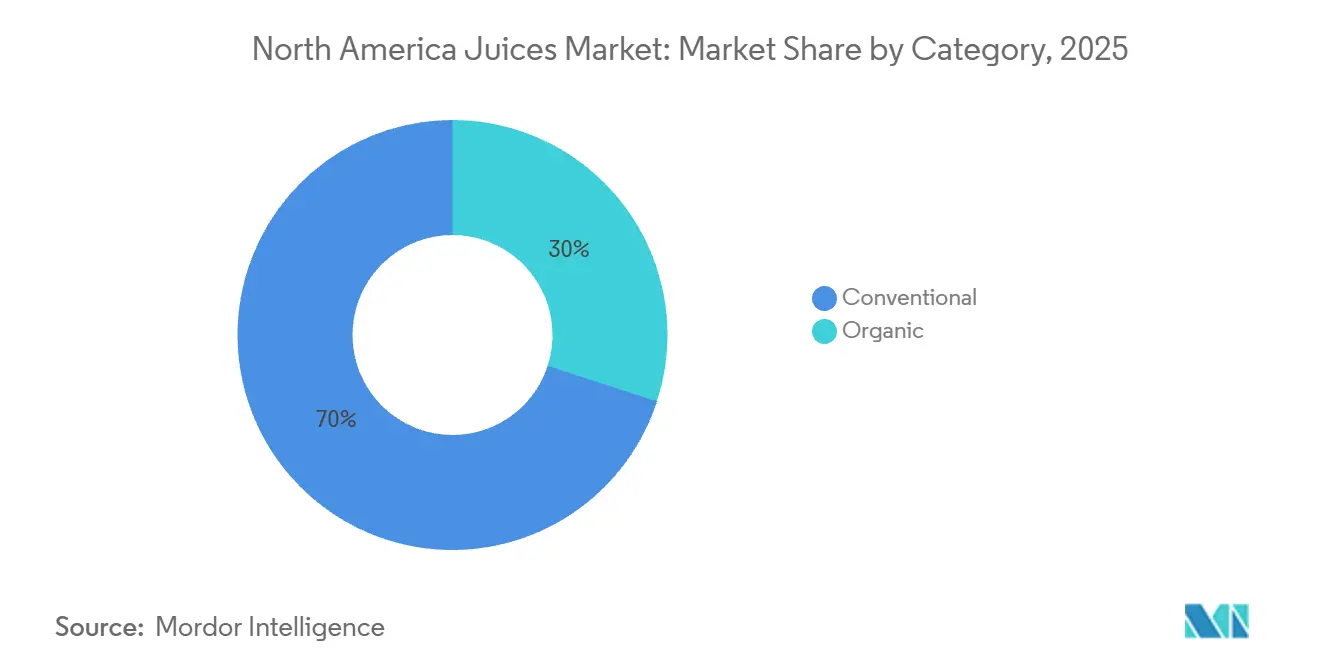
- By category, conventional offerings controlled 70.01% of the North America Juices market share in 2025 whereas organic variants are progressing at a 3.89% CAGR.
- By distribution channel, off-trade accounted for 77.01% of 2025 sales and on-trade is rebounding at a 3.71% CAGR through 2031.
- By geography, the United States captured 73.32% of North America Juices market revenue in 2025, and Mexico is forecast to post the fastest 3.86% CAGR to 2031.
Note: Market size and forecast figures in this report are generated using Mordor Intelligence’s proprietary estimation framework, updated with the latest available data and insights as of January 2026.
North America Juices Market Trends and Insights
Drivers Impact Analysis*
| Driver | (~) % Impact on CAGR Forecast | Geographic Relevance | Impact Timeline |
|---|---|---|---|
| Health-conscious consumers shifting from carbonated drinks to natural juices | +0.8% | United States, Canada, urban Mexico | Medium term (2-4 years) |
| Rising demand for cold-pressed juice formulations preserving nutrients | +0.6% | United States coastal markets, Canada metro areas | Long term (≥ 4 years) |
| Growth in functional juices with added vitamins, probiotics, and adaptogens | +0.7% | United States, Canada, spillover to Mexico premium segment | Medium term (2-4 years) |
| Increasing preference for organic and clean-label juices | +0.5% | United States, Canada | Long term (≥ 4 years) |
| Innovation in low-sugar and zero-added-sugar juice variants | +0.4% | United States, Canada, regulatory-driven in all three countries | Short term (≤ 2 years) |
| Retail expansion into convenience stores for impulse buys | +0.3% | Mexico, United States secondary markets | Short term (≤ 2 years) |
| Source: Mordor Intelligence | |||


Health-conscious consumers shifting from carbonated drinks to natural juices
Carbonated soft drink consumption has stabilized across North America as households shift spending toward wellness-oriented categories, such as 100% juice and functional blends. This shift is measurable: United States. organic beverage sales have grown year-over-year, outpacing conventional food sales by a factor of two. Retailers have adapted by expanding refrigerated juice offerings and reducing shelf space for carbonated soft drinks, particularly in natural and specialty stores like Whole Foods and Sprouts. This trend is self-reinforcing as households switching to cold-pressed or organic juice exhibit repeat purchase rates exceeding 60%, ensuring sustained revenue for premium brands. Coca-Cola's reformulation of its Simply brand in 2024 and the planned February 2025 launch of Simply Pop, a prebiotic soda line, highlight efforts by established players to address both categories and retain customers. Compliance with Food and Drug Administration (FDA) added-sugar labeling requirements and Health Canada's front-of-pack symbols has further accelerated reformulation efforts, as brands aim to avoid high-sugar warnings that could deter health-conscious consumers.
Rising demand for cold-pressed juice formulations preserving nutrients
Cold-pressed juice production utilizing high-pressure processing (HPP) extends shelf life to 30-80 days without causing thermal degradation of vitamins and enzymes. However, the technology requires significant capital investment in high-pressure processing machinery, creating a barrier to entry that consolidates production capacity among well-capitalized companies [1]Source: United States Food & Drug Administration, “FSMA Final Rule for Preventive Controls for Human Food,” fda.gov. Companies like Suja Life and Evolution Fresh have successfully leveraged high-pressure processing to justify retail prices exceeding USD 6 per 12-ounce bottle, which is three times the per-ounce cost of conventional orange juice, while maintaining gross margins near 40%. For premium brands, the economic rationale is clear: high-pressure processing eliminates pasteurization, preserves color and flavor, and supports clean-label claims that appeal to Millennial and Gen Z consumers who are willing to pay a premium for perceived nutritional integrity. Despite its advantages, high-pressure processing adoption faces challenges. Energy costs for high-pressure processing cycles, estimated at approximately 10-15 kilowatt-hours per batch, and the need for bulk pre-processing infrastructure restrict its use to coastal markets with dense distribution networks. Life-cycle assessments of non-thermal processing indicate that high-pressure processing manufacturing system production costs are USD 1.66 per kilogram, compared to USD 1.62 for high-temperature short-time pasteurization, a narrow cost difference that highlights the importance of achieving scale. Brands unable to distribute high-pressure processing investments across high-velocity stock-keeping units (SKUs) risk margin compression. This explains why regional juice cooperatives, such as Tree Top and Knouse Foods, continue to rely on aseptic thermal processing for cost-competitive concentrate and nectar product lines.
Growth in functional juices with added vitamins, probiotics, and adaptogens
Functional beverage sales saw significant growth during 2024-2025, primarily driven by the increasing popularity of prebiotic sodas. Olipop reported USD 400 million in sales in 2024, while Poppi was acquired by PepsiCo for USD 1.9 billion in May 2025. These developments reflect the growing acceptance of gut-health-focused products in the mainstream market, contributing to overall market expansion. Juice brands have responded by enhancing their formulations with probiotics such as Lactobacillus and Bifidobacterium strains, adaptogens like ashwagandha and reishi mushroom, and vitamins including C, D, and B-complex. This strategy targets consumers who perceive beverages as a source of functional nutrition rather than just refreshment. For instance, Bolthouse Farms' Daily Greens line and Suja's wellness shots offer concentrated doses of turmeric, ginger, and elderberry in 2-ounce formats priced at USD 3-4 per unit. The regulatory environment for functional beverages remains complex. The United States Food and Drug Administration (FDA) classifies supplemented beverages under conventional food regulations if claims are structure-function based. However, any claims suggesting disease prevention subject the products to dietary supplement oversight, complicating labeling and marketing efforts. Additionally, United States Department of Agriculture (USDA) organic certification permits the use of natural colorants derived from sources such as beet, carrot, aronia, elderberry, and grape skin. Despite this, supply constraints for organic color concentrates have delayed some product launches. Moreover, increasing concerns about per- and polyfluoroalkyl substances (PFAS) contamination are prompting brands to audit their packaging and processing equipment to ensure compliance and safety[2]Source: United States Department of Agriculture, “Organic Regulations,” ams.usda.gov.
Increasing preference for organic and clean-label juices
Organic juice sales are growing annually through 2031, surpassing the growth of the conventional segment. This trend is driven by consumers viewing United States Department of Agriculture (USDA) organic certification as an indicator of pesticide-free, non-genetically modified organisms (non-GMO), and environmentally responsible production. The price premium for organic juice has decreased from 40% to 50% in the early 2020s to 20% to 30% by 2025. This reduction is attributed to increased acreage, improved yields, and competition from retailer private-label offerings, making organic juice more accessible to middle-income households. In 2024, the USDA's Agricultural Marketing Service introduced enhanced traceability requirements. These included mandating GLOBAL INTEGRITY import certificates, expanding Harmonized Tariff Schedule codes to cover over 150 organic categories, and establishing port-sampling partnerships. These measures resulted in the seizure of 32 non-compliant shipments valued at over USD 85,000 in 2023. While these enforcement actions have tightened supply chains and increased compliance costs, they also help protect premium pricing for authentic organic brands. Consumer expectations for clean-label products now extend beyond organic certification. Shoppers increasingly examine ingredient lists for artificial colors, preservatives, and distinctions between concentrate and juice. Brands like Martinelli's, offering 100% U.S.-grown apple juice in glass bottles, and Ocean Spray, with its cooperative-sourced cranberry blends, exemplify transparency strategies. These approaches enable such brands to command shelf premiums and resist competition from private-label alternatives.
Restraints Impact Analysis*
| Restraint | (%) Impact on CAGR Forecast | Geographic Relevance | Impact Timeline |
|---|---|---|---|
| Increasing regulatory scrutiny on sugar and calorie content | -0.3% | United States, Canada, emerging in Mexico | Short term (≤ 2 years) |
| Volatile prices of key fruits like citrus and berries | -0.5% | United States, Canada, spillover to Mexico | Medium term (2-4 years) |
| Supply chain disruptions for perishable raw materials | -0.2% | United States, Canada | Short term (≤ 2 years) |
| High capital expenditure barriers for HPP technology | -0.2% | United States, Canada | Long term (≥ 4 years) |
| Source: Mordor Intelligence | |||
Increasing regulatory scrutiny on sugar and calorie content
Health Canada's front-of-pack nutrition labeling, set to become mandatory on January 1, 2026, requires high-sugar symbols on beverages containing more than 15% of the daily value per reference amount. While 100% fruit juice is exempt, juice drinks and nectars, which dominate volume sales, will be affected, potentially reducing the market's growth trajectory by an estimated 0.3%. Similarly, the United States Food and Drug Administration's updated Nutrition Facts label, which highlights added sugars and establishes a 50-gram daily limit, has prompted brands to reformulate products to avoid consumer rejection. Compliance costs are significant, encompassing label redesigns, stock-keeping unit (SKU) rationalization, reformulation research and development, and consumer education campaigns, collectively accounting for 2% to 3% of annual revenue for mid-tier brands. Tropicana Brands Group's decision to close underperforming plants and reduce its SKU count by approximately 20% by early 2026 reflects a strategic shift away from low-margin, high-sugar products. In Mexico, the Federal Commission for the Protection against Sanitary Risk (COFEPRIS) has not yet mandated front-of-pack sugar warnings on beverages, but advocacy groups are pushing for alignment with Canada's framework. Such a move could disrupt the juice-drink segment, which is projected to account for USD 18.19 billion of the USD 40.03 billion market in 2025.
Volatile prices of key fruits like citrus and berries
Citrus greening disease has significantly impacted Florida's orange groves, leading to a 92% decline in production since 1998, from 244 million boxes to 15.8 million in the 2023-24 season. This situation has forced manufacturers to import Brazilian concentrate at higher prices. Retail orange juice prices increased by 7.5% in 2024, while futures contracts reached USD 4.75 per pound in 2023, squeezing profit margins for brands unable to transfer these costs to price-sensitive consumers. In California, citrus acreage has also decreased due to water scarcity and labor shortages. At the same time, prices for berries such as strawberries, blueberries, and raspberries remain volatile, influenced by weather conditions, pest issues, and cross-border trade dynamics. Brands with vertically integrated supply chains, such as Ocean Spray's cranberry cooperative and Martinelli's apple orchards, benefit from cost stability. However, most juice manufacturers depend on spot markets and forward contracts, leaving them vulnerable to commodity price fluctuations. Additionally, the United States Department of Agriculture's frozen-juice procurement specifications require 100% U.S.-grown fruit for government contracts, limiting the potential for import substitution and exacerbating domestic price volatility.
*Our forecasts treat driver/restraint impacts as directional, not additive. The impact forecasts reflect baseline growth, mix effects, and variable interactions.
Segment Analysis
By Product Type: 100% Juice Gains as Drinks Dominate Volume
Juice drinks containing up to 24% juice accounted for 45.43% of the market share in 2025. This was supported by their affordability, extensive convenience-store distribution, and appeal to budget-conscious households. However, the 100% juice segment is growing at an annual rate of 3.63% through 2031, marking the fastest growth among product types. This growth is driven by health-conscious consumers increasingly rejecting added sugars and prioritizing clean-label products. Nectars, which typically contain 25% to 99% juice with added sweeteners, occupy a middle ground and remain popular in Hispanic markets and foodservice channels. Meanwhile, juice concentrates cater to industrial buyers and cost-focused retailers by offering frozen or shelf-stable options.
The shift toward 100% juice reflects a broader trend toward wellness, growing at twice the pace of conventional food categories. Premium products, such as Martinelli's 100% United States-grown apple juice and Ocean Spray's cranberry blends, exemplify this trend, commanding retail prices 30% to 50% higher than juice drinks. This premium positioning helps insulate these brands from private-label competition. Regulatory changes are also influencing product-type dynamics. Health Canada's front-of-pack labeling regulations, effective January 1, 2026, exempt 100% fruit juice from high-sugar warnings. In contrast, juice drinks exceeding 15% of the daily value per reference amount will face penalties, creating a compliance advantage for pure-juice formulations [3]Source: Government of Canada, “Nutrition labelling: Overview,” canada.ca.


By Packaging Type: Aseptic Gains Ground as PET Dominates
PET bottles are projected to account for 39.32% of packaging volume in 2025, driven by their lightweight convenience, resealability, and compatibility with existing filling lines. However, aseptic packages are expected to grow at an annual rate of 4.01% through 2031, marking the fastest growth among packaging types. This growth is attributed to brands seeking extended ambient shelf life, reduced cold-chain costs, and improved sustainability credentials.
Companies such as Tetra Pak and SIG Combibloc have introduced connected packaging solutions featuring Quick Response (QR) codes that provide consumers with information on product origin, carbon footprints, and recycling instructions, thereby enhancing consumer engagement and supporting premium positioning. Glass bottles continue to hold a niche in premium and gift segments, as seen with Martinelli's sparkling cider, while metal cans cater to single-serve, on-the-go consumption. Additionally, disposable cups and pouches are primarily targeted at foodservice and institutional buyers.
By Category: Organic Outpaces Conventional Despite Smaller Base
Conventional juices accounted for 70.01% of category sales in 2025, reflecting established distribution networks, competitive pricing, and widespread consumer acceptance. However, organic variants are growing at an annual rate of 3.89% through 2031, supported by the expanding United States organic beverage market. The organic price premium has decreased from 40% to 50% in the early 2020s to 20% to 30% in 2025, driven by factors such as increased acreage, improved yields, and competition from retailer private-label offerings, making organic juice more accessible to middle-income households. In 2024, the United States Department of Agriculture's (USDA) Agricultural Marketing Service introduced enhanced traceability requirements, including mandatory GLOBAL INTEGRITY import certificates, the expansion of Harmonized Tariff Schedule codes to over 150 organic categories, and port-sampling partnerships. These measures resulted in the seizure of 32 non-compliant shipments valued at over USD 85,000 in 2023. While these enforcement actions have tightened supply chains and increased compliance costs, they also help maintain premium pricing for certified organic brands.
Consumer expectations for clean-label products now extend beyond organic certification. Shoppers increasingly examine ingredient lists for artificial colors, preservatives, and distinctions between concentrate and juice. The USDA's National Organic Standards Board permits natural colorants derived from beet, carrot, aronia, elderberry, and grape skin. However, supply constraints for organic color concentrates have delayed some product launches. Additionally, growing concerns over per- and polyfluoroalkyl substances (PFAS) contamination are prompting brands to audit their packaging and processing equipment.
By Distribution Channel: Off-Trade Leads, On-Trade Rebounds
Off-trade channels, including supermarkets, hypermarkets, convenience stores, and online retail, accounted for 77.01% of juice distribution in 2025, emphasizing the importance of grocery stores as the primary purchase occasion for juice. However, on-trade outlets such as restaurants, cafes, and foodservice establishments are recovering, with an annual growth rate of 3.71% projected through 2031. Convenience stores have become a significant impulse channel, as documented in Jones Lang LaSalle's (JLL) 2025 retail report, which recorded 17.2 billion grocery-store visits in 2024, a 1.0% increase. Convenience formats captured a disproportionate share of this incremental traffic.
The recovery of on-trade channels remains uneven. Beverage alcohol sales in restaurants grew by 4.8% in 2024, outpacing non-alcoholic beverages. Meanwhile, fresh-pressed juice bars and smoothie concepts are expanding in urban centers, targeting health-conscious Millennials and Generation Z consumers. In 2024, private-label juice reached USD 270 billion across all food categories, growing by 3.4% and capturing a 20.7% market share. This growth has pressured branded juice products to differentiate through functional claims, organic certifications, or premium ingredients.
Geography Analysis
The United States led the regional market, accounting for 73.32% of revenue in 2025. This dominance is attributed to a well-established grocery infrastructure, high per-capita juice consumption, and a mature retail landscape featuring major players such as Walmart, Kroger, and Target. However, challenges persist, including a 92% decline in Florida's orange production since 1998, dropping from 244 million boxes to 15.8 million in the 2023-24 season due to citrus greening. This has necessitated the import of Brazilian concentrate, resulting in a 7.5% increase in retail orange juice prices in 2024. California's citrus acreage has also contracted due to water scarcity and labor shortages. Meanwhile, apple and grape supplies from Washington and New York remain stable but are vulnerable to weather-related fluctuations. The U.S. market is increasingly segmented, with premium cold-pressed and organic juices gaining traction in coastal metropolitan areas and natural-channel retailers, while conventional juice drinks maintain their stronghold in heartland convenience stores and mass-market grocery outlets.
Mexico is the fastest-growing market, with an annual growth rate of 3.86% projected through 2031. This growth is fueled by urbanization, retail modernization through convenience store networks such as OXXO and 7-Eleven, and rising middle-class demand for affordable juice drinks, which are expected to play a significant role in market expansion. Grupo Jumex, a leading domestic company, capitalizes on local fruit sourcing and cost-efficient Tetra Pak packaging to compete with multinational brands. The rapid expansion of convenience stores, with OXXO operating over 20,000 locations, further supports impulse purchases of single-serve juice cartons.
In Canada, Health Canada's front-of-pack nutrition labeling rules, effective January 1, 2026, require high-sugar warnings on beverages exceeding 15% of the daily value per reference amount. While 100% fruit juice is exempt from this regulation, juice drinks and nectars face increased scrutiny. Canadian consumers show higher adoption of organic products compared to their U.S. counterparts, driven by proximity to natural-channel retailers and government initiatives supporting sustainable agriculture. The grocery distribution landscape in Canada is highly concentrated, with Loblaw, Metro, and Sobeys controlling the majority of the market, limiting shelf access for smaller juice brands. Additionally, the Canadian Food Inspection Agency's Safe Food for Canadians Regulations mandate traceability and licensing, which increases compliance costs but also safeguards domestic producers from non-compliant imports.
Competitive Landscape
The North America Juices Market shows moderate consolidation, with leading players such as PepsiCo, The Coca-Cola Company, and Tropicana Brands Group holding a significant share. These companies are focusing on portfolio rationalization, exiting low-margin commodity juice segments, and investing in premium, functional, and organic products that command higher prices and are less susceptible to private-label competition. Tropicana Brands Group, for instance, closed underperforming plants and reduced its stock-keeping unit (SKU) count by approximately 20% by early 2026, concentrating on low-sugar and no-sugar-added variants to streamline production and improve margins. Coca-Cola reformulated its Simply brand in 2024 and launched Simply Pop in February 2025, blending juice with prebiotics to appeal to wellness-focused consumers.
The fastest-growing segment in the market is driven by innovation in functional formulations, sustainable packaging, and direct-to-consumer channels. Smaller players like Suja Life and Evolution Fresh have leveraged high-pressure processing (HPP) technology and organic certification to achieve retail prices exceeding USD 6 per 12-ounce bottle. Similarly, National Beverage's success with LaCroix sparkling water underscores the potential of flavor innovation and brand storytelling. Vita Coco, a smaller entrant, is expanding beyond coconut water into functional juice blends, targeting hydration and wellness occasions, further fueling growth in this segment.
Other developments in the market include uneven adoption of advanced technologies. HPP technology remains concentrated among well-funded brands due to its high capital requirements, with machines costing approximately USD 10 million. Aseptic filling lines, which cost between USD 5-10 million, are more accessible to mid-tier companies seeking ambient shelf life for their products. Additionally, the United States Department of Agriculture's (USDA) enhanced organic traceability measures, such as GLOBAL INTEGRITY import certificates, expanded Harmonized Tariff Schedule codes, and port-sampling partnerships, have increased compliance costs. However, these measures have also protected premium pricing for certified organic brands, creating a competitive advantage by safeguarding against non-compliant imports.
North America Juices Industry Leaders
PepsiCo Inc.
The Coca-Cola Company
Tropicana Brands Group
Keurig Dr Pepper Inc.
Ocean Spray Cranberries Inc.
- *Disclaimer: Major Players sorted in no particular order

Recent Industry Developments
- May 2025: PepsiCo acquired Poppi, a prebiotic soda brand, for USD 1.9 billion. This represents the company's largest investment in functional beverages and indicates a strategic shift from traditional juice products to gut-health-focused carbonated drinks.
- May 2024: Mott’s - launched Mott’s Active, a new fruit-flavored hydrating juice beverage for active kids with naturally sourced electrolytes, no added sugars, and no artificial flavors. This is the first juice drink product from Mott’s brand to offer hydration benefits via added electrolytes. Mott’s Active is available now in 8 oz. 6-packs at mass and grocery retailers nationwide.
- April 2024: Keurig Dr Pepper Inc. announced an agreement to acquire all production, sales, and distribution assets of independent bottler Kalil Bottling Co. (Kalil). With the agreement, KDP's Company-owned direct-store-delivery (DSD) operations will gain new bottling and distribution rights in Arizona to key KDP brands, including Canada Dry, 7UP, A&W, Snapple and Core Hydration, servicing 7.4 million consumers and approximately 4,500 retail outlets.


North America Juices Market Report Scope
The juice market consists of non-alcoholic beverages made from fresh, concentrated, or reconstituted fruit and vegetable extracts. These products include 100% juices, nectars, juice drinks, and fortified variants. The market primarily serves health-conscious consumers looking for natural hydration, essential vitamins, and appealing flavors, spanning retail, foodservice, and emerging functional segments. The market is segmented by product type, which includes 100% juice, juice drinks (up to 24% juice), juice concentrates, and nectars; by packaging type, which includes aseptic packages, glass bottles, metal cans, polyethylene terephthalate (PET) bottles, and disposable cups and pouches; by category, which includes organic and conventional; by distribution channel, which includes on-trade and off-trade, with off-trade further segmented into supermarkets and hypermarkets, convenience stores, online retail, and others; and by geography, which includes the United States, Canada, Mexico, and the rest of North America. The market sizing has been done in value terms in USD and Volume in liters for all the abovementioned segments.
| 100% Juice |
| Juice Drinks (up to 24% Juice) |
| Juice Concentrates |
| Nectars |
| Aseptic packages |
| Glass Bottles |
| Metal Can |
| PET Bottles |
| Disposable Cups and Pouches |
| Organic |
| Conventional |
| On-trade | |
| Off-trade | Supermarkets and Hypermarkets |
| Convenience Stores | |
| Online Retail | |
| Others |
| United States |
| Canada |
| Mexico |
| Rest of North America |
| By Product Type | 100% Juice | |
| Juice Drinks (up to 24% Juice) | ||
| Juice Concentrates | ||
| Nectars | ||
| By Packaging Type | Aseptic packages | |
| Glass Bottles | ||
| Metal Can | ||
| PET Bottles | ||
| Disposable Cups and Pouches | ||
| By Category | Organic | |
| Conventional | ||
| By Distribution Channel | On-trade | |
| Off-trade | Supermarkets and Hypermarkets | |
| Convenience Stores | ||
| Online Retail | ||
| Others | ||
| By Geography | United States | |
| Canada | ||
| Mexico | ||
| Rest of North America | ||


Market Definition
- Carbonated Soft Drinks (CSDs) - Carbonated soft drinks (CSDs) refer to non-alcoholic beverages that are carbonated and typically flavored, containing dissolved carbon dioxide to create effervescence. These beverages commonly include cola, lemon-lime, orange, and various fruit-flavored sodas. Marketed in cans, bottles, or fountain dispense.
- Juices - We have considered packaged juices which encompass non-alcoholic beverages derived from fruits, vegetables, or a combination thereof, processed and sealed in various packaging formats such as bottles, cartons, or pouches. Excluding fresh juices, this market segment involves commercially prepared and preserved juices, often with added preservatives and flavors.
- Ready-to-Drink (RTD) Tea and RTD Coffee - Ready-to-Drink (RTD) tea and RTD coffee are pre-packaged, non-alcoholic beverages that are brewed and prepared for consumption without further dilution. RTD tea typically includes various tea varieties, infused with flavors and sweeteners, and comes in bottles, cans, or cartons. Similarly, RTD coffee involves pre-brewed coffee formulations, often mixed with milk, sugar, or flavorings, and is conveniently packaged for on-the-go consumption.
- Energy Drinks - Energy drinks are non-alcoholic beverages formulated to provide a quick boost of energy and alertness. Whereas, sports drinks are beverages designed to hydrate and replenish electrolytes, particularly after physical exertion, exercise, or intense activity
| Keyword | Definition |
|---|---|
| Carbonated Soft Drinks | Carbonated soft drinks (CSDs) are a combination of carbonated water and flavouring, sweetened by sugar or a non-sugar sweeteners. |
| Standard Cola | Standard Cola is defined as the original flavor of cola soda. |
| Diet Cola | A cola-based soft drink containing no or low amounts of sugar |
| Fruit Flavored Carbonates | A carbonated beverage prepared from fruit juice/fruit flavor with carbonated water and containing sugar, dextrose, invert sugar or liquid glucose either singly or in combination. It may contain peel oil and fruit essences. |
| Juice | Juice is a drink made from the extraction or pressing of the natural liquid contained in fruit and vegetables. |
| 100% Juice | Fruit/vegetable juice made from fruit in the form of its juice with no water added to make up the volume. It is not permitted to add sugars, sweeteners, preservatives, flavourings or colourings to fruit juice. |
| Juice Drinks (up to 24% Juice) | Fruit/vegetable juice drinks with up to 24% fruits/vegetable extract. |
| Nectars (25-99% Juice) | Juices that can have between 25 and 99% of fruit, with the minimum legal limits defined depending on the type of fruit |
| Juice concentrates | Juice Concentrates are those form of juices when most of this liquid is removed resulting in a thick, syrupy product known as juice concentrate. |
| RTD Coffee | Packaged coffee beverages that are sold in a prepared form and are ready for consumption at the time of purchase. |
| Iced Coffee | An iced coffee is a cold version of coffee, usually a combination of hot espresso and milk with ice added to it. |
| Cold Brew Coffee | Cold brew also called cold water extraction or cold pressing is made by steeping ground coffee in room-temperature water for several hours. |
| RTD Tea | Ready-to-drink (RTD) tea is a packaged tea product ready for immediate consumption without brewing or preparation |
| Iced Tea | Ice tea or iced tea is a drink made from tea without milk but with sugar and sometimes fruit flavourings, drunk cold. |
| Green Tea | Green tea is a tea beverage which promotes mental alertness, relieving digestive symptoms and promoting weight loss. |
| Herbal Tea | Herbal tea beverages are made from the infusion or decoction of herbs, spices, or other plant material in hot water. |
| Energy Drink | A type of drink containing stimulant compounds, usually caffeine, which is marketed as providing mental and physical stimulation. They may or may not be carbonated and may also contain sugar, other sweeteners, or herbal extracts, among numerous possible ingredients. |
| Sugar-free or Low-calories Energy Drinks | Sugar-free or Low-calories Energy Drinks are sugar-free, artificially sweetened energy drinks with few or no calories. |
| Traditional Energy Drink | Traditional Energy Drinks are functional soft drinks containing ingredients designed to boost the consumer's energy. |
| Natural/Oraganic Energy Drinks | Natural/Organic energy drinks are energy drinks free of artificial sweeteners and synthetic colorings. Instead, they contain naturally derived ingredients such as green tea, yerba mate, and botanical extracts. |
| Energy Shots | A small but highly concentrated energy drink that contains large amounts of caffeine and/or other stimulants. The quantity is comparatively smaller compared to energy drinks. |
| Sports Drink | Sports drinks are beverages designed specifically for the rapid supply of fluid, carbohydrates, and electrolytes before, during or after exercise. |
| Isotonic | Isotonic drinks contain similar concentrations of salt and sugar as in the human body, and are designed to quickly replace fluids lost during exercise but with an increase of carbohydrate. |
| Hypertonic | Hypertonic drinks have a higher concentration of salt and sugar than the human body. They are best drunk after exercise as it is important to replace glycogen levels quickly after exercise. |
| Hypotonic | Hypotonic drinks are designed to quickly replace fluids lost during exercise. They have very low carbohydrate content and a lower concentration of salt and sugar than the human body. |
| Electrolyte-Enhanced Water | Electrolyte water is water infused with electrically-charged minerals, such as sodium, potassium, calcium, and magnesium. |
| Protein-based Sport Drinks | Protein-based sports drinks are those sports drinks which has added protein in it that will improve performance and reduce muscle protein breakdown. |
| On-Trade | The on-trade refers to places that sell beverages for immediate consumption on the premises like bars, restaurants, and pubs |
| Off-Trade | Off-trade usually means places like liquor stores, supermarkets and other places where you don't consume the beverage right away. |
| Convenience Store | A retail business that provides the public with a convenient location to quickly purchase a wide variety of consumable products and services, generally food and gasoline. |
| Specialty store | A specialty store is a shop/store that carries a deep assortment of brands, styles, or models within a relatively narrow category of goods |
| Online Retail | Online retail is a type of eCommerce whereby a business sells goods or services directly to consumers from a website. |
| Aseptic Packaging | Aseptic packaging refers to the filling of a cold, commercially sterile product under sterile conditions into a presterilized container and closure under sterile conditions to form a seal that effectively excludes microorganisms. These includes tetra packs, cartons, pouches etc. |
| PET Bottle | PET bottle means a bottle made of polyethylene terephthalate. |
| Metal Cans | Metal containers made of aluminum or tin- plated or zinc-plated steel, which are commonly used for packaging food, beverages or other products. |
| Disposable Cups | Disposable Cup means a cup or other container designed for single use to serve beverages, such as water, cold drinks, hot drinks and alcoholic beverages. |
| Gen Z | A way of referring to the group of people who were born in the late 1990s and early 2000s. |
| Millenial | Anyone born between 1981 and 1996 (ages 23 to 38 in 2019) is considered a Millennial |
| Taurine | Taurine is an amino acid that supports immune health and nervous system function. |
| Bars & Pubs | It is a drinking establishment licensed to serve alcoholic drinks for consumption on the premises. |
| Café | It is a foodservice establishment serving refreshments (mainly coffee) and light meals. |
| On the go | It means doing / dealing with while busily engaged with something and not diverting plans in order to accommodate. |
| Internet Penetration | The Internet Penetration Rate corresponds to the percentage of the total population of a given country or region that uses the Internet. |
| Vending Machine | A machine that dispenses small articles such as food, drinks, or cigarettes when a coin or token is inserted |
| Discount store | A discount store or discounter offers a retail format in which products are sold at prices that are in principle lower than an actual or supposed "full retail price". Discounters rely on bulk purchasing and efficient distribution to keep down costs. |
| Clean Label | Clean label on the beverage market are drinks that are made from few ingredients of natural origin and are not or only slightly processed. |
| Caffeine | An alkaloid compound which is a stimulant of the central nervous system. It is mainly used recreationally, as a mild cognitive enhancer to increase alertness and attentional performance. |
| Extreme sport | Action sports, adventure sports or extreme sports are activities perceived as involving a high degree of risk. |
| High-intensity interval training | It incorporates several rounds that alternate between several minutes of high intensity movements to significantly increase the heart rate to at least 80% of one's maximum heart rate, followed by short periods of lower intensity movements. |
| Shelf life | The length of time for which an item remains usable, fit for consumption, or saleable. |
| Cream Soda | Cream soda is a sweet soft drink. Generally flavored with vanilla and based on the taste of an ice cream float |
| Root Beer | Root beer is a sweet North American soft drink traditionally made using the root bark of the sassafras tree Sassafras albidum or the vine of Smilax ornata as the primary flavor. Root beer is typically, but not exclusively, non-alcoholic, caffeine-free, sweet, and carbonated. |
| Vanilla Soda | A carbonated soft drink flavoured with vanilla. |
| Dairy-Free | A product that does not contain any milk or milk products from cows, sheep or goats. |
| Caffeine-Free Energy Drinks | Caffeine-free energy drinks rely on other ingredients to boost the energy. Popular choices include amino acids, B vitamins, and electrolytes. |


Research Methodology
Mordor Intelligence follows a four-step methodology in all our reports.
- Step-1: IDENTIFY KEY VARIABLES: In order to build a robust forecasting methodology, the variables and factors identified in Step 1 are tested against available historical market numbers. Through an iterative process, the variables required for market forecast are set, and the model is built on the basis of these variables.
- Step-2: Build a Market Model: Market-size estimations for the forecast years are in nominal terms. Inflation is not a part of the pricing, and the average selling price (ASP) is kept constant throughout the forecast period for each country.
- Step-3: Validate and Finalize: In this important step, all market numbers, variables, and analyst calls are validated through an extensive network of primary research experts from the market studied. The respondents are selected across levels and functions to generate a holistic picture of the market studied.
- Step-4: Research Outputs: Syndicated reports, custom consulting assignments, databases & subscription platforms


