Market Overview
| Study Period | 2021 - 2031 |
|---|---|
| Forecast Data Period | 2026 - 2031 |
| Historical Data Period | 2021 - 2024 |
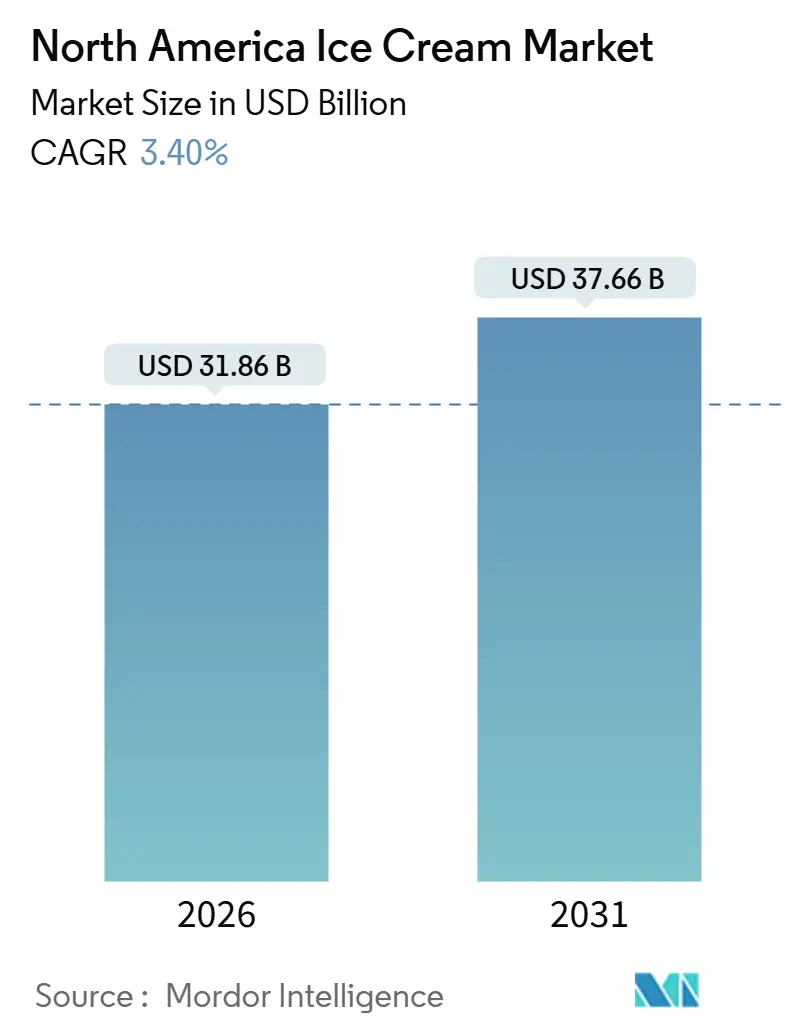
| Market Size (2026) | USD 31.86 Billion |
| Market Size (2031) | USD 37.66 Billion |
| Growth Rate (2026 - 2031) | 3.40% CAGR |
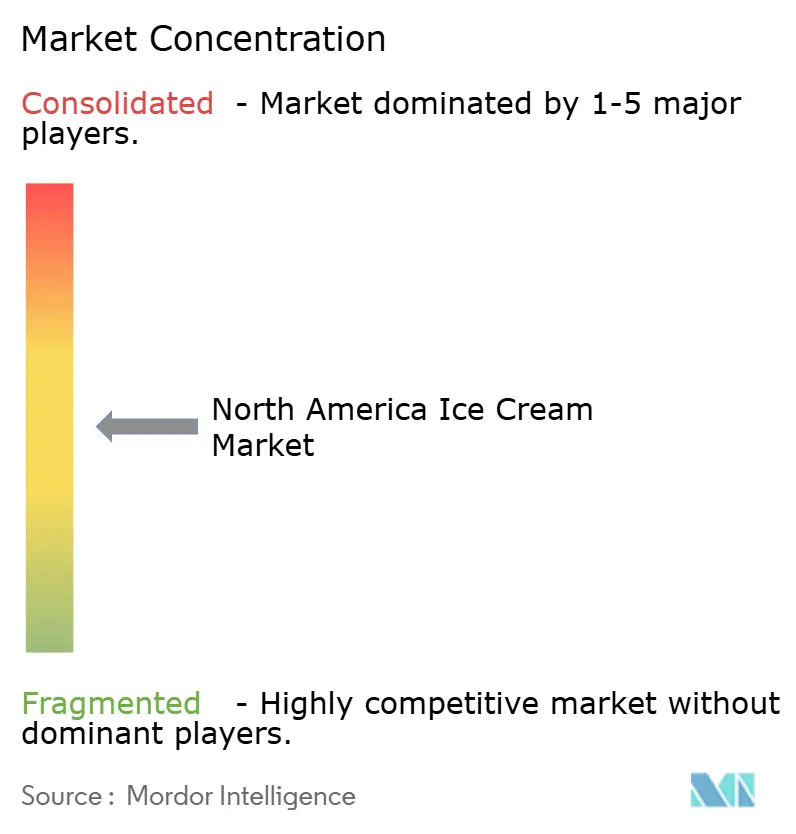
| Market Concentration | Medium |
Major Players*Disclaimer: Major Players sorted in no particular order Image © Mordor Intelligence. Reuse requires attribution under CC BY 4.0. |
|
North America Ice Cream Market Analysis by Mordor Intelligence
The North America ice cream market size is estimated at USD 31.86 billion in 2026, and is expected to reach USD 37.66 billion by 2031, at a CAGR of 3.40% during the forecast period (2026-2031). This measured pace reflects a maturing category where volume gains depend less on household penetration, already near saturation across the United States and Canada, and more on premiumization, format innovation, and the substitution of dairy formulations with plant-based alternatives that command higher price points. The International Dairy Foods Association reported that 1.31 billion gallons of ice cream were produced in 2024, sustaining a direct economic impact of USD 11.6 billion and creating 26,704 manufacturing jobs. However, the industry faces margin pressure from cold-chain complexity and episodic contamination events that can erode years of brand equity overnight[1]Source: International Dairy Food Association, "Making a Difference for Dairy", idfa.org. Contamination recalls and cold-chain fragility still threaten trust and profitability, yet the substitution of dairy with precision-fermented proteins and oat-milk bases creates fresh white space for brands that can deliver indulgence without animal inputs, a dynamic that will shape the competitive chessboard across the North America ice cream market.
Key Report Takeaways
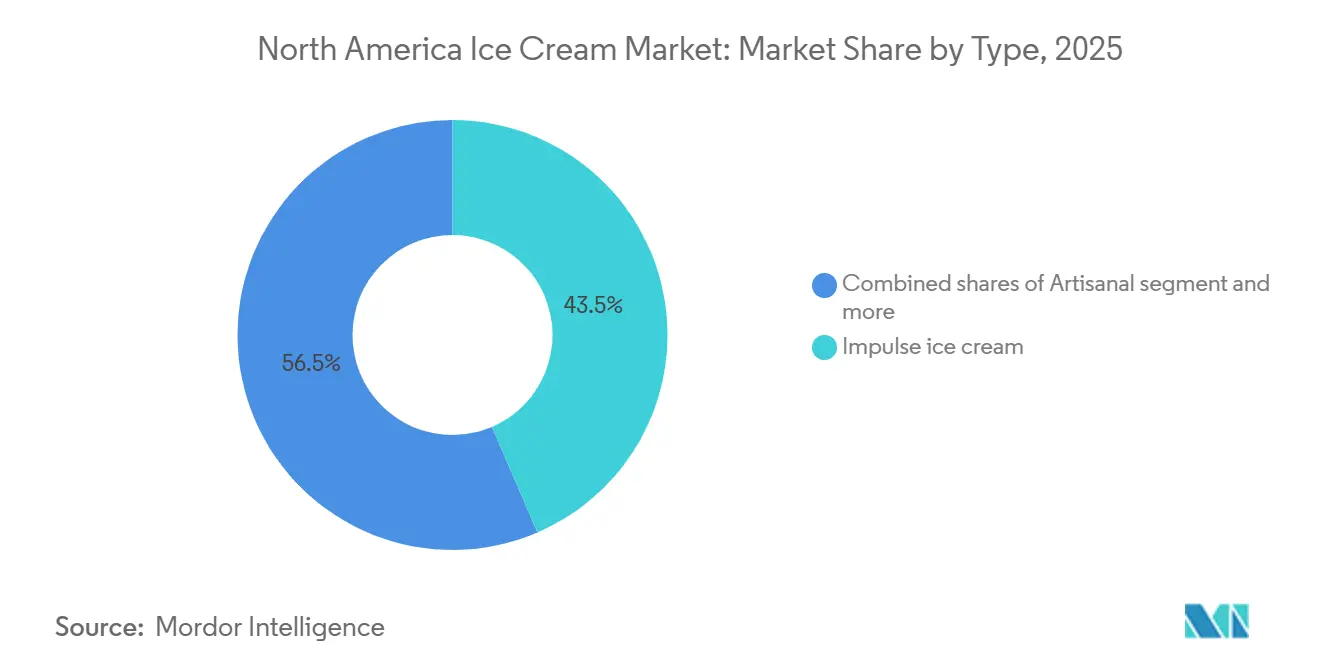
- By type, impulse products led with 43.54% of the North America ice cream market share in 2025, while artisanal formats are projected to expand at a 4.03% CAGR through 2031.
- By category, dairy held 78.32% revenue share in 2025, whereas non-dairy is forecast to grow at a 3.92% CAGR to 2031.
- By flavor, vanilla captured 29.61% share of the North America ice cream market size in 2025; fruit-based profiles are the fastest risers at a 4.55% CAGR to 2031.
- By packaging, single-serve cups commanded 26.11% of packaging volume in 2025 and are advancing at a 5.35% CAGR through 2031, the swiftest among all formats.
- By distribution channel, retail accounted for 85.34% of sales in 2025, yet Horeca is recovering fastest at a 3.87% CAGR through 2031.
- By geography, the United States contributed 85.22% of regional revenue in 2025, whereas Mexico is set to climb at a 4.23% CAGR.
Note: Market size and forecast figures in this report are generated using Mordor Intelligence’s proprietary estimation framework, updated with the latest available data and insights as of January 2026.
North America Ice Cream Market Trends and Insights
Drivers Impact Analysis*
| Driver | (~) % Impact on CAGR Forecast | Geographic Relevance | Impact Timeline |
|---|---|---|---|
| Rising demand for low-fat, sugar-free, and functional ice creams | +0.5% | United States, Canada; early adoption in urban metros | Medium term (2-4 years) |
| Novelty flavors and formats attracting consumers | +0.4% | United States, Mexico; social-media-driven demand in Gen Z cohorts | Short term (≤ 2 years) |
| Growing popularity of non-dairy and plant-based options | +0.6% | United States, Canada; spillover to Mexico urban centres | Medium term (2-4 years) |
| Premium and artisanal products driving indulgence trends | +0.5% | United States, Canada; coastal and college-town clusters | Long term (≥ 4 years) |
| Social media and digital marketing boosting demand | +0.3% | North America-wide, the highest engagement in the United States metros | Short term (≤ 2 years) |
| Consumers experimenting with seasonal and unique offerings | +0.2% | United States, Canada; limited-edition cycles tied to holidays | Short term (≤ 2 years) |
| Source: Mordor Intelligence | |||
Rising demand for low-fat, sugar-free, and functional ice creams
Functional ice cream formulations that embed protein, fiber, or prebiotic ingredients are capturing share among health-conscious consumers who refuse to abandon indulgence entirely. Two Spoons launched a GLP-1-friendly line in 2024 that delivers 20 grams of protein and 5 grams of net carbs per pint, targeting the estimated 15 million Americans using semaglutide or tirzepatide therapies who seek portion-controlled desserts that align with weight-management protocols. The U.S. Food and Drug Administration finalized its updated "healthy" nutrient-content claim rule in December 2024, permitting manufacturers to highlight reduced sugar and added nutrients on front-of-pack labels, which accelerates reformulation cycles and shelf resets[2]Source: U.S. Food and Drug Administration, "7 Months of Reforms", fda.gov. Brands such as Halo Top and Natty Ice Cream have pivoted to high-protein, low-calorie positioning, yet the challenge lies in replicating the creamy mouthfeel of full-fat dairy without relying on gums or stabilizers that trigger clean-label skepticism.
Novelty flavors and formats attracting consumers
Limited-edition collaborations and unconventional flavor profiles generate social-media virality that translates into foot traffic and trial purchases, particularly among Gen Z consumers who treat dessert as content. Van Leeuwen partnered with Guinness in July 2025 to launch "Lovely Day for a Guinness" ice cream, blending the stout's roasted malt notes with a custard base, while See's Candies and McConnell's co-released three flavors, Brown Sugar with Milk Bordeaux, PB&J, and Strawberry, that leverage nostalgic candy profiles to command USD 12 per pint. Turkey Hill introduced a Barbie-themed line in July 2024 featuring Strawberry Marshmallow and Frosted Cupcake variants timed to the film's release, demonstrating how intellectual-property licensing can compress product-development cycles and amplify reach. Even polarizing flavors such as Van Leeuwen's Hidden Valley Ranch ice cream drive earned media impressions that far exceed paid advertising budgets.
Growing popularity of non-dairy and plant-based options
Oat-milk, cashew-milk, and precision-fermentation bases are no longer niche; they represent the fastest-growing category at 3.92% CAGR as lactose-intolerant, vegan, and flexitarian consumers demand parity in taste and texture with conventional dairy. Ben & Jerry's expanded its oat-milk portfolio in 2024, while Perfect Day's animal-free whey protein, produced via microbial fermentation, debuted in Breyers formulations, delivering identical casein functionality without the environmental footprint of cattle farming. Oatly and Carvel announced a co-branding partnership in 2024 to distribute soft-serve oat-based ice cream across Carvel's franchise network, a signal that plant-based options are migrating from specialty retailers into mainstream impulse channels. Adoption is concentrated in the United States coastal metros and Canadian cities, with spillover into Mexico's urban centers as cold-chain infrastructure improves and middle-class households prioritize health and environmental attributes.
Premium and artisanal products driving indulgence trends
Small-batch producers that emphasize local dairy sourcing, organic certification, and elevated butterfat content are capturing share from mass-market incumbents, particularly in the take-home segment, where consumers justify USD 11 to USD 12 pints as affordable luxury. McConnell's Fine Ice Creams and Van Leeuwen Ice Cream both operate at premium price points, leveraging direct-to-consumer e-commerce and scoop-shop networks to build brand equity before negotiating placement in Whole Foods and specialty grocers. Van Leeuwen opened locations in Boston Seaport in September 2024, Chestnut Hill in April 2024, and Harvard Square and Back Bay in 2025, while Jeni's Splendid Ice Creams expanded to more than 80 scoop shops and commissioned a new production facility to meet wholesale demand. This trend is most durable in the United States coastal and college-town markets, where disposable incomes and food-culture engagement support sustained premiumization.
Restraints Impact Analysis*
| Restraint | (~) % Impact on CAGR Forecast | Geographic Relevance | Impact Timeline |
|---|---|---|---|
| Health concerns over sugar and calorie content | -0.3% | United States, Canada; regulatory pressure intensifying | Medium term (2-4 years) |
| Seasonal demand fluctuations affecting sales | -0.2% | North America-wide; most acute in northern climates | Short term (≤ 2 years) |
| High perishability and cold-chain dependency | -0.3% | United States, Mexico; infrastructure gaps in rural areas | Long term (≥ 4 years) |
| Risk of contamination or spoilage impacting brand image | -0.2% | United States, Canada; FDA enforcement is increasing | Medium term (2-4 years) |
| Source: Mordor Intelligence | |||
Health concerns over sugar and calorie content
Obesity prevalence and chronic-disease awareness are driving consumers to scrutinize nutrition labels, and ice cream's high sugar and saturated-fat profile places it squarely in the discretionary category that health-conscious households reduce first[3]Source: Government of Canada, "Infographic: Front-of-Package Nutrition Labelling", canada.ca. The FDA's updated "healthy" claim rule, finalized in December 2024, sets stricter thresholds for added sugars and sodium, effectively disqualifying most conventional ice creams from using the descriptor and pushing brands toward reformulation with high-intensity sweeteners such as stevia, monk fruit, or allulose. However, these substitutes often introduce off-notes or require higher inclusion rates that inflate costs, and consumer acceptance remains uneven; some cohorts reject "chemical-sounding" ingredients even when derived from natural sources.
Seasonal demand fluctuations affecting sales
Ice cream consumption spikes in summer months, with Independence Day representing the single largest sales event, yet demand craters in winter, forcing manufacturers to carry excess inventory or idle production lines for extended periods. The International Dairy Foods Association notes that production schedules concentrate between March and September, compressing labor utilization and capital efficiency, while retailers demand promotional pricing during shoulder seasons to clear shelf space for holiday confections. Thanksgiving and Christmas offer secondary peaks when ice cream is paired with pies, but these occasions cannot offset the revenue trough in January through March. Manufacturers have experimented with winter-specific flavors, peppermint, gingerbread, eggnog, and bundled promotions with baked goods, yet these tactics yield only marginal volume lifts.
*Our forecasts treat driver/restraint impacts as directional, not additive. The impact forecasts reflect baseline growth, mix effects, and variable interactions.
Segment Analysis
By Type: Artisanal Outpaces Impulse Despite Smaller Base
Impulse ice cream, single-serve bars, cones, and novelties sold through convenience stores and vending machines held 43.54% of market share in 2025, reflecting its ubiquity and low price points that encourage spontaneous purchases. Take-home formats, which include multi-serve tubs and family packs, capture the balance of the mass market, yet artisanal ice cream is expanding at a 4.03% CAGR through 2031, the fastest rate among type segments, as consumers prioritize ingredient transparency and are willing to pay USD 11 to USD 12 per pint for small-batch production and local dairy sourcing. Van Leeuwen and McConnell exemplify this shift, operating scoop shops and direct-to-consumer e-commerce channels that build brand equity before negotiating placement in Whole Foods and specialty grocers.
Impulse formats benefit from established distribution networks and point-of-sale visibility, yet they face margin pressure from retailer consolidation and private-label competition. Take-home ice cream remains the workhorse of the category, driven by family consumption occasions and promotional pricing, but growth is constrained by household penetration near saturation and limited differentiation among mainstream brands. The artisanal segment's premium positioning and storytelling, emphasizing farm partnerships, organic certification, and elevated butterfat, create defensible niches that insulate brands from price-based competition, suggesting that the bifurcation between value and premium will deepen over the forecast period.


By Category: Non-Dairy Gains Share as Precision Fermentation Scales
Dairy ice cream accounted for 78.32% of the market in 2025, anchored by conventional milk, cream, and butterfat formulations that define the category's sensory benchmarks, yet non-dairy alternatives are advancing at a 3.92% CAGR as oat-milk, cashew-milk, and precision-fermentation bases replicate the mouthfeel and flavor release of animal-derived ingredients. Ben & Jerry's expanded its oat-milk portfolio in 2024, while Perfect Day's animal-free whey protein, produced via microbial fermentation, debuted in Breyers formulations, delivering identical casein functionality without the environmental footprint of cattle farming.
Oatly and Carvel announced a co-branding partnership in 2024 to distribute soft-serve oat-based ice cream across Carvel's franchise network, a signal that plant-based options are migrating from specialty retailers into mainstream impulse channels. Dairy formulations retain structural advantages: established supply chains, lower input costs, and consumer familiarity that reduces trial barriers. However, lactose intolerance affects an estimated 36% of Americans, and flexitarian diets are normalizing plant-based consumption even among non-vegans, creating a tailwind for non-dairy growth. The challenge remains cost parity; oat and nut bases typically add 20 to 30% per pint versus dairy, which compresses margins unless brands can command a sustainability premium or achieve scale economies through co-manufacturing partnerships.
By Flavor: Fruit Profiles Accelerate on Clean-Label Appeal
Vanilla-based flavors, classic vanilla, French vanilla, vanilla bean, captured 29.61% of market share in 2025, reflecting their versatility as standalone scoops or mix-in bases, yet fruit flavors such as strawberry, mango, blueberry, and lemon are growing at 4.55% annually, the fastest rate among flavor segments. This acceleration is driven by clean-label positioning: fruit inclusions signal naturalness and allow brands to reduce reliance on artificial colors and flavors that trigger consumer skepticism. Chocolate-based profiles, including dark chocolate, chocolate fudge, and brownie, remain a core pillar but face saturation in mature markets. Nut flavors, pistachio, almond, hazelnut, occupy a premium niche, often paired with artisanal positioning and higher butterfat content.
The "Others" category, which encompasses novelty profiles such as lavender, matcha, and savory inclusions like olive oil or black sesame, is expanding as brands seek differentiation and social-media virality; Van Leeuwen's Hidden Valley Ranch ice cream exemplifies this strategy, generating earned-media impressions that far exceed paid advertising budgets. Seasonal limited editions tied to holidays or cultural moments create urgency and justify higher price points, while also allowing manufacturers to test concepts before committing to year-round production. Fruit flavors are particularly well-suited to this cadence, as strawberry and lemon variants can be repositioned as summer exclusives, and cranberry or pomegranate as winter offerings, sustaining consumer interest across the calendar.
By Packaging: Single-Serve Cups Lead Sustainability and Convenience
Single-serve cups and containers represented 26.11% of packaging volume in 2025 and are forecast to grow at 5.35% annually, the fastest rate of any format, as brands adopt compostable fiber and recycled-content plastics to meet retailer sustainability mandates and capture on-the-go consumption occasions. Huhtamaki launched compostable ice cream cups in July 2025 that contain less than 10% plastic and are certified for home and industrial composting, addressing regulatory pressure in California and other jurisdictions that restrict single-use plastics. Sacred Serve introduced a 100% recyclable carton in August 2021, eliminating plastic liners, while Wells Enterprises converted its 3-ounce cups from polystyrene to polypropylene to improve recyclability and reduce material costs. Tubs and family packs remain the largest format by volume, driven by household consumption and promotional pricing, yet growth is constrained by household size declines and the shift toward portion control.
Cones and bars/sticks occupy the impulse segment, benefiting from point-of-sale visibility in convenience stores and vending machines, but they face margin pressure from private-label competition and limited differentiation. The "Others" category includes sandwiches, popsicles, and specialty formats that cater to niche occasions. Single-serve cups are uniquely positioned to capture multiple trends: sustainability-conscious consumers who prioritize recyclable or compostable materials, health-focused cohorts who seek portion control, and on-the-go occasions where resealable tubs are impractical. Brands that invest in fiber-based or molded-pulp packaging can also command a sustainability premium, offsetting the higher material costs and aligning with corporate ESG commitments that influence retail buyer decisions.

By Distribution Channel: Horeca Rebounds as Operators Reintroduce Dessert Menus
Retail channels commanded 85.34% of distribution in 2025, spanning supermarkets and hypermarkets, specialty stores, convenience outlets, and online platforms, yet the Horeca segment, hotels, restaurants, and cafés, is expanding annually as operators reintroduce dessert menus and leverage premium scoops to lift check averages. Supermarkets and hypermarkets remain the dominant retail subchannel, offering broad assortments and promotional pricing that drive household pantry loading. Convenience stores capture impulse purchases through single-serve formats and point-of-sale visibility, and online retailers are gaining share as direct-to-consumer brands bypass traditional distribution to preserve margin and control the customer experience.
The Horeca channel's recovery at a 3.87% CAGR through 2031 is tied to post-pandemic dining normalization and the premiumization of dessert offerings: restaurants are partnering with artisanal brands such as Jeni's and Eclipse Foods, a plant-based ice cream manufacturer, which has prioritized foodservice partnerships, supplying non-dairy formulations to restaurants and cafés that seek to accommodate dietary restrictions without maintaining separate inventory. Retail channels retain structural advantages, scale, established logistics, and consumer familiarity, but Horeca offers higher per-unit margins and brand-building opportunities that are difficult to replicate in grocery aisles, suggesting that hybrid distribution strategies will become the norm for premium and artisanal players.
Geography Analysis
The United States held 85.22% of North American ice cream revenue in 2025, reflecting its large population, high per-capita consumption, and mature retail infrastructure that spans supermarkets, convenience stores, and e-commerce platforms. Major manufacturers have responded with capacity expansions. Blue Bell announced a USD 100 million expansion in Sylacauga, Alabama, in 2024, and Tillamook allocated USD 85 million to its Boardman, Oregon, plant with a focus on renewable energy and 50 additional jobs. These investments signal confidence in long-term demand, yet they also reflect the need to modernize cold-chain infrastructure and comply with evolving food-safety regulations under FDA 21 CFR Part 135, which mandates minimum butterfat content and prohibits certain stabilizers in products labeled "ice cream."
Mexico is the fastest-growing geography at 4.23% CAGR from 2026 to 2031, propelled by rising disposable incomes, a younger demographic that favors indulgent formats, and expanding cold-chain infrastructure that improves product availability in secondary cities. Local players such as Holanda and Nutrisa dominate the artisanal and impulse segments, leveraging regional flavor profiles, tamarind, mango-chili, cajeta, that resonate with domestic consumers, while multinational brands are increasing investment to capture premiumization opportunities. The challenge remains logistics: Mexico's cold-chain capacity lags the United States and Canada, particularly in rural areas, which elevates spoilage risk and limits distribution reach. However, infrastructure improvements funded by nearshoring investments and government initiatives are expected to narrow this gap, enabling broader penetration of take-home and single-serve formats that require consistent refrigeration from production to point of sale.
Canada and the Rest of North America account for the remaining market share, with Canada exhibiting consumption patterns like the United States, high per-capita intake, strong retail penetration, and growing demand for plant-based and functional formulations, while smaller markets such as Central American countries remain underdeveloped due to income constraints and limited cold-chain infrastructure. Canadian consumers are particularly receptive to organic and locally sourced claims, which has enabled regional cooperatives and artisanal brands to capture share from multinational incumbents. The Rest of North America category includes emerging markets where ice cream is transitioning from a luxury to a staple, yet growth is contingent on continued investment in refrigeration logistics and retail modernization that can support the category's perishability requirements.
Competitive Landscape
The North America ice cream market exhibits moderate fragmentation, as multinational players such as Unilever and Froneri coexist with regional cooperatives like Tillamook and insurgent artisanal brands that exploit white space in organic, vegan, and functional niches. Unilever announced plans to spin off its ice cream division in 2024, a restructuring that will separate brands including Ben & Jerry's, Magnum, and Breyers into a standalone entity with greater operational flexibility and capital-allocation autonomy. This move signals a broader industry trend: legacy conglomerates are divesting non-core categories to focus on higher-margin segments, while private-equity buyers and specialist operators acquire these assets to pursue operational improvements and portfolio bolt-ons.
Froneri's USD 200 million expansion in Maryland and Nestlé's USD 50 million investment in California underscore the capital intensity required to maintain market position, yet smaller players are circumventing this barrier by outsourcing production to co-manufacturers and concentrating resources on brand-building, direct-to-consumer channels, and social-media engagement that generate disproportionate reach relative to advertising spend. Technology adoption is accelerating as a competitive differentiator: Unilever deployed 100,000 AI-enabled freezers by 2024 and targets 350,000 units by the end of 2025, using machine learning to optimize temperature control, predict maintenance needs, and reduce energy consumption by up to 20%. Precision fermentation, exemplified by Perfect Day's animal-free whey protein, is enabling brands to replicate dairy functionality without animal inputs, appealing to sustainability-conscious consumers and reducing exposure to volatile milk-commodity markets.
Packaging innovation, compostable cups, recycled-content tubs, and molded-pulp containers address retailer mandates and consumer preferences, while also creating barriers to entry for competitors that lack the scale or supply-chain partnerships to source sustainable materials at competitive cost. White-space opportunities remain in functional formulations that embed protein, fiber, or prebiotic ingredients, as well as in regional flavor profiles that cater to Hispanic and Asian diasporas in the United States and Canada. Emerging disruptors such as Van Leeuwen and Jeni's have demonstrated that direct-to-consumer models and scoop-shop networks can build brand equity before negotiating retail placement, bypassing the slotting fees and promotional requirements that traditionally favor incumbents.
North America Ice Cream Industry Leaders
-
Froneri International Limited
-
Wells Enterprises Inc.
-
Unilever
-
Blue Bell Creameries, L.P.
-
Tillamook County Creamery Association
- *Disclaimer: Major Players sorted in no particular order

Recent Industry Developments
- December 2025: Ben & Jerry's announced that it would introduce five new ice bar flavors. The new flavors included Cookie Dough, Chocolate Fudge Brownie, Strawberry Cheesecake, PB Pretzel, and Caramel Blondie, a swirl. The Ben & Jerry's Ice Cream Bars were expected to be available in the freezer aisle starting January 2026, offered in a four 2.5oz-bar multipack, priced between USD 5.99 and USD 7.49. Additionally, a single Cookie Dough Ben & Jerry's Ice Cream Bar was set to launch in convenience stores the following spring, priced at USD 3.99.
- October 2025: Wells Enterprises debuted Nutella Ice Cream and Kinder Bueno Frozen Dessert at the NACS Show in Chicago, held from October 14–17. The two new frozen treats, available in both pints and cones, were scheduled to begin shipping to convenience distributors on December 1, 2025, with broader retail distribution planned for spring 2026. Created to expand the frozen category, these offerings were expected to attract new shoppers, boost overall frozen dessert sales, and reinforce Wells' leadership in frozen innovation.
- August 2025: Frida, the parenting brand recognized for addressing postpartum topics directly, teamed up with OddFellows Ice Cream Co. to create a limited-edition breast milk-inspired flavor. The release coincided with National Breastfeeding Awareness Month and Frida’s launch of its 2-in-1 Manual Breast Pump, aiming to initiate conversations about early motherhood.


North America Ice Cream Market Report Scope
Ice cream is a soft frozen food made with sweetened and flavored dairy products like milk fat and non-dairy like almond milk, etc. The North America ice cream market is segmented by type, category, packaging, and distribution channel. By type, the market is segmented into artisanal ice cream, impulse ice cream, and take-home ice cream. By category, the market is segmented into dairy and non-dairy. By flavor, the market is segmented by vanilla-based flavors, chocolate-based flavors, and more. By packaging, the market is segmented by cups / single-serve, containers, and more. By distribution channel, the market is segmented into HORECA and retail. By geography, the market is segmented into the United States, Canada, and more. the market forecasts are provided in terms of value (USD).
Type
| Artisanal Ice Cream |
| Impulse Ice Cream |
| Take-Home Ice Cream |
Category
| Dairy |
| Non-Dairy |
Flavor
| Vanilla-Based Flavors |
| Chocolate-Based Flavors |
| Fruit Flavors |
| Nut Flavors |
| Others |
Packaging
| Cups/Single-Serve Containers |
| Tubs/Family Packs |
| Cones |
| Bars/Sticks |
| Others |
Distribution Channel
| Horeca | |
| Retail | Supermarkets/Hypermarkets |
| Specialty Stores | |
| Convenience Stores | |
| Online Retailers | |
| Other Distribution Channel |
By Geography
| United States |
| Canada |
| Mexico |
| Rest of North America |
| Type | Artisanal Ice Cream | |
| Impulse Ice Cream | ||
| Take-Home Ice Cream | ||
| Category | Dairy | |
| Non-Dairy | ||
| Flavor | Vanilla-Based Flavors | |
| Chocolate-Based Flavors | ||
| Fruit Flavors | ||
| Nut Flavors | ||
| Others | ||
| Packaging | Cups/Single-Serve Containers | |
| Tubs/Family Packs | ||
| Cones | ||
| Bars/Sticks | ||
| Others | ||
| Distribution Channel | Horeca | |
| Retail | Supermarkets/Hypermarkets | |
| Specialty Stores | ||
| Convenience Stores | ||
| Online Retailers | ||
| Other Distribution Channel | ||
| By Geography | United States | |
| Canada | ||
| Mexico | ||
| Rest of North America | ||


Market Definition
- Butter - Butter is a yellow-to-white solid emulsion of fat globules, water, and inorganic salts produced by churning the cream from cows’ milk
- Dairy - Dairy product include milk and any of the foods made from milk, including butter, cheese, ice cream, yogurt, and condensed and dried milk.
- Frozen Desserts - Frozen dairy dessert means and includes products containing milk or cream and other ingredients which are frozen or semi-frozen prior to consumption, such as ice milk or sherbet, including frozen dairy desserts for special dietary purposes, and sorbet
- Sour Milk Drinks - Sour milk is thick, curdled milk, with a sour taste, obtained from the fermentation of milk. Sour milk drinks such as kefir, laban, buttermilk have been considered in the study
| Keyword | Definition |
|---|---|
| Cultured Butter | Cultured butter is prepared by having the raw butter go through chemical processing and has been added with certain emulsifiers and foreign ingredients. |
| Uncultured Butter | This type of butter is one which has not been processed in any way |
| Natural Cheese | The type of cheese in its most natural form. It is made from natural and simple products and ingredients, including fresh and natural salts, natural colors, enzymes, and high-quality milk. |
| Processed Cheese | Processed cheese undergoes the same processes as natural cheese; however, it requires more steps and many different forms of ingredients. Making processed cheese involves melting natural cheese, emulsifying it, and adding preservatives and other artificial ingredients or colorings. |
| Single Cream | Single cream contains around 18% fat. It’s a single layer of cream that appears over boiled milk. |
| Double Cream | Double cream contains 48% fat, more than double the amount of fat of single cream. It’s heavier and thicker than single cream |
| Whipping Cream | This has a much higher fat percentage than single cream (36%). Used to top cakes, pies, and puddings and as a thickener for sauces, soups, and fillings. |
| Frozen Desserts | Desserts that are meant to be eaten in frozen condition. E.g., sherbets, sorbets, frozen yogurts |
| UHT Milk (Ultra-high temperature milk) | Milk heated at a very high temperature. Ultra-high-temperature processing (UHT) of milk involves heating for 1–8 sec at 135–154°C. which kills the spore-forming pathogenic microorganism, resulting in a product with a shelf-life of several months. |
| Non-dairy butter/Plant-based butter | Butter made from plant-derived oil such as coconut, palm, etc. |
| Non-dairy Yogurt | Yogurt made from typically made from nuts, like almonds, cashews, coconuts, and even other foods like soybeans, plantains, oats, and peas |
| On-trade | It refers to restaurants, QSRs, and bars. |
| Off-trade | It refers to supermarkets, hypermarkets, on-line channels, etc. |
| Neufchatel cheese | One of the oldest kinds of cheese in France. It is a soft, slightly crumbly, mold-ripened, bloomy-rind cheese made in the Neufchâtel-en-Bray region of Normandy. |
| Flexitarian | It refers to a consumer preferring a semi-vegetarian diet, that is centered on plant foods with limited or occasional inclusion of meat. |
| Lactose Intolerance | Lactose intolerance is a reaction in digestive system to lactose, the sugar in milk. It causes uncomfortable symptoms in response to the consumption of dairy products. |
| Cream Cheese | Cream cheese is a soft and creamy fresh cheese with a tangy taste made from milk and cream. |
| Sorbets | Sorbet is a frozen dessert made using ice combined with fruit juice, fruit purée, or other ingredients, such as wine, liqueur, or honey. |
| Sherbet | Sherbet is a sweetened frozen dessert made with fruit and some sort of dairy product such as milk or cream. |
| Shelf stable | Foods that can be safely stored at room temperature, or "on the shelf," for at least one year and do not have to be cooked or refrigerated to eat safely. |
| DSD | Direct Store Delivery is the process in supply chain management wherein the product is delivered from manufacturing plant directly to the retailer. |
| OU Kosher | Orthodox Union Kosher is a kosher certification agency based in New York City. |
| Gelato | Gelato is a frozen creamy dessert made with milk, heavy cream and sugar. |
| Grass-fed Cows | Grass-fed cows are allowed to graze in pastures, where they eat a variety of grasses and clover. |


Research Methodology
Mordor Intelligence follows a four-step methodology in all our reports.
- Step-1: Identify Key Variables: In order to build a robust forecasting methodology, the variables and factors identified in Step 1 are tested against available historical market numbers. Through an iterative process, the variables required for market forecast are set, and the model is built on the basis of these variables.
- Step-2: Build a Market Model: Market-size estimations for the forecast years are in nominal terms. Inflation is not a part of the pricing, and the average selling price (ASP) is kept constant throughout the forecast period for each country.
- Step-3: Validate and Finalize: In this important step, all market numbers, variables, and analyst calls are validated through an extensive network of primary research experts from the market studied. The respondents are selected across levels and functions to generate a holistic picture of the market studied.
- Step-4: Research Outputs: Syndicated Reports, Custom Consulting Assignments, Databases & Subscription Platforms


