Market Overview
| Study Period | 2020 - 2031 |
|---|---|
| Forecast Data Period | 2026 - 2031 |
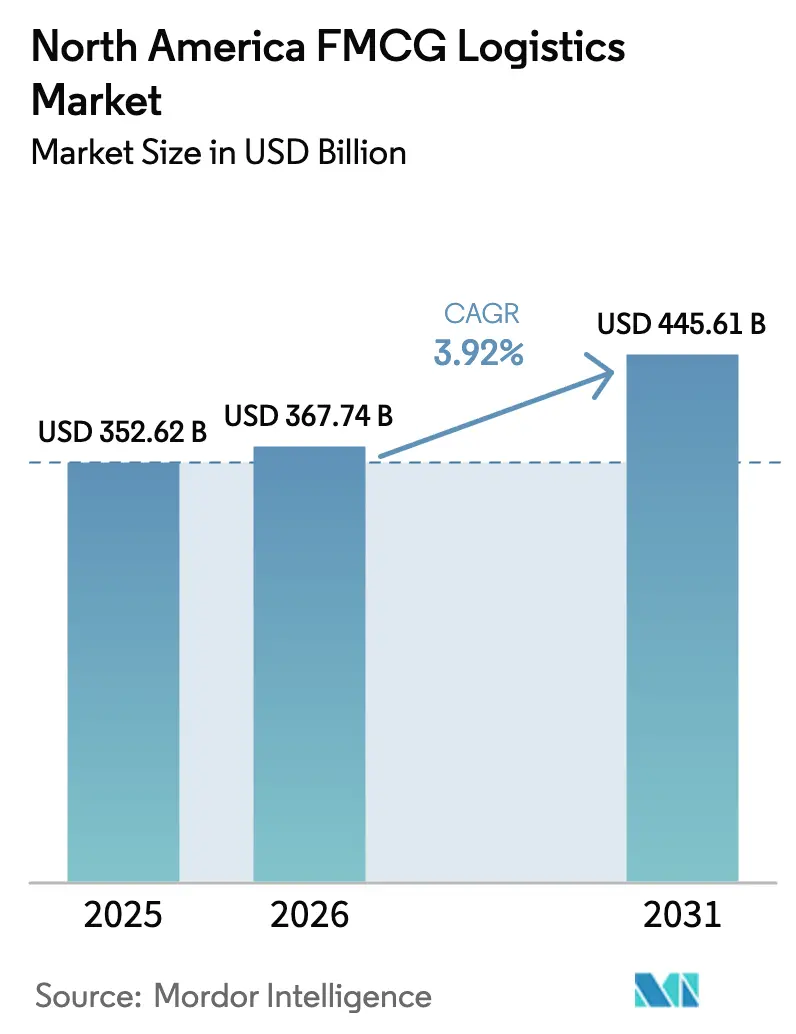
| Base Year Market Size (2025) | USD 352.62 Billion |
| Market Size (2026) | USD 367.74 Billion |
| Market Size (2031) | USD 445.61 Billion |
| Growth Rate (2026 - 2031) | 3.92% CAGR |
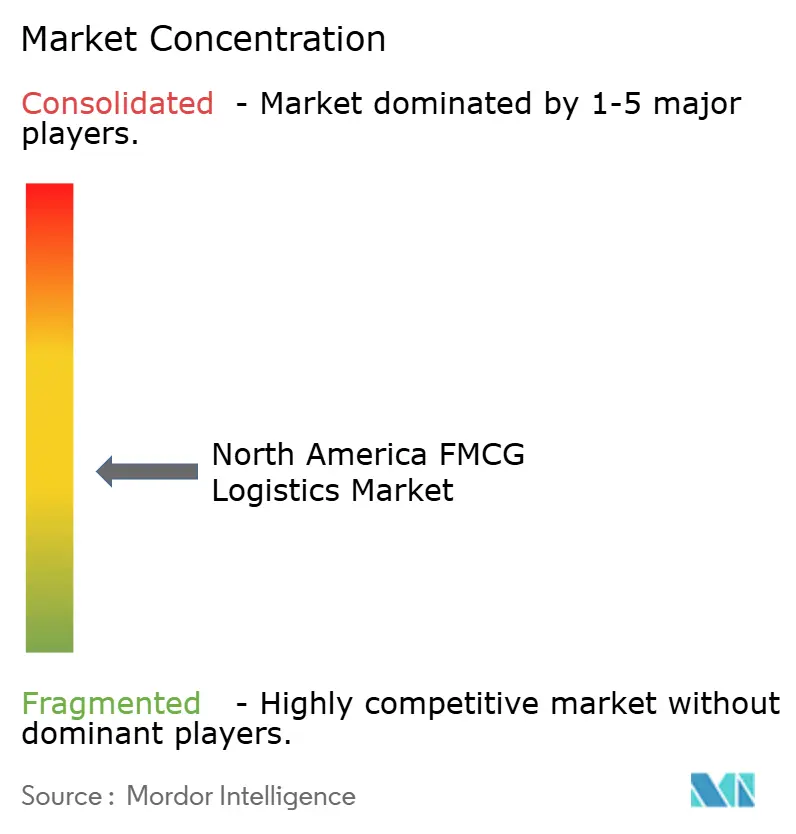
| Market Concentration | Medium |
Major Players *Disclaimer: Major Players sorted in no particular order Image © Mordor Intelligence. Reuse requires attribution under CC BY 4.0. | |
North America FMCG Logistics Market Analysis by Mordor Intelligence
The North America FMCG Logistics Market size is expected to grow from USD 352.62 billion in 2025 to USD 367.74 billion in 2026 and is forecast to reach USD 445.61 billion by 2031 at 3.92% CAGR over 2026-2031.
Robust retail consumption, e-commerce acceleration, and infrastructure upgrades sustain steady growth while widening service opportunities for temperature-controlled and value-added offerings. Transportation keeps scale leadership but faces margin pressure as digital platforms reduce rate opacity and push real-time visibility into mainstream contracts. Automation investments mitigate labor scarcity and tighten order-cycle times, and clean-fleet mandates spur early adoption of electric refrigerated vans despite high capital outlays. Nearshoring into Mexico realigns cross-border flows, prompting carriers to balance north-south capacity with dense United States urban routes.
Key Report Takeaways
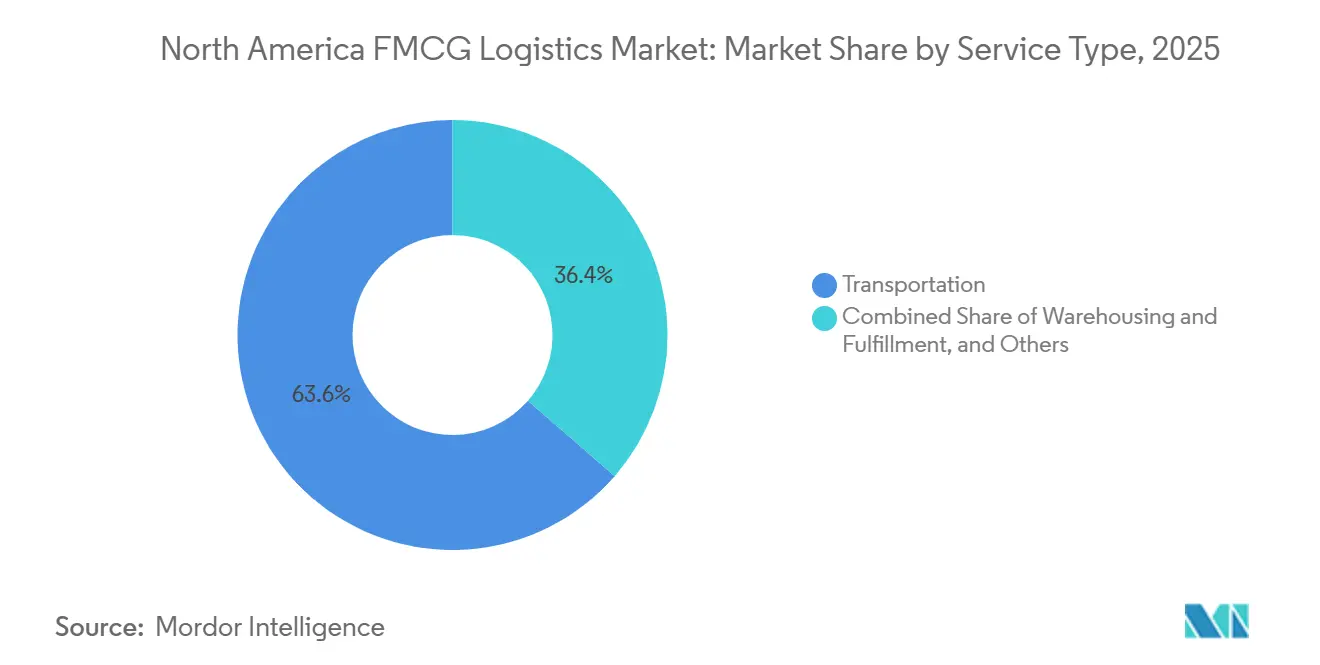
- By service type, transportation captured 62.96% of the North America FMCG Logistics market share in 2025, while Value-added Services is forecast to post the fastest 4.87% CAGR between 2026-2031.
- By temperature control type, non-temperature-controlled operations held a 92.12% share in 2025, and temperature-controlled logistics are projected to grow at a 5.40% CAGR between 2026-2031.
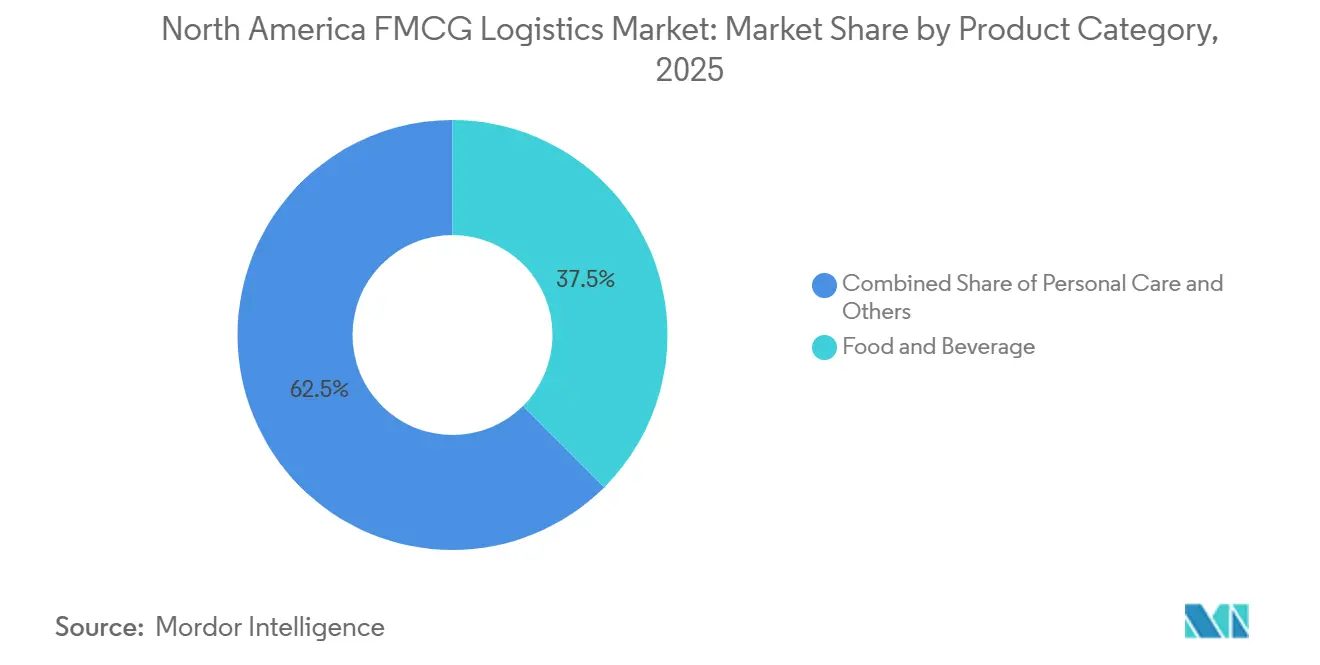
- By product category, food and beverage accounted for 37.54% of the North America FMCG Logistics market size in 2025, whereas OTC and Healthcare are expected to register the highest 5.15% CAGR between 2026-2031.
- By distribution channel, offline channels led with a 65.83% share in 2025, and Online channels are anticipated to expand at a 5.28% CAGR between 2026-2031.
- By country, the United States controlled 87.18% regional revenue in 2025, and Mexico is forecast to advance at a 4.95% CAGR between 2026-2031.
Note: Market size and forecast figures in this report are generated using Mordor Intelligence’s proprietary estimation framework, updated with the latest available data and insights as of January 2026.
North America FMCG Logistics Market Trends and Insights
Drivers Impact Analysis*
| Driver | (~) % Impact on CAGR Forecast | Geographic Relevance | Impact Timeline |
|---|---|---|---|
| Surging e-commerce and omnichannel fulfillment demand | +1.2% | United States, Canada metro clusters, Mexico City corridor | Short term (≤ 2 years) |
| Expansion of refrigerated and frozen food consumption | +0.9% | United States, Canada, northern Mexico urban zones | Medium term (2-4 years) |
| Warehouse automation and robotics adoption | +0.7% | United States, Canada, select Mexico manufacturing hubs | Medium term (2-4 years) |
| State-level incentives for electric refrigerated vans | +0.4% | California, New York, British Columbia, Ontario | Long term (≥ 4 years) |
| AI-driven weekly POS analytics improving replenishment | +0.5% | United States, Canada retail networks | Short term (≤ 2 years) |
| Consolidation of cold-storage REITs unlocking capacity | +0.6% | United States, Canada | Medium term (2-4 years) |
| Source: Mordor Intelligence | |||
Surging E-Commerce and Omnichannel Fulfillment Demand
United States online grocery sales reached USD 47.2 billion in 2024, rising 12.9% from 2023[1]“Quarterly E-commerce Report,” United States Census Bureau, census.gov . Inventory now sits in regional distribution centers, micro-fulfillment sites, and store backrooms, forcing logistics firms to orchestrate split shipments that bypass legacy hub-and-spoke models. Walmart installed automated micro-fulfillment nodes in 2024, showing how retailers internalize last-mile complexity and push 3PLs toward equivalent automation. Dark stores compress delivery radii below 15 miles, doubling refrigerated van cycles during peak windows and tightening urban cold-chain capacity. Providers respond by layering real-time routing with temperature telemetry to protect mixed ambient and chilled orders. Rapid-delivery apps intensify frequency volatility, so carriers deploy dynamic labor scheduling to maintain service levels without excess overtime.
Expansion of Refrigerated and Frozen Food Consumption
Per-capita frozen food intake in the United States climbed to 58.3 pounds in 2024 from 56.1 pounds a year earlier. Developers added 85 million ft³ of cold storage in 2024, yet occupancy stayed above 90% in Southern California and Dallas-Fort Worth. Lineage Logistics raised USD 4.4 billion in July 2024 to expand temperature-controlled capacity, signaling sustained investor confidence. Demand for -80 °C cell-therapy logistics accelerates upgrades to ultra-low freezer rooms and liquid-nitrogen backups. Food-service brands extend frozen menu ranges that require strict blast-freezing and cross-dock integrity, enabling premium-priced time-definite services. Persistent supply-demand gaps let warehouses negotiate multi-year contracts with inflation-indexed energy pass-through clauses[2]“Mexico: Mexican Food Retail Market,” U.S. Department of Agriculture, fas.usda.gov.
Warehouse Automation and Robotics Adoption
GXO deployed more than 1,000 autonomous mobile robots across North America in 2024, trimming pick labor hours by 30% and creating 24-hour operating windows for grocery DCs. AutoStore grids maximize cubic utilization, letting operators triple stock within existing footprints while avoiding greenfield leases. AI slotting engines reposition high-velocity SKUs near pack stations, shaving seconds per order and compounding throughput across millions of picks. Capital outlays of USD 5-20 million per site favor well-capitalized 3PLs that bundle financing into multi-year contracts, while regional players stay semi-manual and risk SLA penalties during demand spikes. Robotics further lowers injury rates, reducing compensation costs and improving labor retention.
State-Level Incentives for Electric Refrigerated Vans
California’s voucher program committed USD 398 million in 2024 to subsidize electric Class 4-8 trucks, cutting the price premium over diesel units to below 15%. Transport Canada offered CAD 2.75 billion (USD 2 billion) in grants for fleets electrifying at least 25% of refrigerated units by 2027. Current battery platforms support 150-mile urban ranges while sustaining 2 °C to 8 °C cargo settings, so adoption concentrates in city routes where regenerative braking extends range. Total cost parity is expected by 2028 in markets with electricity rates under USD 0.12/kWh, yet rural nodes still face charging-infrastructure gaps that delay broader deployment. Early adopters use zero-emission fleets to meet retailer Scope 3 targets and win differentiated contracts.
Restraints Impact Analysis*
| Restraint | (~) % Impact on CAGR Forecast | Geographic Relevance | Impact Timeline |
|---|---|---|---|
| Driver shortages and rising freight costs | -0.8% | United States, Canada | Short term (≤ 2 years) |
| Cold-storage capacity bottlenecks and energy prices | -0.6% | United States metro zones, Canada urban centers | Medium term (2-4 years) |
| Tariff policy uncertainty delaying IT modernization | -0.3% | United States-Mexico border corridors, Canada-United States cross-border routes | Short term (≤ 2 years) |
| Legacy data silos hindering cross-border visibility | -0.4% | United States-Mexico, United States-Canada trade lanes | Medium term (2-4 years) |
| Source: Mordor Intelligence | |||
Driver Shortages and Rising Freight Costs
The American Trucking Associations counted a 78,000-driver gap in 2024, with turnover at mainstream truckload carriers topping 90%. Refrigerated spot rates averaged USD 2.85/mile in Q1 2025, up 8% year on year. Long-haul reefer assignments face applicant scarcity because multi-day routes limit home time, so carriers pivot to regional runs, reducing long-distance cold-chain capacity. Contract rate hikes of 6-7% in 2024 pinched grocery wholesalers tied to fixed-price retail contracts. Shippers respond by shifting qualifying loads to intermodal rail despite longer transit times[3]“ATA Driver Shortage Update 2024,” American Trucking Associations, trucking.org.
Cold-Storage Capacity Bottlenecks and Energy Prices
Occupancy exceeded 90% in Southern California, Dallas-Fort Worth, and Savannah during 2024. Natural-gas prices averaged USD 2.95 per MMBtu in 2024 versus USD 2.53 in 2023, raising utility expenses 12% for ammonia-based systems. Industrial electricity in California hit USD 0.18/kWh, prompting solar plus battery retrofits to cap exposure. Zoning reviews stretch permit cycles to 18-24 months, delaying relief and sustaining high pallet rates. Operators unable to pass surcharges absorb margin hits that deter further expansion[4]“Natural Gas Prices,” U.S. Energy Information Administration, eia.gov.
*Our forecasts treat driver/restraint impacts as directional, not additive. The impact forecasts reflect baseline growth, mix effects, and variable interactions.
Segment Analysis
By Service: Value-Added Services Reshape Margin Pools
Value-added Services will grow at a 4.87% CAGR from 2026-2031, overtaking baseline line-haul growth as brands outsource kitting, labeling, and reverse logistics to shorten promotion lead times. Transportation retained 62.96% of the North America FMCG Logistics market share in 2025, but commoditization lowers per-mile margins and pivots differentiation toward API tracking, predictive exception alerts, and sustainability scorecards. Road transport anchors last-mile and regional loops for perishables that need tight delivery windows, while rail intermodal secures cost-effective lanes beyond 1,500 miles. Air freight remains a niche for high-value pharmaceuticals, and sea links handle frozen imports from Mexico and Canada.
Warehousing teams install mezzanines, vertical lift modules, and pick-to-light lanes inside urban micro-fulfillment centers, elevating throughput without expanding footprints. C.H. Robinson’s Navisphere platform blends multimodal data, automated audit, and carrier scoring to recast transport management as a strategic advisory engagement. Shared-user fulfillment centers lower client capex while smoothing seasonal peaks across diverse SKU sets. Providers package reverse-logistics workflows with refurbish or disposal options, monetizing e-commerce returns and meeting circular-economy directives. The North America FMCG Logistics market continues to favor asset-light orchestrators that leverage digital twins to optimize carrier selection in real time.


By Temperature Control: Chilled and Frozen Segments Diverge
Non-Temperature Controlled freight owned 92.12% of the 2025 value yet faces muted expansion as shelf-stable goods mature. Temperature-controlled logistics is projected to advance at a 5.40% CAGR (2026-2031), lifted by frozen-meal subscriptions, fresh meal kits, and stringent pharma mandates. Chilled chains hold 0 °C-5 °C for dairy, meat, and ready-to-eat lines, demanding end-to-end traceability and strict dwell-time limits at cross-docks. Frozen pathways, kept at −18 °C, require blast-freeze capacity and automated pallet shuttles that minimize door-open exposure.
Ultra-low modules below −20 °C scale quickly for cell and gene therapy payloads, although absolute volumes remain small. U.S. FDA regulations on temperature recording elevate compliance costs, nudging smaller owners toward telematics leases or divestment. Ambient sub-segments within Temperature Controlled handle sensitive confectionery and wine, using remote probes to watch for summer spikes. Energy-efficient compressors and variable-speed drives lower kilowatt draw, protecting operator margins amid electricity volatility. Providers targeting premium pharma lanes lock in longer contracts that shelter utilization during seasonal retail lulls.
By Product Category: OTC and Healthcare Outpace Food
Food and Beverage contributed 37.54% of the North America FMCG Logistics market size in 2025, anchored by broad grocery distribution and food-service flows. Growth moderates as retail networks saturate, while OTC and Healthcare are forecast to post a 5.15% CAGR between 2026-2031, leveraging GDP-compliant storage and serialized track-and-trace. Personal Care brands exploit e-commerce and direct-to-consumer models that favor parcel fulfillment centers with temperature-monitored zones for cosmetics. Household Care’s bulky yet low-value profile pushes 3PLs to optimize trailer cube and align return legs.
Cross-category baskets emerge as micro-fulfillment hubs that co-locate fresh, beauty, and vitamin SKUs, raising complexity for inventory zoning. OTC lines secure premium pricing due to validation paperwork, chain-of-custody audits, and cold-chain redundancies. Food distributors compress fees by negotiating multi-year lane commitments tied to private-label volume ramps at major grocers. Logistics partners add lot-level scanning and on-pack labeling to meet traceability rules, embedding service revenue atop basic storage fees.
By Distribution Channel: Online Penetration Accelerates
Offline channels commanded 65.83% share in 2025, yet Online is set to rise at a 5.28% CAGR between 2026-2031 as subscription boxes, direct-brand storefronts, and quick commerce reshape demand. Parcel-level picks multiply labor touchpoints and shrink average order weight, pressuring per-unit margins unless offset by automation. Walmart’s online grocery pickup roll-out across 4,000 U.S. stores in 2024 shows how retailers merge digital front ends with legacy real estate.
Quick-commerce apps promise 15-minute delivery within 2-mile zones, forcing 3PLs to open spoke sites in dense urban grids and maintain split ambient and chilled inventory within 100 SKU assortments. Direct-to-consumer brands bypass wholesalers, shipping from single-client nodes, yet as volumes scale, they migrate to shared 3PL hubs to capture freight discounts. Offline supermarkets enhance experiential merchandising to preserve foot traffic, blending prepared foods, tastings, and health clinics to retain share. Logistics planners re-balance route frequency, adding micro-drop windows to meet curbside pickup slots while curbing empty miles.
Geography Analysis
The United States led with 87.18% of the North America FMCG Logistics market share in 2025, underpinned by 3.6 billion ft³ of refrigerated warehouse capacity and dense multimodal corridors serving coast-to-coast retail networks. Grocery e-commerce penetration rose to 15.8% of total sales in 2024, prompting carriers to scatter inventory across micro-fulfillment nodes, suburban DCs, and rural cross-docks. California directed USD 398 million in vouchers during 2024 toward electric refrigerated trucks, accelerating zero-emission last-mile adoption in Los Angeles and San Francisco metros. The Port of Los Angeles handled 9.2 million TEU in 2024, with reefers at 8% of throughput, stressing inland cold storage during import peaks.
Canada benefits from population clustering in Toronto-Montreal-Vancouver, where cold-storage occupancy exceeded 88% in 2024, but long-distance hauls to prairies and maritime provinces elevate cost per pallet. Transport Canada’s CAD 2.75 billion (USD 1.91 billion) program subsidizes medium- and heavy-duty electric fleets, propelling early adoption of zero-emission cold-chain vans. Bilateral trade with the United States reached CAD 763 billion (USD 560 billion) in 2024, with FMCG goods near 18% of value. Harmonized food-safety rules reduce inspection holds, yet winter weather disruptions still divert freight to trans-border rail when highways close.
Mexico is projected to record a 4.95% CAGR between 2026-2031 as nearshoring pivots consumer-goods assembly to Monterrey, Querétaro, and Guadalajara corridors. Foreign direct investment hit USD 36.1 billion in 2024, with consumer companies gaining 22% of inflows. Border dwell times at Laredo and El Paso averaged 2.4 hours in 2024, down from 3.1 hours in 2023, cutting spoilage risk for perishables. Cold-storage space totals 180 million ft³, heavily concentrated in Mexico City metro; secondary cities rely on insulated trailers and ice packs, raising quality-control challenges. Fragmented trucking markets dominated by small owner-operators constrain telematics adoption, but USMCA-driven rule harmonization encourages fleet modernization with GPS and temperature probes.
Competitive Landscape
Moderate fragmentation defines the North America FMCG Logistics market, with asset-heavy cold-storage giants Lineage Logistics and Americold anchoring national footprints while mid-tier 3PLs carve regional niches around specialty products. Private-equity platforms closed multiple acquisitions in 2024-2025 to forge coast-to-coast networks, pressuring standalone operators to consider scale partnerships. Lineage’s USD 4.4 billion IPO in July 2024 funds automation retrofits and new facilities in underserved Pacific Northwest and Southeast catchments.
GXO installed 1,000+ robots to slash pick times, underscoring technology as a key battleground. Digital freight brokers apply machine learning for dry-van lanes yet struggle to verify refrigerated compliance, leaving room for incumbents offering validated cold-chain protocols. White-space plays emerge in ultra-low-temperature logistics for cell therapies and 15-minute grocery fulfillment around dense downtown cores. Carriers differentiate via energy-efficient refrigeration, renewable-powered warehouses, and ESG reporting that meets retailer Scope 3 audits.
Hours-of-service and ELD mandates standardize driver compliance across borders, so service quality and exception resolution become primary competitive levers. Schneider National replaces smaller regional player Brimich Logistics as a more relevant refrigerated carrier with nationwide coverage and dedicated contract-carriage. Market participants invest in data lakes that merge WMS, TMS, and POS feeds, enabling AI analytics that flag delays before they cascade into stockouts. Providers unable to fund digital overhauls face margin erosion and acquisition risk.
North America FMCG Logistics Industry Leaders
C.H. Robinson
Americold
DHL Group
XPO, Inc.
Kuehne+Nagel
- *Disclaimer: Major Players sorted in no particular order

Recent Industry Developments
- December 2024: Kuehne + Nagel bought a Brampton, Ontario, temperature-controlled facility for CAD 65 million (USD 48 million) to boost cross-border capabilities.
- May 2024: Americold acquired a 500,000 ft² Savannah cold-storage site for USD 85 million to capture rising import volumes from Latin America and Asia.
- April 2024: C.H. Robinson upgraded its Navisphere platform with machine-learning exception management and automated carrier selection.
- February 2024: DHL Supply Chain earmarked USD 200 million to retrofit 15 warehouses with vertical lift modules and AI inventory software.


North America FMCG Logistics Market Report Scope
FMCG logistics management is concerned with the efficiency and effectiveness with which daily activities involving the transportation of daily usable goods from one location to another are managed. It is the management of the flow of goods from one point of origin to another to meet the needs of customers. A comprehensive analysis of the North American FMCG Logistics Market includes an examination of the economy and market overview, estimation of market size for key segments, and emerging trends in market segments. The report sheds light on market trends like growth factors, restraints, and opportunities in this sector. The competitive landscape of the North American FMCG logistics market is depicted through the profiles of active key players. The report also covers the impact of COVID-19 on the market and future projections.
The North American FMCG Logistics Market is segmented by service (transportation, warehousing, distribution, inventory management, and other value-added services), product category (food and beverage, personal care, household care, and other consumables),, and geography (United States, Canada, and Mexico). The report offers market size and forecasts in dollars (USD) for all the above segments.
By Service (Value)
| Transportation | Road |
| Rail | |
| Air | |
| Sea | |
| Warehousing and Distribution | |
| Value-added Services |
By Temperature Control (Value)
| Temperature Controlled | Chilled (0-5 °C) |
| Frozen (-18-0 °C) | |
| Ambient | |
| Deep-Frozen / Ultra-Low (less than-20 °C) | |
| Non-Temperature Controlled |
By Product Category (Value)
| Food and Beverage |
| Personal Care |
| Household Care |
| OTC and Healthcare |
| Others |
By Distribution Channel (Value)
| Online |
| Offline |
By Country (Value)
| United States |
| Canada |
| Mexico |
| By Service (Value) | Transportation | Road |
| Rail | ||
| Air | ||
| Sea | ||
| Warehousing and Distribution | ||
| Value-added Services | ||
| By Temperature Control (Value) | Temperature Controlled | Chilled (0-5 °C) |
| Frozen (-18-0 °C) | ||
| Ambient | ||
| Deep-Frozen / Ultra-Low (less than-20 °C) | ||
| Non-Temperature Controlled | ||
| By Product Category (Value) | Food and Beverage | |
| Personal Care | ||
| Household Care | ||
| OTC and Healthcare | ||
| Others | ||
| By Distribution Channel (Value) | Online | |
| Offline | ||
| By Country (Value) | United States | |
| Canada | ||
| Mexico | ||


Key Questions Answered in the Report
How large is the North America FMCG Logistics market in 2026?
How large is the North America FMCG Logistics market in 2026?
Which service segment grows fastest through 2031?
Which service segment grows fastest through 2031?
What share does the United States hold in regional FMCG logistics?
What share does the United States hold in regional FMCG logistics?
Why is temperature-controlled capacity expanding?
Why is temperature-controlled capacity expanding?
How will electric refrigerated vans impact operations?
How will electric refrigerated vans impact operations?
Which country is expected to grow quickest?
Which country is expected to grow quickest?
Page last updated on:


