Market Overview
| Study Period | 2018 - 2031 |
|---|---|
| Forecast Data Period | 2026 - 2031 |
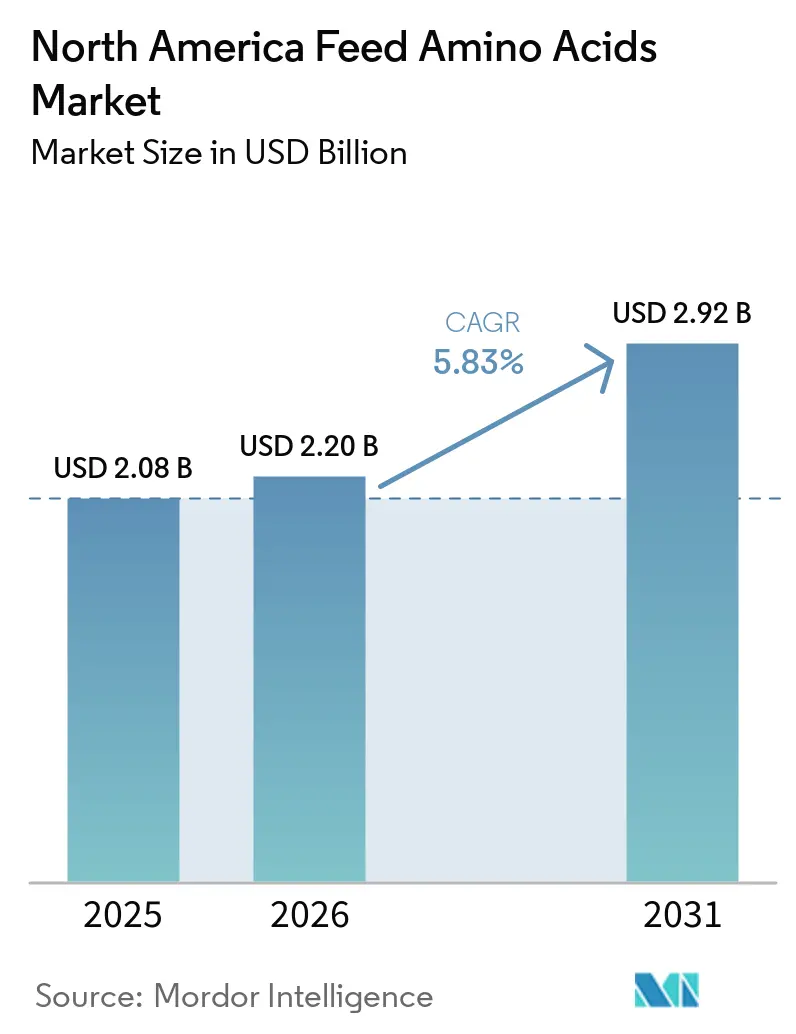
| Base Year Market Size (2025) | USD 2.08 Billion |
| Market Size (2026) | USD 2.20 Billion |
| Market Size (2031) | USD 2.92 Billion |
| Growth Rate (2026 - 2031) | 5.83% CAGR |
| Market Concentration | Medium |
Major Players*Disclaimer: Major Players sorted in no particular order Image © Mordor Intelligence. Reuse requires attribution under CC BY 4.0. | |
North America Feed Amino Acids Market Analysis by Mordor Intelligence
The North America Feed Amino Acids Market size is projected to expand from USD 2.08 billion in 2025 and USD 2.20 billion in 2026 to USD 2.92 billion by 2031, registering a CAGR of 5.83% between 2026 and 2031. Robust adoption of precision nutrition strategies, deeper penetration of amino-acid–balanced diets in industrial poultry complexes, and rapid scale-up of fermentation technologies that lower unit costs are steering current expansion. Producers are lowering crude protein inclusion levels in favor of crystalline amino acids, which improves feed conversion ratios and trims nitrogen emissions, an outcome that aligns with retailer-driven sustainability scorecards. Competitive intensity is rising as integrated manufacturers invest in backward integration and precision fermentation capabilities, while biotechnology newcomers test cost-advantaged production platforms. Although volatile grain prices and trade frictions generate short-term margin pressure, sustained capital inflows and tightening environmental compliance rules continue to open new opportunities for the feed amino acids market in North America.
Key Report Takeaways
- By sub-additive, lysine led with 42.15% of the North America feed amino acids market share in 2025, whereas methionine is anticipated to expand at a 6.05% CAGR between 2026 and 2031.
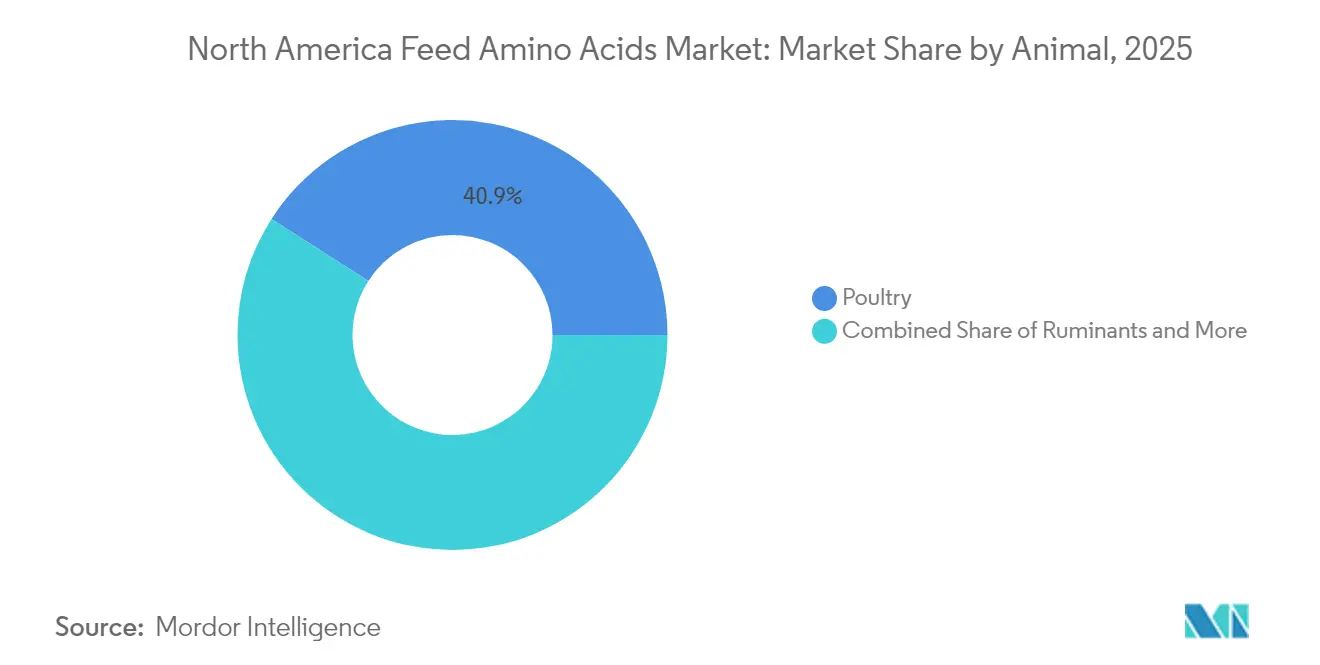
- By animal, poultry accounted for a 40.92% share of the North America feed amino acids market size in 2025, and ruminants are poised to grow at a 5.92% CAGR between 2026 and 2031.
- By geography, the United States accounted for 70.12% of the North American feed amino acids market revenue in 2025 and is forecast to advance at a 6.01% CAGR between 2026 and 2031.
Note: Market size and forecast figures in this report are generated using Mordor Intelligence’s proprietary estimation framework, updated with the latest available data and insights as of 2026.
North America Feed Amino Acids Market Trends and Insights
Drivers Impact Analysis*
| Driver | (~) % Impact on CAGR Forecast | Geographic Relevance | Impact Timeline |
|---|---|---|---|
| Growing demand for high-efficiency protein conversion in poultry and swine production | +1.20% | United States, Mexico, Canada | Medium term (2-4 years) |
| Expansion of industrial-scale poultry farming operations in Mexico and the United States | +1.00% | United States, Mexico | Long term (≥ 4 years) |
| Feed-cost pressures driving optimized amino-acid supplementation strategies | +0.90% | North America | Short term (≤ 2 years) |
| Rise of precision-fermentation-derived feed-grade amino acids lowering price barriers | +0.80% | United States, Canada | Medium term (2-4 years) |
| Carbon-footprint labeling programs incentivizing amino-acid balanced diets | +0.60% | United States, Canada | Long term (≥ 4 years) |
| Increasing adoption of amino-acid enriched insect meal in aquaculture diets | +0.40% | North America | Long term (≥ 4 years) |
| Source: Mordor Intelligence | |||


Growing demand for high-efficiency protein conversion in poultry and swine production
Livestock producers are prioritizing feed conversion efficiency to counter elevated feed costs. Broiler integrators routinely achieve feed conversion ratios below 1.5:1 after supplementing methionine and lysine, compared with 1.8:1 in conventional programs, reducing feed expense by USD 0.15 for each kilogram of live weight. Swine finisher diets fortified with threonine cut crude protein from 16% to 14% while sustaining gain rates. Improved amino acid balance trims nitrogen excretion by up to 25%, meeting nutrient management rules in several states[1]Source: Journal of Applied Poultry Research, “Amino Acid Requirements in Poultry Nutrition,” sciencedirect.com. These economics solidify demand for the North America feed amino acids market while supporting compliance goals.
Expansion of industrial-scale poultry farming operations in Mexico and the United States
Modernization projects across Mexico and the United States are embedding automated dosing systems that guarantee precise amino acid inclusion. Mexico produced a modest amount of poultry meat in 2024, underpinned by USD 500 million in feed-mill upgrades that standardize nutrient profiles across thousands of houses. United States broiler production is similarly consolidated, with the top ten firms producing the maximum share of national output. Their multi-year procurement contracts create steady off-take, reinforcing economies of scale for amino acid suppliers.
Feed-cost pressures driving optimized amino-acid supplementation strategies
Corn traded between USD 4.20 and USD 6.80 per bushel through 2024, and soybean meal ranged from USD 320 to USD 480 per metric ton, raising feed’s share of production costs to nearly 70%[2]Source: CME Group, “Agricultural Futures and Options,” cmegroup.com. Nutritionists respond by formulating to digestible amino acid requirements rather than crude protein, substituting crystalline amino acids and lower-cost energy sources for soybean meal. Layers, for example, hold egg mass while dropping soybean meal from 25% to 18% after methionine inclusion.
Carbon-footprint labeling programs incentivizing amino-acid balanced diets
Retailer programs like Project Gigaton pay premiums of USD 0.05–0.10 per pound for meats that demonstrate lower emissions. Amino acid optimization reduces crude protein and cuts ammonia emissions 20% to 30%, delivering 8% to 12% greenhouse gas savings per kilogram of meat. These verified reductions help processors secure shelf space and pricing advantages.
Restraints Impact Analysis*
| Restraint | (~) % Impact on CAGR Forecast | Geographic Relevance | Impact Timeline |
|---|---|---|---|
| Volatility in corn and soybean prices affecting amino-acid production economics | −0.8% | North America | Short term (≤ 2 years) |
| Import tariffs and trade uncertainties disrupting supply chains | −0.6% | United States, Mexico, Canada | Medium term (2-4 years) |
| Excess Chinese lysine capacity triggering dumping concerns in North America | −0.5% | United States, Canada | Short term (≤ 2 years) |
| Consumer pushback against chemically synthesized additives in organic meat supply chains | −0.3% | United States, Canada | Long term (≥ 4 years) |
| Source: Mordor Intelligence | |||
Volatility in corn and soybean prices affecting amino-acid production economics
Surging corn prices lifted lysine production costs 25% in 2024, prompting quarterly contract resets and shrinking gross margins. Methionine costs fluctuate with natural gas swings, moving USD 200–400 per metric ton quarter to quarter. Such uncertainty limits forward contracting and raises working capital needs across the North America feed amino acids market. The market participants must adapt to these dynamic conditions while maintaining operational efficiency and financial stability.
Import tariffs and trade uncertainties disrupting supply chains
United States anti-dumping duties of up to 154.9% on Chinese lysine elevate domestic prices 20% to 35% above global averages[3]Source: U.S. International Trade Commission, “Anti-dumping and Countervailing Duty Orders,” usitc.gov. Port congestion adds six to eight weeks to delivery schedules, challenging Mexican mills that rely on imports. Currency volatility further complicates landed cost forecasts. The market participants must carefully navigate these challenges while maintaining operational efficiency.
*Our forecasts treat driver/restraint impacts as directional, not additive. The impact forecasts reflect baseline growth, mix effects, and variable interactions.
Segment Analysis
By Sub Additive: Lysine Leads while Methionine Accelerates
Lysine held 42.15% of the North America feed amino acids market share in 2025, driven by its status as the first limiting amino acid in corn-soy formulas for poultry and swine. Methionine is progressing at a 6.05% CAGR between 2026 to 2031, buoyed by wider use in broilers and novel rumen-protected forms for dairy cows. Evonik’s backward integration in Mobile, Alabama, trims methionine costs by 15%, advancing supply reliability. Threonine enjoys steady gains in layer diets, whereas tryptophan sees niche uptake for stress mitigation in transport settings.
Rumen-protected delivery breakthroughs underpin methionine’s momentum, enabling dairy operators to elevate milk protein without increasing crude protein. Specialty amino acids such as valine, isoleucine, and histidine account for less than 10% of the North America feed amino acids market size but offer future upside as precision nutrition matures. Suppliers cultivate intellectual property around encapsulation and timed release, commanding premiums over commodity grades.


By Animal: Poultry Dominates and Ruminants Grow Fastest
Poultry absorbed 40.92% of the North America feed amino acids market size in 2025, reflecting standardized supplementation in broiler integrator programs. Broilers alone consume more than half of poultry demand, with layers and turkeys covering the rest. Ruminants are advancing at a 5.92% CAGR between 2026 to 2031, as dairy herds adopt encapsulated methionine and lysine to lift milk protein yields. Swine remain a consistent consumer; phase feeding enhances amino acid ratios throughout growth stages.
Aquaculture represents an emerging pocket of demand. Salmon farmers supplement crystalline amino acids when replacing fishmeal, and shrimp producers use methionine and lysine to bolster immune response. These practices support eco-certifications and diversify the North America feed amino acids market base. The growing adoption of amino acids in aquaculture feed formulations indicates a sustainable shift in feeding practices across the industry.
Geography Analysis
The United States commands 70.12% of regional revenue and is set to expand at a 6.01% CAGR between 2026 to 2031, anchored by the world’s largest poultry complex and a regulatory climate that expedites product approvals. Integrated operators such as Tyson Foods and Perdue Farms maintain uniform amino acid protocols across grow-out sites, guaranteeing predictable off-take for suppliers. Domestic production capacity in Illinois and Alabama bolsters supply security, insulating the North America feed amino acids market from external shocks.
Mexico is among the fastest-growing geographies, propelled by industrializing poultry operations that rely on amino acid-balanced diets to sharpen production economics. Investments since 2024 have upgraded feed mills with precision dosing systems, driving consistent nutrient specifications and supporting millions of metric tons of poultry meat output. Harmonized (United States-Mexico-Canada Agreement) USMCA rules streamline cross-border trade and speed technology transfer.
Canada delivers niche growth anchored in dairy and aquaculture. Dairy farms numbering roughly 950,000 cows are raising methionine and lysine inclusion to optimize protein yield within supply management quotas. Atlantic salmon producers integrate amino acids to curb fishmeal reliance, aligning with sustainability labeling. Science-based approval protocols run by the Canadian Food Inspection Agency foster innovation adoption.
Competitive Landscape
The North American feed amino acids market is moderately concentrated; the top five firms control a modest share of the 2024 market revenue. Leaders pursue vertical integration to manage raw material risk. Evonik completed a methyl mercaptan unit that secures methionine precursors and lifts margins. ADM is adding lysine capacity in Illinois, leveraging precision fermentation to curb energy use by 25%.
Innovation focus is intensifying. Patent filings for targeted release systems rose in 2024. Start-ups using precision fermentation and insect substrates promise cost savings and lower emissions, challenging incumbents on both price and sustainability. FDA’s faster Generally Recognized as Safe pathways lower entry barriers, enabling smaller firms to commercialize novel amino acid forms within 18 months.
Competitive rivalry also plays out through strategic alliances. BASF acquired a share of BioAmino Technologies, securing low-carbon lysine routes. Ajinomoto partnered with Cargill to craft amino acid-enriched insect meal for salmon feed. Novus International gained FDA clearance for a new rumen-protected methionine, opening dairy channels. Such moves underscore a shift toward differentiated solutions that capture value beyond commodity production.
North America Feed Amino Acids Industry Leaders
Evonik Industries AG
IFF(Danisco Animal Nutrition)
Land O'Lakes
SHV (Nutreco NV)
Archer Daniels Midland Co.
- *Disclaimer: Major Players sorted in no particular order


Recent Industry Developments
- January 2023: Novus International, Inc., a global animal health and nutrition company, acquired biotech firm Agrivida Inc. The acquisition includes Agrivida's INTERIUS™ technology, which enables the embedding of feed additives within grain.
- October 2022: Evonik and BASF established a licensing agreement that provides Evonik non-exclusive rights to Opteinics™, BASF's digital platform designed to analyze and reduce environmental impacts in feed and animal protein production.


North America Feed Amino Acids Market Report Scope
Lysine, Methionine, Threonine, Tryptophan are covered as segments by Sub Additive. Aquaculture, Poultry, Ruminants, Swine are covered as segments by Animal. Canada, Mexico, United States are covered as segments by Country.Sub Additive
| Lysine |
| Methionine |
| Threonine |
| Tryptophan |
| Other Amino Acids |
Animal
| Aquaculture | By Sub Animal | Fish |
| Shrimp | ||
| Other Aquaculture Species | ||
| Poultry | By Sub Animal | Broiler |
| Layer | ||
| Other Poultry Birds | ||
| Ruminants | By Sub Animal | Beef Cattle |
| Dairy Cattle | ||
| Other Ruminants | ||
| Swine | ||
| Other Animals |
Geography
| Canada |
| Mexico |
| United States |
| Rest of North America |
| Sub Additive | Lysine | ||
| Methionine | |||
| Threonine | |||
| Tryptophan | |||
| Other Amino Acids | |||
| Animal | Aquaculture | By Sub Animal | Fish |
| Shrimp | |||
| Other Aquaculture Species | |||
| Poultry | By Sub Animal | Broiler | |
| Layer | |||
| Other Poultry Birds | |||
| Ruminants | By Sub Animal | Beef Cattle | |
| Dairy Cattle | |||
| Other Ruminants | |||
| Swine | |||
| Other Animals | |||
| Geography | Canada | ||
| Mexico | |||
| United States | |||
| Rest of North America | |||


Market Definition
- FUNCTIONS - For the study, feed additives are considered to be commercially manufactured products that are used to enhance characteristics such as weight gain, feed conversion ratio, and feed intake when fed in appropriate proportions.
- RESELLERS - Companies engaged in reselling feed additives without value addition have been excluded from the market scope, to avoid double counting.
- END CONSUMERS - Compound feed manufacturers are considered to be end-consumers in the market studied. The scope excludes farmers buying feed additives to be used directly as supplements or premixes.
- INTERNAL COMPANY CONSUMPTION - Companies engaged in the production of compound feed as well as the manufacturing of feed additives are part of the study. However, while estimating the market sizes, the internal consumption of feed additives by such companies has been excluded.
| Keyword | Definition |
|---|---|
| Feed additives | Feed additives are products used in animal nutrition for purposes of improving the quality of feed and the quality of food from animal origin, or to improve the animals’ performance and health. |
| Probiotics | Probiotics are microorganisms introduced into the body for their beneficial qualities. (It maintains or restores beneficial bacteria to the gut). |
| Antibiotics | Antibiotic is a drug that is specifically used to inhibit the growth of bacteria. |
| Prebiotics | A non-digestible food ingredient that promotes the growth of beneficial microorganisms in the intestines. |
| Antioxidants | Antioxidants are compounds that inhibit oxidation, a chemical reaction that produces free radicals. |
| Phytogenics | Phytogenics are a group of natural and non-antibiotic growth promoters derived from herbs, spices, essential oils, and oleoresins. |
| Vitamins | Vitamins are organic compounds, which are required for normal growth and maintenance of the body. |
| Metabolism | A chemical process that occurs within a living organism in order to maintain life. |
| Amino acids | Amino acids are the building blocks of proteins and play an important role in metabolic pathways. |
| Enzymes | Enzyme is a substance that acts as a catalyst to bring about a specific biochemical reaction. |
| Anti-microbial resistance | The ability of a microorganism to resist the effects of an antimicrobial agent. |
| Anti-microbial | Destroying or inhibiting the growth of microorganisms. |
| Osmotic balance | It is a process of maintaining salt and water balance across membranes within the body's fluids. |
| Bacteriocin | Bacteriocins are the toxins produced by bacteria to inhibit the growth of similar or closely related bacterial strains. |
| Biohydrogenation | It is a process that occurs in the rumen of an animal in which bacteria convert unsaturated fatty acids (USFA) to saturated fatty acids (SFA). |
| Oxidative rancidity | It is a reaction of fatty acids with oxygen, which generally causes unpleasant odors in animals. To prevent these, antioxidants were added. |
| Mycotoxicosis | Any condition or disease caused by fungal toxins, mainly due to contamination of animal feed with mycotoxins. |
| Mycotoxins | Mycotoxins are toxin compounds that are naturally produced by certain types of molds (fungi). |
| Feed Probiotics | Microbial feed supplements positively affect gastrointestinal microbial balance. |
| Probiotic yeast | Feed yeast (single-cell fungi) and other fungi used as probiotics. |
| Feed enzymes | They are used to supplement digestive enzymes in an animal’s stomach to break down food. Enzymes also ensure that meat and egg production is improved. |
| Mycotoxin detoxifiers | They are used to prevent fungal growth and to stop any harmful mold from being absorbed in the gut and blood. |
| Feed antibiotics | They are used both for the prevention and treatment of diseases but also for rapid growth and development. |
| Feed antioxidants | They are used to protect the deterioration of other feed nutrients in the feed such as fats, vitamins, pigments, and flavoring agents, thus providing nutrient security to the animals. |
| Feed phytogenics | Phytogenics are natural substances, added to livestock feed to promote growth, aid in digestion, and act as anti-microbial agents. |
| Feed vitamins | They are used to maintain the normal physiological function and normal growth and development of animals. |
| Feed flavors and sweetners | These flavors and sweeteners help to mask tastes and odors during changes in additives or medications and make them ideal for animal diets undergoing transition. |
| Feed acidifiers | Animal feed acidifiers are organic acids incorporated into the feed for nutritional or preservative purposes. Acidifiers enhance congestion and microbiological balance in the alimentary and digestive tracts of livestock. |
| Feed minerals | Feed minerals play an important role in the regular dietary requirements of animal feed. |
| Feed binders | Feed binders are the binding agents used in the manufacture of safe animal feed products. It enhances the taste of food and prolongs the storage period of the feed. |
| Key Terms | Abbreviation |
| LSDV | Lumpy Skin Disease Virus |
| ASF | African Swine Fever |
| GPA | Growth Promoter Antibiotics |
| NSP | Non-Starch Polysaccharides |
| PUFA | Polyunsaturated Fatty Acid |
| Afs | Aflatoxins |
| AGP | Antibiotic Growth Promoters |
| FAO | The Food And Agriculture Organization of the United Nations |
| USDA | The United States Department of Agriculture |


Research Methodology
Mordor Intelligence follows a four-step methodology in all our reports.
- Step-1: IDENTIFY KEY VARIABLES: In order to build a robust forecasting methodology, the variables and factors identified in Step-1 are tested against available historical market numbers. Through an iterative process, the variables required for market forecast are set and the model is built on the basis of these variables.
- Step-2: Build a Market Model: Market-size estimations for the forecast years are in nominal terms. Inflation is not a part of the pricing, and the average selling price (ASP) is kept constant throughout the forecast period.
- Step-3: Validate and Finalize: In this important step, all market numbers, variables and analyst calls are validated through an extensive network of primary research experts from the market studied. The respondents are selected across levels and functions to generate a holistic picture of the market studied.
- Step-4: Research Outputs: Syndicated Reports, Custom Consulting Assignments, Databases & Subscription Platforms


