
North America Disaster Restoration Services Market Size and Share
Market Overview
| Study Period | 2020 - 2031 |
|---|---|
| Forecast Data Period | 2026 - 2031 |
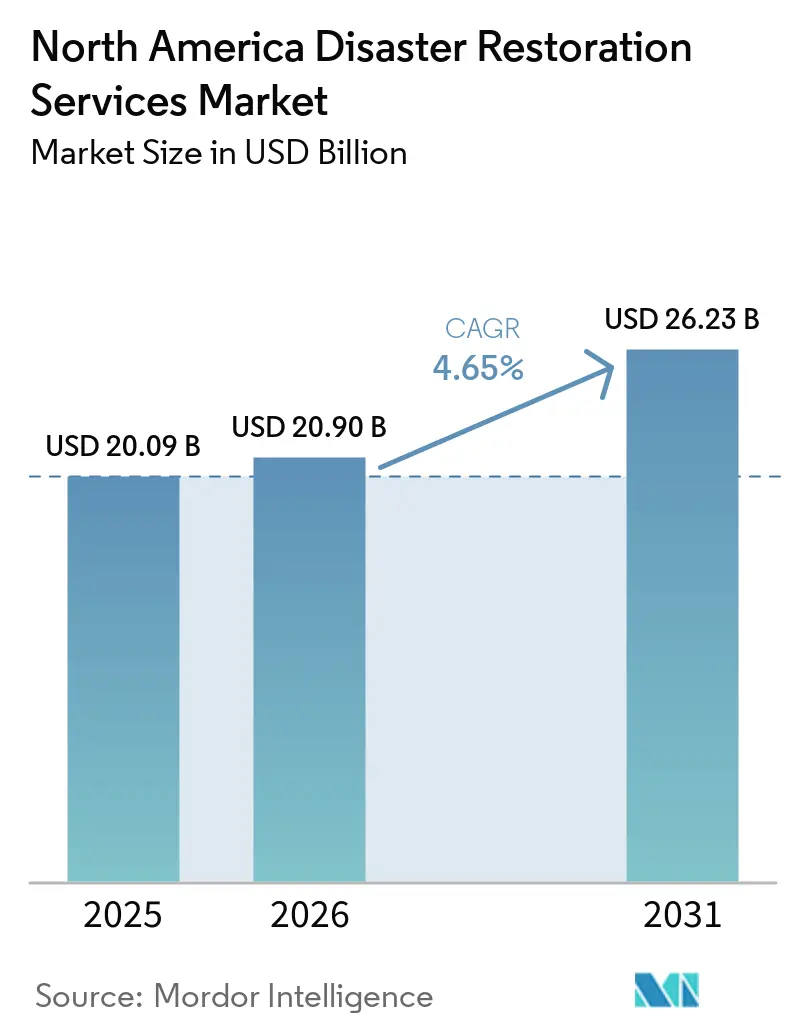
| Base Year Market Size (2025) | USD 20.09 Billion |
| Market Size (2026) | USD 20.90 Billion |
| Market Size (2031) | USD 26.23 Billion |
| Growth Rate (2026 - 2031) | 4.65 % |
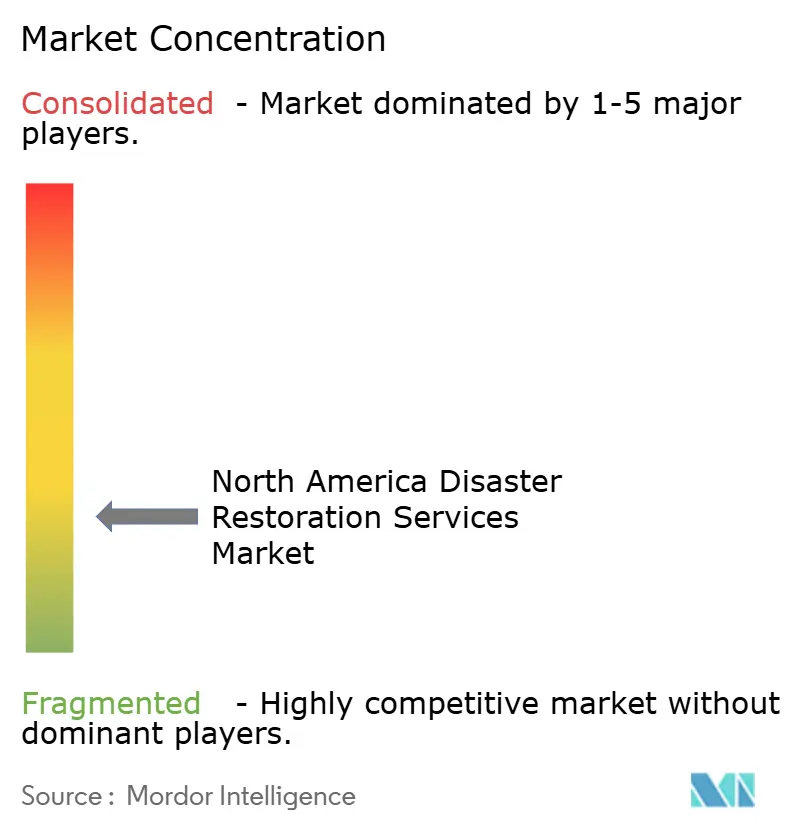
| Market Concentration | Low |
Major Players *Disclaimer: Major Players sorted in no particular order Image © Mordor Intelligence. Reuse requires attribution under CC BY 4.0. | |
North America Disaster Restoration Services Market Analysis by Mordor Intelligence
The North America Disaster Restoration Services Market size was valued at USD 20.09 billion in 2025 and is estimated to grow from USD 20.90 billion in 2026 to reach USD 26.23 billion by 2031, at a CAGR of 4.65% during the forecast period (2026-2031).
North America’s disaster restoration services market is supported by severe weather events, aging building infrastructure, rising property-loss incidents, and closer coordination between insurers, property owners, and restoration contractors. Demand is generated through both routine property-loss restoration and large-scale catastrophe response, creating a diversified revenue base across residential, commercial, and industrial properties. Water damage remains the largest service area, driven by plumbing failures, flooding, and other water-related incidents, while commercial and industrial properties account for a significant share of application revenue due to the higher restoration value and complexity of these projects. Insurance-funded assignments remain central to market activity, with insurers increasingly relying on restoration contractors to provide rapid assessment, mitigation, and repair services. At the same time, public-sector recovery work is gaining importance through FEMA-supported disaster recovery and resilience programs, particularly following major hurricanes, floods, wildfires, and other catastrophic events. However, skilled-labor shortages, contractor capacity constraints, rising restoration costs, and insurance coverage withdrawals in high-risk areas can limit service availability and reduce the value of insured restoration work in affected markets.
Key Report Takeaways
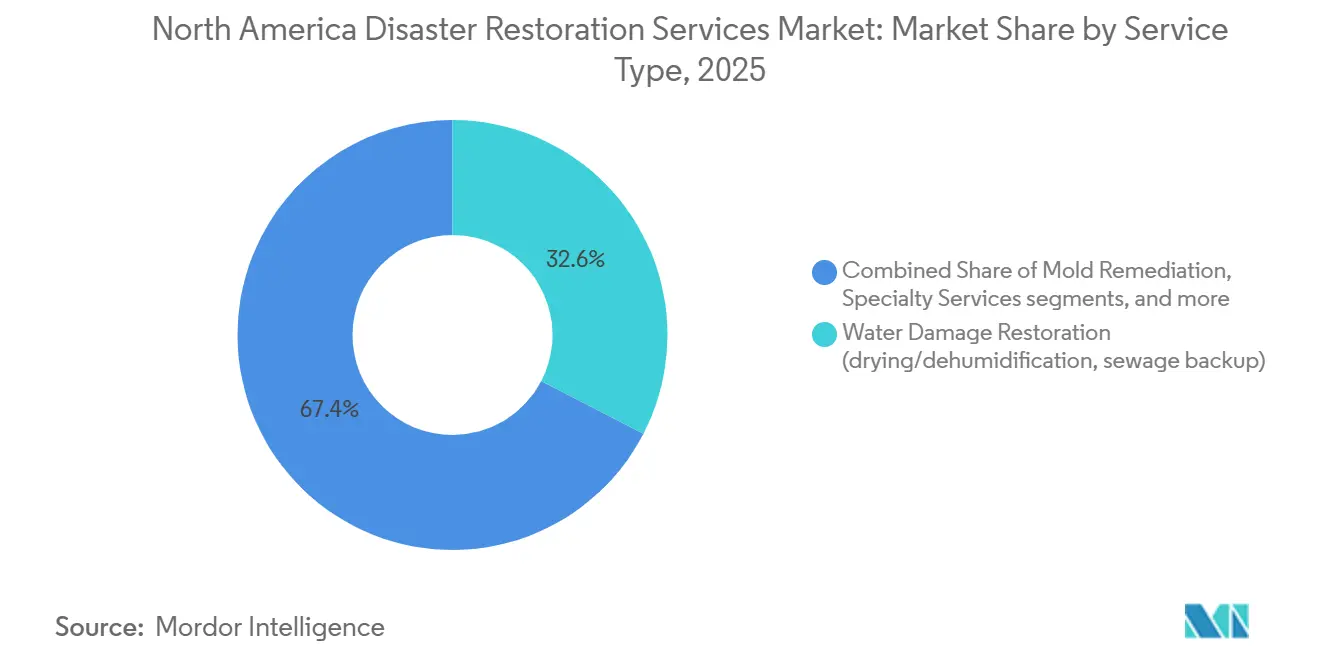
- By service type, water damage restoration accounted for 32.6% of the North America disaster restoration services market share in 2025, while the others category is projected to be the fastest-growing segment, with a CAGR of 6.90% through 2031.
- By application, commercial and industrial properties accounted for 53.5% of the North America disaster restoration services market size in 2025, while residential properties are projected to be the fastest-growing application segment, with a CAGR of 5.50% through 2031.
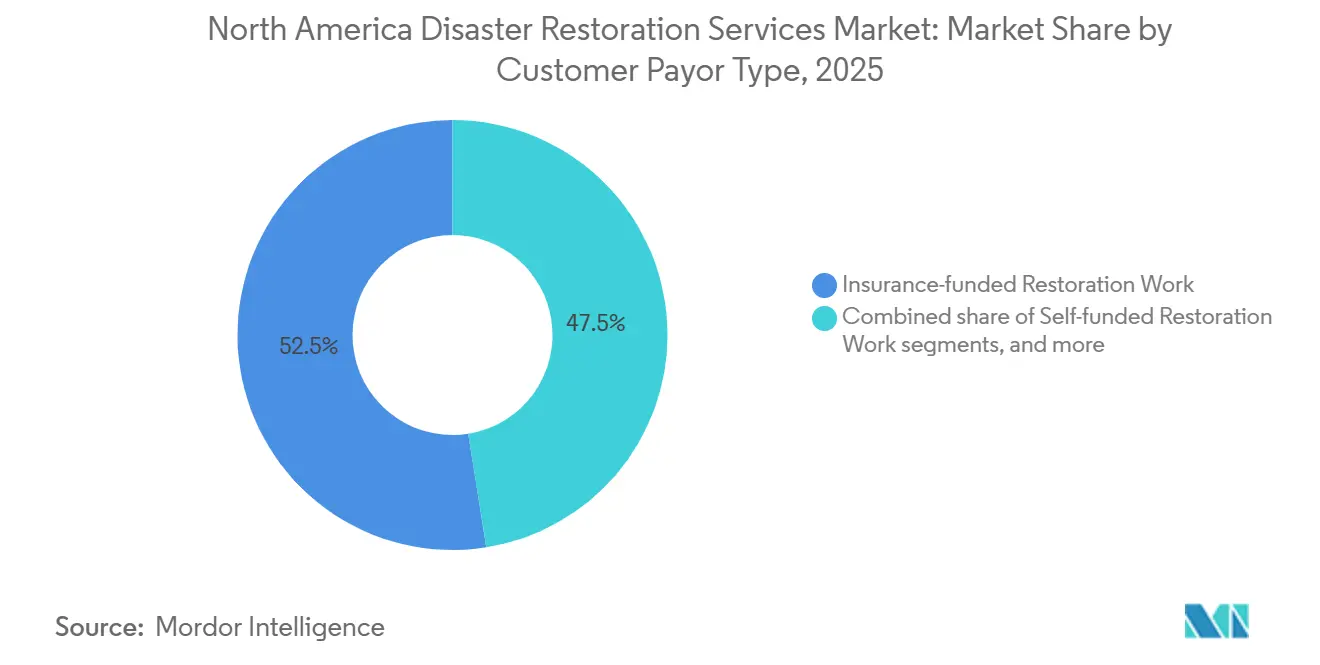
- By customer/payor type, insurance-funded work accounted for 52.5% of market revenue in 2025, while public-sector and government-funded work is projected to be the fastest-growing payor segment, with a CAGR of 5.60% through 2031.
- By geography, the United States accounted for 89.10% of market revenue in 2025, while Mexico is projected to be the fastest-growing geographic market, with a CAGR of 5.70% through 2031.
Note: Market size and forecast figures in this report are generated using Mordor Intelligence’s proprietary estimation framework, updated with the latest available data and insights as of January 2026.
North America Disaster Restoration Services Market Trends and Insights
Drivers Impact Analysis*
| Driver | (~) % Impact on CAGR Forecast | Geographic Relevance | Impact Timeline |
|---|---|---|---|
| Increasing Secondary-Peril Losses Across Wildfire and Severe Convective Storm Corridors | +1.4% | United States Western states, United States South, Midwest, Plains, Canadian Prairies, and British Columbia | Short term (≤ 2 years) |
| Aging Buildings and Deferred Maintenance Increasing Water-Loss Frequency | +1.1% | North America, with emphasis on the United States Northeast, Midwest, and older Canadian urban areas | Medium term (2-4 years) |
| Insurance Claim Digitization and Preferred-Vendor Routing | +0.8% | United States and Canada, especially high-volume metropolitan and suburban areas | Medium term (2-4 years) |
| Franchise and Catastrophe-Capacity Expansion Into Underserved Secondary Markets | +0.6% | United States Southeast, Midwest, Mountain West, Canadian Prairies, and Atlantic provinces | Medium term (2-4 years) |
| Resilience, Building-Code, and Public-Recovery Investment Expanding Restoration Scope | +0.4% | North America, especially FEMA-designated disaster areas and coastal and wildland-urban interface locations | Long term (≥ 4 years) |
| Smart Leak Detection and Pre-Loss Monitoring Creating Recurring Restoration Contracts | +0.3% | North America, with early adoption among commercial and multifamily properties | Long term (≥ 4 years) |
| Source: Mordor Intelligence | |||
Increasing Secondary-Peril Losses Across Wildfire and Severe Convective Storm Corridors
Wildfires, severe convective storms, hail, and atmospheric-river flooding are increasing restoration demand across most of the parts of North America. The United States recorded 23 billion-dollar disasters in weather and climate disasters in 2025, including 21 severe convective weather events, with USD 115 billion in direct losses. The January 2025 Los Angeles wildfire complex caused USD 61.2 billion in losses and placed sustained pressure on local restoration capacity. A 2025 Geophysical Research Letters study placed the probability of the United States weather and climate disaster losses exceeding USD 1 trillion during 2026 to 2030 above 50%. These events increase demand for emergency mitigation, cleaning, reconstruction, and content recovery services. Operators with equipment, certified crews, and cross-regional capacity can accept work that smaller local firms may not be able to take. The North America disaster restoration services market benefits when carrier networks need contractors that can respond quickly in affected locations. This driver also reinforces the value of established franchise and large-loss networks during extended recovery periods.
Aging Buildings and Deferred Maintenance Increasing Water-Loss Frequency
Aging water, stormwater, and wastewater systems create a consistent source of restoration work outside major catastrophe periods. ASCE gave the United States stormwater infrastructure a D grade and wastewater infrastructure a D+ grade in its 2025 report card[1].American Society of Civil Engineers, “2025 Report Card for America's Infrastructure,” American Society of Civil Engineers, asce.org. The same report identified a USD 3.7 trillion national infrastructure investment gap. Pipe failures, sewage backups, and moisture intrusion require drying, cleanup, and remediation work in homes and commercial buildings. The National Park Service reported USD 24 billion in deferred maintenance and repair needs across more than 70,000 assets in FY 2025. Contractors use moisture mapping, thermal imaging, and drying equipment to document losses and control the risk of mold. The North America disaster restoration services market, therefore, has a recurring demand base that is not limited to weather-related claims. IICRC standards and worker safety requirements favor firms that maintain formal training and documentation processes.
Insurance Claim Digitization and Preferred-Vendor Routing
Digital claims processes are changing how insurers assign price and audit restoration work. Carriers and third-party administrators assess contractors on response time, documentation, compliance, and cost control. These requirements give an advantage to operators who can provide structured digital records for each claim. PuroClean Disaster Services deployed an agentic AI platform in January 2026 to standardize work across seven carrier guideline frameworks. SERVPRO launched the Ready Plan mobile application in March 2026 to help commercial clients store property information and contact local franchises after a loss. These systems can shorten dispatch times and improve the consistency of claim information. Contractors without audit-ready records can face fewer opportunities in preferred vendor programs. This shift supports technology investment across the North America disaster restoration services market. It also makes technology capability more important for retaining carrier-directed volume.
Franchise and Catastrophe-Capacity Expansion into Underserved Secondary Markets
Gaps between loss exposure and certified contractor capacity create opportunities in secondary cities and rural markets. National franchises address these gaps through new locations and acquisitions. ServiceMaster Restore signed eighteen franchise agreements and opened twenty-five locations in 2025. The company is targeting 52 additional openings in 2026, with investment focused on the Southeast and Midwest. ServiceMaster Recovery Management added three commercial large-loss locations in Milwaukee, Columbus, and Tacoma in April 2026. Liberty Restoration Group completed two acquisitions in 2026 to build a multi-office Midwest platform within the ServiceMaster Restore system. Local capacity can reduce response delays and help insurers manage claim cycles during weather events. The North America disaster restoration services market gains coverage where franchised and regional operators can establish certified response teams. Expansion also allows larger platforms to mobilize crews across neighboring markets.[2]United States Bureau of Labor Statistics, “Occupational Outlook Handbook, Heating, Air Conditioning, and Refrigeration Mechanics and Installers,” United States Bureau of Labor Statistics, bls.gov.
Restraints Impact Analysis*
| Restraint | (~) % Impact on CAGR Forecast | Geographic Relevance | Impact Timeline |
|---|---|---|---|
| Insurance Retrenchment, Coverage Gaps and Claim-Settlement Friction | -0.7% | North America, particularly California, Florida, Louisiana, coastal areas, and wildland-urban interface zones | Short term (≤ 2 years) |
| Shortage of Certified Technicians and Reconstruction Trades | -0.6% | North America, especially during catastrophe surges, Sun Belt metropolitan areas, and secondary markets | Medium term (2-4 years) |
| Rising Equipment, Materials, Labor, and Compliance Costs Compressing Margins | -0.4% | North America, with greater pressure in California, New York, and the Pacific Northwest | Medium term (2-4 years) |
| Demand Volatility and Capacity Mismatch Between Catastrophe Surges and Normal Periods | -0.3% | North America, particularly hurricanes, wildfires, and severe-storm corridors | Long term (≥ 4 years) |
| Source: Mordor Intelligence | |||
Insurance Retrenchment, Coverage Gaps and Claim-Settlement Friction
Insurance coverage withdrawals can reduce the pool of funded restoration work in high-risk locations. NAIC data showed that company-initiated homeowner policy nonrenewal rates rose between 96% and 216% across four major United States regions between 2018 and 2025. A 2025 NAIC paper reported that seven large California homeowners' insurers, representing 35% of the state market, stopped writing new policies between 2023 and 2025. The paper also reported that the national share of uninsured homeowners rose from 5% in 2019 to 12% in 2023. In California, residual-market policy exposure rose from 50,000 in 2023 to more than 320,000 at the end of 2025. Restoration firms can encounter delayed, disputed, or unavailable reimbursement when claims coverage is limited. Lower reimbursement can restrict margin and investment in the areas with the most frequent property losses. The North America disaster restoration services market faces this constraint most directly in wildfire and coastal catastrophe corridors. NAIC's ZIP-code-level homeowners data call covering 2018 to 2025 may inform future policy and regulatory decisions.
Shortage of Certified Technicians and Reconstruction Trades
A shortage of trained technicians limits the number of jobs that restoration firms can complete during major loss events. Associated Builders and Contractors stated that the United States construction sector needed 439,000 net new workers in 2025 and needs 349,000 additional workers in 2026. Restoration work depends on certified drying specialists, mold remediators, reconstruction trades, and other skilled workers. The United States Bureau of Labor Statistics projects 8% employment growth for HVAC mechanics and installers between 2024 and 2034. The occupation is projected to have 40,100 annual openings over that period. JLL, citing the United States Department of Education estimates, stated that 2.1 million skilled-trades positions could remain unfilled by 2030. Labor constraints become more severe when multiple catastrophe events occur close together. Firms may rely on subcontractors, which can make protocol consistency and scheduling more difficult. The North America disaster restoration services market, therefore, depends on workforce development and certification capacity. Staffing pressure also contributes to wage costs during normal demand periods.
*Our forecasts treat driver/restraint impacts as directional, not additive. The impact forecasts reflect baseline growth, mix effects, and variable interactions.
Segment Analysis
By Service Type: Water Damage Leads, Pack-Out and Contents Services Accelerate
Water damage restoration accounted for 32.6% of the North America disaster restoration services market size in 2025. The segment includes drying, dehumidification, sewage backup response, and moisture mitigation. Aging plumbing systems create frequent losses in homes, commercial properties, and public buildings. Severe storms and atmospheric river flooding also increase the need for water removal and drying work. Incomplete drying can lead to mold conditions, which can expand the scope of an original claim. Water damage restoration is therefore linked to both everyday property maintenance issues and weather-related events. Contractors use moisture mapping, thermal imaging, and documented drying procedures to define the required work. IICRC S500 standards guide professional water damage restoration practices.[3]Institute of Inspection, Cleaning and Restoration Certification, “IICRC S500 Standard for Professional Water Damage Restoration and IICRC S700 Standard for Professional Fire and Smoke Damage Restoration,” Institute of Inspection, Cleaning and Restoration Certification, iicrc.org.
The others category is the fastest-growing service type, registering a 6.90% CAGR through 2031. The category includes contents restoration, pack-out, cleaning, and storage services. Insurers increasingly require contents inventories and pack-out services for large water and fire claims. These services add work that can follow policy activity rather than only major catastrophe events. Fire and smoke restoration also has higher job values because it requires specialized decontamination, odor control, and contents cleaning. IICRC S700 standards guide fire and smoke restoration processes. Specialty work can include asbestos abatement, lead paint remediation, and environmental cleanup during reconstruction. EPA and OSHA requirements affect how contractors manage this work. This range of services helps providers support a broader restoration scope after property damage.



By Application: Commercial Segment Anchors Revenue, Residential Segment Accelerates
Commercial and industrial properties accounted for 53.5% of the North America disaster restoration services market in 2025. The segment led the market because of larger projects, strong insurance coverage, and complex reconstruction requirements. Healthcare facilities, multifamily properties, hotels, government buildings, and industrial sites each have distinct cleanup and documentation needs. Restoration at these sites often requires containment, infection-control, and safety measures, as well as multi-phase reconstruction after water, fire, weather, or environmental damage. Established preferred-vendor and third-party administrator relationships also generate recurring managed-repair assignments from insurers and property managers. Providers, therefore, need sufficient scale and appropriate certifications to handle large, complex losses.
Residential is the fastest-growing application, registering a 5.50% CAGR through 2031. Rising home replacement values can increase claim severity after a loss. Wildland-urban interface growth also exposes more suburban and exurban homes to wildfire risks. Homeowners are increasingly using professional restoration services rather than completing repairs themselves. ATI Restoration stated in January 2025 that it was focusing on residential insurance restoration and TPA carrier relationships. Contractor licensing and mold remediation requirements vary across the United States and Canadian provinces. Lead and asbestos handling requirements can add further complexity to residential reconstruction work. Firms with standardized compliance programs can better manage these varied requirements. This supports residential expansion across the North America disaster restoration services market.
By Customer/Payor Type: Insurance Funding Dominates, Public-Sector Contracts Expand Fastest
Insurance-funded work held 52.5% of the North America disaster restoration services market size in 2025. Property and casualty claims from homeowners, commercial buildings, and specialty insurance lines support this payor category. Major carriers and managed-repair networks use preferred-vendor programs to route work to qualified contractors. These programs commonly require IICRC certification, digital documentation, and adherence to carrier scoping and pricing rules. Insurance funding gives larger providers an established source of assignments across multiple locations. The payor stream is still sensitive to coverage withdrawals in high-risk areas. Coverage limits or nonrenewal can reduce the amount of insured work available in affected regions. Insurer relationships remain important because they influence access to the largest payor segment.
Public-sector and government-funded work is the fastest-growing payor category, registering a 5.60% CAGR through 2031. FEMA Public Assistance supports debris removal, structural restoration, utility repair, and public-building reconstruction after declared disasters. FEMA approved more than USD 835 million for Florida recovery projects through September 2025. North Carolina's Hurricane Helene recovery received more than USD 1 billion in FEMA funding during 2025. These programs can support restoration activity after the urgent response stage ends. Self-funded and direct-pay work is also expanding where insurance coverage is harder to obtain. Property owners may fund this work directly or use Small Business Administration disaster loans. Public and self-funded assignments create alternative demand sources for the North America disaster restoration services market.
Geography Analysis
The United States held 89.1% of the North America disaster restoration services market share in 2025. A large property insurance system, frequent federally declared disasters, and a wide contractor base support its position. The Southeast and Gulf Coast generate high annual demand from hurricane activity and flooding. FEMA recovery funding after Hurricane Helene supports contractor activity beyond the initial response stage. California faced strong wildfire restoration demand after the January 2025 Los Angeles wildfire complex. The Midwest and Great Plains also generated demand from tornadoes and hailstorms. The Northeast has recurring pipe failures, water losses, and mold mitigation needs in aging residential and commercial buildings. FEMA, EPA, and OSHA compliance requirements affect eligibility for public-sector restoration work.
Severe weather-related insured losses reached USD 1.7 billion in Canada during 2025. The late-March Ontario-Quebec ice storm generated USD 349.1 million in insured losses, using the 2025 currency relationship provided in the supplied material. Insured catastrophe losses increased from USD 10 billion in the 2006 to 2015 period to USD 26.4 billion in the 2016 to 2025 period, using the same supplied currency relationship. Alberta and British Columbia face wildfire and flood exposure, while central and eastern provinces face ice, freeze, and severe thunderstorm losses. First Onsite Property Restoration, DKI Services, On-Side Restoration, and WINMAR operate across Canadian markets. The Insurance Bureau of Canada's resilience plan calls for greater investment in community resilience infrastructure. Provincial insurance systems and federal disaster assistance arrangements shape the local operating environment.
Mexico is the fastest-growing geography in the North America disaster restoration services market, registering a 5.70% CAGR through 2031. Urban growth and greater formal insurance use support professional restoration demand in Mexico City, Guadalajara, and Monterrey. The professional restoration base remains less developed than in the United States and Canada. This creates growth potential from a smaller starting point. Expanding middle-class property ownership can increase demand for formal property repair services. United States and Canadian franchise brands may have an opportunity if they adapt to local regulatory and operating conditions. Infrastructure needs and a developing contractor certification system can influence the pace of formal service adoption. The geographic opportunity remains tied to improvements in insurance access, local capacity, and property protection practices.
Competitive Landscape
The North America disaster restoration services market is fragmented, with thousands of independent and regional contractors alongside national franchise systems and large-loss specialists. SERVPRO, BELFOR, and ServiceMaster Restore have broad coverage across the United States. SERVPRO reported 2,390 franchises in the United States and Canada in 2026, a 12% increase over the prior three years. National firms compete through response capacity, carrier relationships, technology, and certified workforces. Independent and regional firms compete strongly through local knowledge and established insurer relationships. Private equity is supporting consolidation among franchise and regional operators. Liberty Restoration Group was formed in 2025 and completed two acquisitions in 2026 to build its Midwest operating platform. This activity can create larger multi-market providers with shared management and deployable labor resources.
Technology and documentation are increasingly important in restoration services assignments. PuroClean Disaster Services introduced an agentic AI platform in January 2026 that supports compliance across seven carrier guideline frameworks. SERVPRO launched its Ready Plan application in March 2026 to help commercial clients maintain property information and contact local franchises during an emergency. These moves show how operators are seeking faster dispatch and more consistent claim documentation. IICRC certifications, EPA requirements, and OSHA safety requirements remain important entry requirements for preferred-vendor and public-sector work. Drone-based site capture and AI-assisted scope development can shorten the time from loss to estimate approval. Firms that invest in these tools can strengthen their position with insurers and national accounts.
Competitive opportunities remain in underinsured and self-pay work, property monitoring, and underserved secondary cities. ServiceMaster Restore is targeting 52 new locations in 2026 after 18 franchise agreements and 25 openings in 2025. ServiceMaster Recovery Management expanded its large-loss network to more than 400 locations in April 2026 through new designations in Milwaukee, Columbus, and Tacoma. BluSky Restoration Contractors opened a Northern Illinois location in January 2026 to support the Chicago, Milwaukee, and lower Wisconsin areas. ATI Restoration also focused on residential insurance restoration and carrier relationships during 2025. These strategies combine geographic coverage, commercial account development, and insurer access. The North America disaster restoration services market remains competitive because local response capability still matters alongside national scale.
North America Disaster Restoration Services Industry Leaders
SERVPRO Industries, LLC
BELFOR Holdings, Inc.
ServiceMaster Restore
First Onsite Property Restoration
ATI Restoration
- *Disclaimer: Major Players sorted in no particular order

Recent Industry Developments
- August 2026: Liberty Restoration Group completed its acquisition of ServiceMaster Restoration Services by KRS, adding three offices in Peoria and Bloomington, Illinois, and Milwaukee, Wisconsin. The transaction marked Liberty’s second acquisition of 2026, following its April acquisition of ServiceMaster of Columbia, and expanded its ServiceMaster Restore platform to eight markets across five Midwestern states.
- April 2026: ServiceMaster Recovery Management expanded its nationwide commercial disaster restoration network to more than 400 locations by adding three newly designated locations in Milwaukee, Wisconsin, Columbus, Ohio, and Tacoma, Washington. The expansion strengthens SRM’s large-loss and catastrophe-response coverage for commercial property owners across these markets.
- April 2026: Liberty Restoration Group completed its acquisition of ServiceMaster of Columbia in Columbia, Missouri, marking the company’s first acquisition of 2026. The transaction formed the initial step in Liberty’s expansion of its multi-market ServiceMaster Restore platform, which was subsequently expanded through its August acquisition of ServiceMaster Restoration Services by KRS.


North America Disaster Restoration Services Market Report Scope
The North America Disaster Restoration Services Market Report is Segmented by Service Type (Water Damage Restoration, Fire and Smoke Damage Restoration, and More), by Application (Residential and Commercial & Industrial), by Customer/Payor Type (Insurance-funded Restoration Work, and More), and by Geography (United States, and More). The Report Offers Market Size and Forecast in Terms of Value (USD) for all the Above Segments.
| Water Damage Restoration (drying/dehumidification, sewage backup) |
| Fire & Smoke Damage Restoration |
| Mold Remediation |
| Storm / Catastrophe Restoration (wind, hail, flood response, large-loss) |
| Biohazard & Trauma Cleanup (crime scene, unattended death, infectious cleanup) |
| Specialty Services |
| Others (contents restoration, pack-out, cleaning, storage, etc.) |
| Residential |
| Commercial & Industrial |
| Insurance-funded Restoration Work |
| Self-funded / Direct-pay Restoration Work |
| Public-sector / Government-funded Restoration Work |
| United States |
| Canada |
| Mexico |
| By Service Type | Water Damage Restoration (drying/dehumidification, sewage backup) |
| Fire & Smoke Damage Restoration | |
| Mold Remediation | |
| Storm / Catastrophe Restoration (wind, hail, flood response, large-loss) | |
| Biohazard & Trauma Cleanup (crime scene, unattended death, infectious cleanup) | |
| Specialty Services | |
| Others (contents restoration, pack-out, cleaning, storage, etc.) | |
| By Application | Residential |
| Commercial & Industrial | |
| By Customer/Payor Type | Insurance-funded Restoration Work |
| Self-funded / Direct-pay Restoration Work | |
| Public-sector / Government-funded Restoration Work | |
| By Geography | United States |
| Canada | |
| Mexico |


Key Questions Answered in the Report
What is the value of disaster restoration services in North America?
The sector is valued at USD 20.9 billion in 2026 and is projected to reach USD 26.2 billion by 2031.
What is driving demand for disaster restoration services in North America?
Severe weather losses, aging building systems, insurer-directed work, and public recovery programs support demand.
Which service category is the largest in North America?
Water damage restoration was the largest service category, with 32.6% of revenue in 2025.
Which application generates the most revenue for restoration contractors?
Commercial and industrial properties generated the largest application share, at 53.5% in 2025
How important is insurance-funded work to restoration providers?
Insurance-funded work accounted for 52.5% of revenue in 2025 and remains the largest payor category.
Which country leads to restoration services in North America?
The United States led the region with 89.1% of revenue in 2025, while Mexico was the fastest-growing geography through 2031.
Page last updated on:





