North America Non-dairy Ice Cream Market Size and Share
Market Overview
| Study Period | 2020 - 2030 |
|---|---|
| Forecast Data Period | 2025 - 2030 |
| Historical Data Period | 2020 - 2023 |
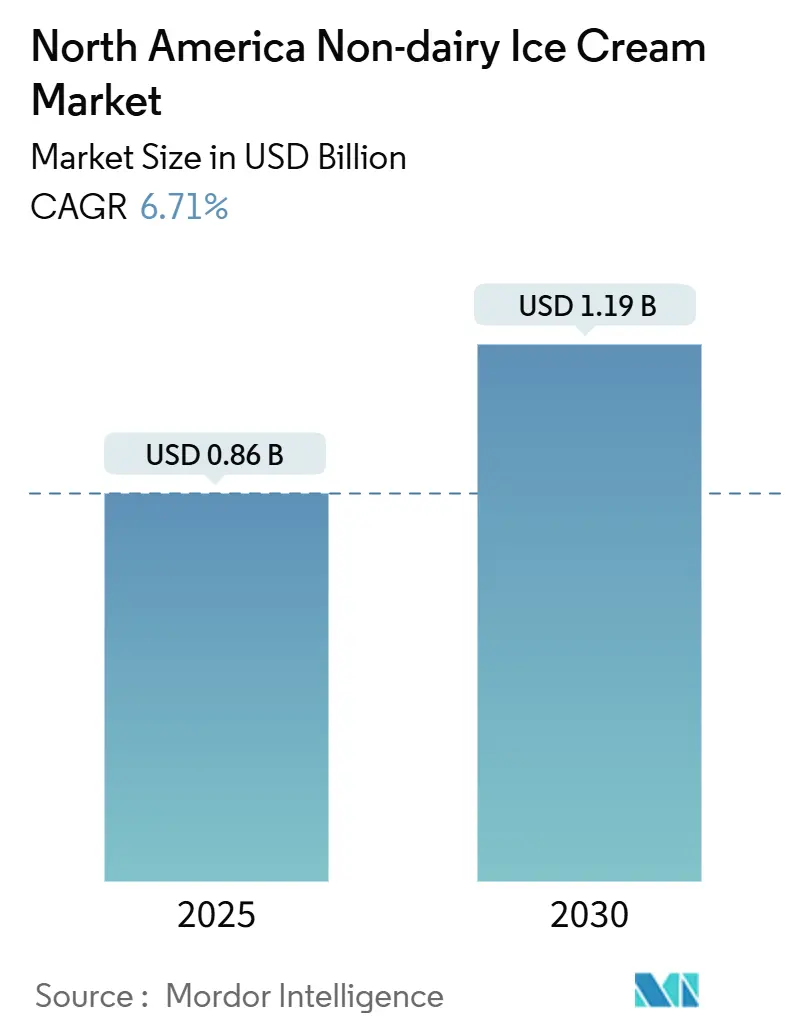
| Market Size (2025) | USD 0.86 Billion |
| Market Size (2030) | USD 1.19 Billion |
| Growth Rate (2025 - 2030) | 6.71% CAGR |
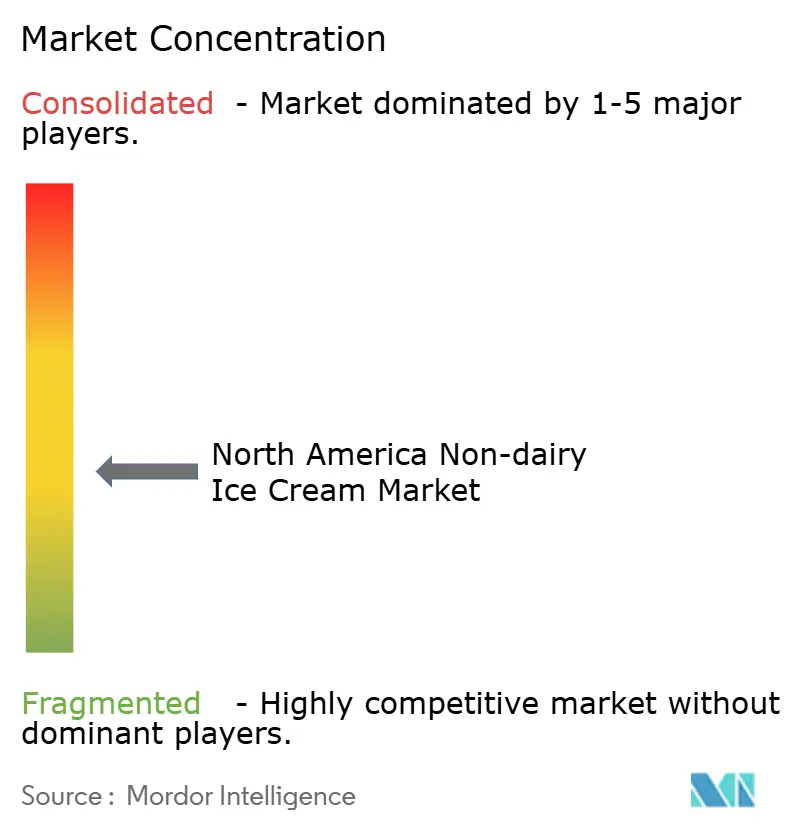
| Market Concentration | Medium |
Major Players
*Disclaimer: Major Players sorted in no particular order Image © Mordor Intelligence. Reuse requires attribution under CC BY 4.0. |
|
North America Non-dairy Ice Cream Market Analysis by Mordor Intelligence
The non-dairy ice cream market size in North America stands at USD 0.86 billion in 2025 and is forecast to reach USD 1.19 billion by 2030, expanding at a 6.71% CAGR over the period. Increasing lactose intolerance, the growing popularity of flexitarian diets, and rapid product innovations are driving non-dairy ice creams from niche products to mainstream household items. Although traditional ice cream formats currently dominate revenue, novelty products like sticks and sandwiches are capturing impulse purchases previously led by dairy brands, thereby enhancing average price realization. Urban Mexican consumers are adopting plant-based frozen desserts at a faster rate than their U.S. counterparts, showcasing the impact of median-age shifts and modern retail on the expanding non-dairy ice cream market. Distribution is increasingly shifting toward convenience stores and quick-commerce platforms, reducing delivery times and boosting single-serve sales. The competitive landscape remains intense, with established dairy companies defending freezer space, while newer, digitally-native brands focus on direct-to-consumer approaches and emphasize clean-label narratives.
Key Report Takeaways
- By product type, standard ice cream held 46.35% of the non-dairy ice cream market share in 2024, while novelties are projected to grow at a 6.98% CAGR through 2030.
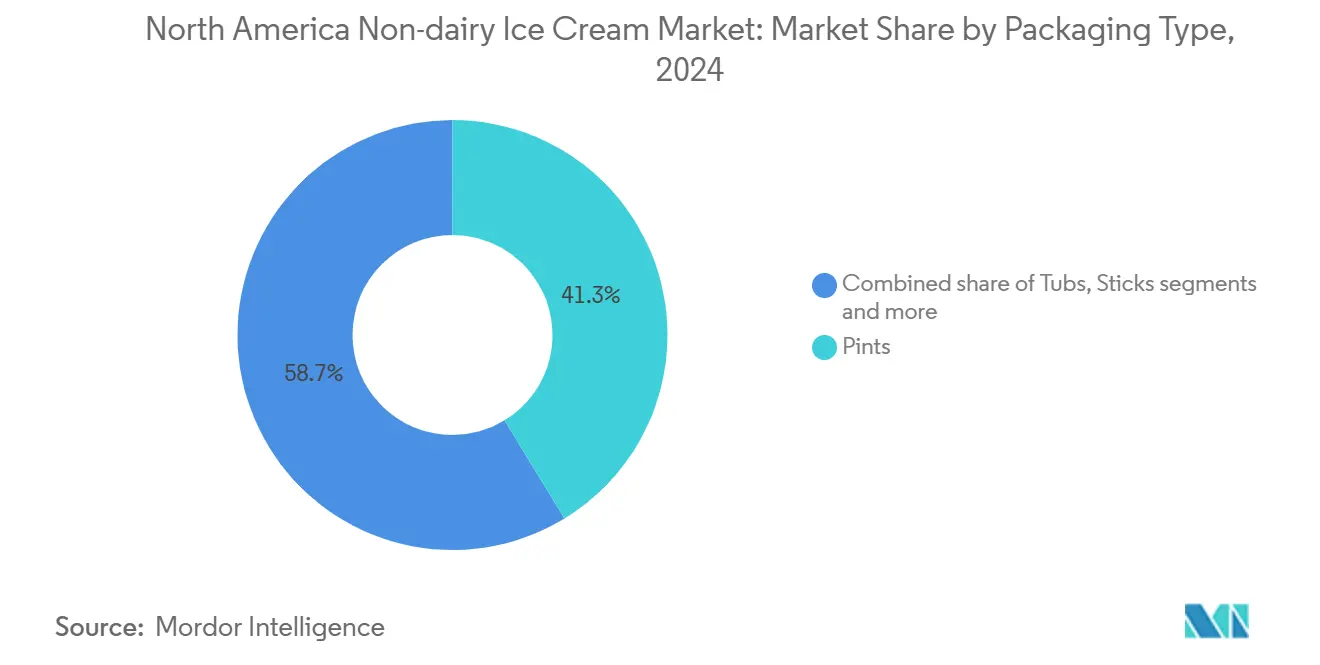
- By packaging type, pints accounted for 41.28% of the non-dairy ice cream market size in 2024; sticks are forecast to expand at a 7.32% CAGR over the same horizon.
- By distribution channel, off-trade outlets captured 79.24% of 2024 value, whereas on-trade foodservice is expected to advance at a 7.13% CAGR to 2030.
- By geography, the United States contributed 94.58% of 2024 revenue and Mexico is predicted to post a 7.24% CAGR through 2030.
North America Non-dairy Ice Cream Market Trends and Insights
Drivers Impact Analysis*
| Driver | (~) % Impact on CAGR Forecast | Geographic Relevance | Impact Timeline |
|---|---|---|---|
| Rising lactose intolerance and dairy allergy prevalence | +1.2% | North America, with highest impact in US West Coast, Canada, and Mexican urban centers | Medium term (2-4 years) |
| Expanding vegan and flexitarian consumer base | +1.5% | US coastal markets, Canadian metropolitan areas, Mexico City and Guadalajara | Long term (≥ 4 years) |
| Health consciousness favoring low-fat, low-sugar products | +0.9% | US Northeast and West Coast, Canadian urban centers | Short term (≤ 2 years) |
| Product innovation improving creamy textures and diverse flavors | +1.3% | North America | Medium term (2-4 years) |
| Sustainability and ethical sourcing appealing to eco-aware shoppers | +0.8% | US West Coast, Canadian provinces, Mexican tourism hubs | Long term (≥ 4 years) |
| Premiumization with unique, high-protein flavors attracting wellness-focused buyers | +0.7% | US metropolitan areas, Canadian cities, Mexican affluent neighborhoods | Medium term (2-4 years) |
| Source: Mordor Intelligence | |||


Rising lactose intolerance and dairy allergy prevalence
In 2024, Medline Plus reported that approximately 30 million American adults experience lactose intolerance by the time they reach their 20s [1]Source: Medline Plus, "Lactose intolerance", medlineplus.gov. This widespread condition elevates non-dairy ice cream from being a simple lifestyle preference to a critical dietary necessity for a significant portion of North American households. The West Coast, characterized by a higher concentration of Asian and Hispanic populations, leads in per-capita consumption of plant-based frozen desserts. In contrast, the South and Midwest regions, despite increasing awareness, continue to lag in adoption rates. In Mexico, the high prevalence of lactose intolerance, combined with rising disposable incomes and the modernization of retail infrastructure through major chains like Walmart and Soriana, is driving robust demand for non-dairy alternatives. These factors contribute to the country's strong projected compound annual growth rate (CAGR) of 7.24% through 2030. Although dairy allergies are less common than lactose intolerance, they necessitate complete avoidance of dairy products among affected children and adults. Consequently, parents are increasingly prioritizing allergen-free options to meet the dietary needs of multi-generational households.
Expanding vegan and flexitarian consumer base
In 2024, 59% of U.S. households purchased plant-based foods, as reported by the Good Food Institute [2]Source: Good Food Institute, "U.S retail market insight for plant-based industry", gfi.org.. These consumers are reducing their intake of animal products without completely eliminating them. They occasionally indulge in plant-based treats, expanding the market beyond strict vegans. Younger generations, particularly Gen Z and millennials, are driving this trend, motivated by health, environmental concerns, and animal welfare. Social media, supported by celebrity endorsements and influencer marketing, has shifted plant-based eating from niche to mainstream. In 2025, PETA recognized Chicago as the most vegan-friendly city in the U.S., citing its wide variety of plant-based options [3]Source: PETA, " PETA's Top 10 Vegan Friendly Cities of 2025", peta.org.. The normalization of oat milk in coffee culture has reduced skepticism about plant-based dairy, encouraging consumers to try non-dairy ice cream. Institutional adoption, such as Sodexo's goal of 42% plant-based meals on college campuses by 2025, introduces these options to students during formative years, fostering long-term loyalty. Mexico's urban youth, especially in metropolitan areas influenced by U.S. food trends and cultural exchanges, are reflecting similar patterns.
Product innovation improving creamy textures and diverse flavors
Oat milk bases are the fastest-growing ingredient platform, utilizing naturally occurring beta-glucan polysaccharides to provide viscosity and mouthfeel without relying on synthetic stabilizers. Companies like Perfect Day have advanced precision fermentation technologies to produce animal-free whey proteins that replicate the functional properties of dairy casein. This innovation enables manufacturers to achieve scoopability and melt resistance, which were previously unattainable with nut or coconut bases. Although hydrocolloid blends, such as guar gum, xanthan gum, and carrageenan, remain common for texture optimization, the demand for clean-label products is pushing formulators toward natural alternatives like acacia gum and konjac. High-pressure processing and ultra-filtration slightly extend shelf life while preserving flavor integrity, addressing a critical logistics challenge. Flavor innovation has progressed beyond traditional options like vanilla and chocolate to include complex profiles such as salted caramel, matcha, black sesame, and cardamom. These premium flavors not only command higher prices but also distinguish artisanal brands from mass-market competitors.
Health consciousness favoring low-fat, low-sugar products
With rising obesity rates in Mexico, consumer demand for reduced-sugar formulations has grown, driving a preference for lower-calorie indulgences. Non-dairy ice cream is often promoted as a healthier option, but its nutritional profiles vary significantly: coconut-based varieties can equal or exceed dairy in saturated fat, while almond and oat bases typically have lower fat content but may contain higher carbohydrates unless fortified with protein isolates. To address the protein gap, brands are incorporating pea and soy protein, targeting 5 to 8 grams per serving to attract fitness-conscious consumers. The "better-for-you" narrative resonates strongly with health-focused demographics in the US Northeast and West Coast, who value ingredient transparency and functional benefits. However, formulators face challenges in reducing sugar, as the use of sugar alcohols or alternative sweeteners can result in off-flavors or digestive discomfort, complicating efforts to maintain a clean-label image.
Restraints Impact Analysis*
| Restraint | (~) % Impact on CAGR Forecast | Geographic Relevance | Impact Timeline |
|---|---|---|---|
| Higher pricing compared to dairy ice cream limiting mass adoption | -1.8% | US Midwest and South, rural Canada, non-metropolitan Mexico | Short term (≤ 2 years) |
| Consumer preference for traditional dairy taste and texture persisting | -1.2% | US Midwest and South, rural North America, older demographic cohorts | Long term (≥ 4 years) |
| Fluctuating availability of quality plant-based ingredients affecting supply | -0.6% | North America, with supply-chain dependencies on California, Midwest oat production, and tropical coconut regions | Medium term (2-4 years) |
| Limited shelf life and stability issues in non-dairy formulations challenging logistics | -0.5% | North America, particularly affecting rural distribution and low-turnover retail | Medium term (2-4 years) |
| Source: Mordor Intelligence | |||
Higher pricing compared to dairy ice cream limiting mass adoption
Non-dairy ice cream is priced at a premium, typically 2 to 3 times higher than dairy alternatives. This price gap is primarily due to the higher costs of ingredients, such as oat milk, almond milk, and coconut cream, which are more expensive than conventional dairy, and the smaller production scale. Plant-based production often involves shorter batches and more frequent changeovers. Middle-income households, particularly in the Midwest and South, where a strong cultural connection to traditional dairy exists due to a history of dairy farming, are more price-sensitive and less inclined to try these higher-priced options. Although organic dairy ice cream competes more closely with plant-based varieties in the premium segment, plant-based ice cream continues to face challenges in achieving mass-market penetration. Retailers are hesitant to allocate significant freezer space to a category with slower turnover, reinforcing a cycle of limited availability and higher per-unit costs.
Consumer preference for traditional dairy taste and texture persisting
Decades of dairy consumption have established high sensory expectations for plant-based alternatives. Despite progress, coconut-based products often exhibit a noticeable flavor that divides consumers. Almond bases may seem thin or watery unless fats are incorporated. Oat milk, valued for its neutral taste, still lacks the richness provided by butterfat, particularly in the premium ice cream market, where dairy contains 14% to 18% milkfat. Older demographic groups, such as Baby Boomers and Gen X, are less inclined to sacrifice taste for health or sustainability, preferring to reduce dairy intake rather than fully replace it. Regional preferences add to the complexity: the Midwest and South, with their strong dairy farming heritage, adopt alternatives more slowly than coastal markets. Although blind taste tests show improvements, real-world purchasing decisions are influenced by brand familiarity, nostalgia, and habit, which continue to favor traditional dairy products.
*Our forecasts treat driver/restraint impacts as directional, not additive. The impact forecasts reflect baseline growth, mix effects, and variable interactions.
Segment Analysis
By Product Type: Novelties Capture Impulse Demand
From 2025 to 2030, novelties—such as sticks, sandwiches, and mochi formats—are expected to grow at an annual rate of 6.98%. This growth reflects changing consumption patterns: grab-and-go formats suit busy lifestyles, portion control appeals to calorie-conscious consumers, and individually wrapped items help reduce waste in single-person households. Klimon’s placement in 400 7-Eleven stores across Southern California in 2024, with plans for nationwide expansion, highlights the potential of convenience-store distribution. This approach not only captures impulse purchases but also challenges the dominance of traditional dairy players. Standard ice cream accounted for a 46.35% market share in 2024, driven by pint formats that cater to traditional at-home consumption. However, this segment is facing saturation in mature markets as younger consumers increasingly prioritize convenience over bulk purchasing. In foodservice, soft-serve applications are expanding. Operators like Ripple Foods are promoting bulk formats, such as 1-gallon and 2.5-gallon containers, designed for commercial dispensers. These products target restaurants, cafeterias, and quick-service chains seeking allergen-free menu options.
Specialty and artisanal ice creams, often commanding premium prices, leverage limited-edition flavors, organic certifications, and direct-to-consumer channels. Brands like Van Leeuwen and Salt and Straw are strengthening customer loyalty among affluent, health-conscious consumers through subscription models and local pickup options. Mochi novelties, popularized by brands like Bubbies, combine Japanese confectionery traditions with plant-based formulations, appealing to multicultural urban markets and younger consumers seeking unique textures. Sandwich formats evoke childhood nostalgia while addressing dietary restrictions, with Klimon focusing on schools and family-oriented retail environments. However, distributing novelties presents challenges. Their smaller package sizes and higher surface-area-to-volume ratios increase susceptibility to freezer burn, requiring strict cold-chain management and faster inventory turnover. These challenges are particularly pronounced in rural stores with slower turnover rates.


By Packaging Type: Sticks Surge on Convenience Trends
Convenience-driven formats are transforming packaging dynamics. Sticks, anticipated to grow at a 7.32% CAGR from 2025 to 2030, are expected to surpass the market average by over three percentage points. Sticks, including bars, sandwiches, and handheld novelties, are designed for on-the-go consumption and impulse purchases at convenience stores and gas stations. They also provide single-serve portions, attracting health-conscious consumers who monitor their caloric intake. In 2024, pints accounted for a 41.28% market share, highlighting their dominance in grocery and specialty retail. Consumers in these channels prefer larger package sizes for at-home consumption. However, urbanization and smaller household sizes are likely to reduce the demand for multi-serving containers, slowing this segment's growth. Tubs, typically sized between 1-quart and 1.5-quart, are popular for family gatherings and entertainment. Nevertheless, they face challenges from premiumization trends that prioritize smaller, high-quality portions over bulk purchases. Other packaging formats, such as cups, cones, and mini-tubs, serve niche applications in foodservice, events, and sampling programs. Brands use these formats to introduce new flavors, enabling consumers to try products without committing to a full pint.
The retail sector is adapting to the growing prominence of the stick segment. For example, 7-Eleven is shifting towards larger, food-focused store formats. Their expanded frozen sections now feature individually wrapped plant-based novelties that previously lacked shelf space. Quick-commerce platforms like DoorDash, GoPuff, and Instacart are reshaping the market by enabling impulse deliveries of single-serve items, bypassing traditional grocery trips and simplifying frozen product transportation. Sustainability is a significant focus in packaging innovation. Brands are exploring compostable wrappers and recyclable materials to strengthen their environmental positioning. However, widespread adoption faces obstacles such as cost premiums and performance limitations, particularly with moisture barriers in frozen environments. Pints remain crucial in direct-to-consumer channels. Brands like NadaMoo! and Salt and Straw leverage this format by shipping 4 to 5 pint minimums with dry-ice packaging. Through subscription models, they offset logistics costs and establish consistent recurring revenue streams.
By Distribution Channel: On-Trade Gains as Foodservice Adopts
From 2025 to 2030, foodservice and on-trade channels are projected to grow at a 7.13% CAGR, surpassing the market average by nearly four percentage points. This growth is fueled by restaurants, cafeterias, and quick-service operators increasingly incorporating plant-based options to address the rising demand from allergen-free, vegan, and flexitarian consumers. Ripple Foods is focusing on promoting bulk formats, 1-gallon and 2.5-gallon containers, targeted at commercial operators. These formats, optimized for soft-serve compatibility and operational efficiency, allow kitchens to provide dairy-free options without requiring specialized equipment or separate supply chains. Off-trade channels accounted for a significant 79.24% share in 2024, driven by supermarkets, hypermarkets, and specialty retailers. Consumers rely on these outlets for planned purchases and brand comparisons, but growth in this segment is expected to slow due to market saturation in coastal regions, which limits additional household penetration.
Convenience stores and online retail are transforming off-trade dynamics. Klimon's collaboration with 7-Eleven and Odd Burger's expansion into over 500 7-Eleven Canada locations highlights the potential of convenience-store placements. These placements not only encourage impulse purchases but also appeal to younger, mobile consumers who prioritize accessibility over cost. E-commerce and direct-to-consumer channels are enabling brands to bypass traditional retail barriers. Companies such as GoodPop, NadaMoo!, and Salt and Straw are leveraging this trend by offering subscription services, local pickups, and dry-ice shipping. Their focus is on affluent, health-conscious households willing to pay a premium for convenience and unique flavors. Quick-commerce platforms like DoorDash, GoPuff, and Instacart are reshaping delivery by reducing windows to just 15 to 30 minutes. This rapid service mitigates concerns about frozen-product quality and supports impulse purchases that previously required a grocery trip. At the same time, specialist retailers, including natural-food stores and organic chains like Whole Foods, remain vital for premium and artisanal brands. These outlets provide curated shelf placements and knowledgeable staff to emphasize ingredient quality and sustainability credentials.
Geography Analysis
In 2024, the U.S. holds a commanding 94.58% market share, driven by its advanced retail infrastructure, widespread household adoption of plant-based foods, and a high concentration of affluent, health-conscious consumers in coastal metropolitan areas. States such as California, Oregon, and Washington lead this trend, influenced by their significant Asian and Hispanic populations, who often experience higher lactose intolerance rates, wealth from the tech industry that emphasizes sustainability, and progressive food cultures that embrace plant-based diets. Meanwhile, the Northeast, particularly urban centers like New York, Boston, and Philadelphia, exhibits strong demand, supported by dense populations, younger demographics, and the adoption of plant-based options by universities and corporate campuses. In contrast, the Midwest and South face obstacles, including cultural ties to dairy farming, generally lower household incomes, and rural retail environments that prioritize conventional products due to limited freezer space. The FDA's February 2023 guidance, which permits the use of "milk" terminology with plant-source qualifiers, has eased labeling challenges. This clarity in product communication has reduced consumer confusion, which previously hindered product trials.
From 2025 to 2030, Mexico is projected to lead North America with a 7.24% CAGR, driven by a youthful median age of 29, urbanization that centralizes purchasing power in cities like Mexico City and Guadalajara, and rising childhood obesity rates prompting dietary changes. Retail giants such as Walmart, Soriana, and the convenience chain Oxxo are modernizing the retail landscape by expanding frozen sections and improving cold-chain reliability. These advancements enable plant-based brands to reach middle-class households that previously had access only to ambient or fresh products. In tourist destinations like Cancun, Playa del Carmen, and Mexico City, demand for plant-based options is growing, catering to both international tourists and affluent locals. This has resulted in premium-tier distribution channels that eventually extend to the mass market. While local startups and regional manufacturers are emerging to reduce reliance on imports and tailor flavors to Mexican preferences, they still depend on U.S. and global sources for specialty ingredients like oat milk and unique proteins. Additionally, U.S. cultural influences, particularly through social media and travel, are accelerating plant-based adoption among Mexico's younger demographic.
Although Canada and other North American regions account for smaller market shares, they are experiencing steady growth, supported by regulatory initiatives and demographic diversity. Canada's 2024 Bill C-293 strengthened the framework for plant-based foods, highlighting the government's commitment to alternative proteins and reducing regulatory uncertainties for manufacturers. In alignment with the FDA's approach, the Canadian Food Inspection Agency (CFIA) now permits plant-based products to use dairy terminology, provided there is a clear plant-source identifier. Urban centers such as Toronto, Vancouver, and Montreal are leading in adoption, driven by their multicultural populations and progressive food cultures. However, rural areas lag behind due to limited retail access and lower household incomes. Odd Burger's 2024 expansion into over 500 7-Eleven Canada outlets demonstrates the potential of convenience-store distribution, particularly in regions where traditional grocery stores allocate minimal freezer space to plant-based products.
Competitive Landscape
The North American non-dairy ice cream market is highly fragmented, with no single player holding a dominant share. Legacy dairy companies such as Unilever Plc, Danone SA, and Froneri International Limited. compete against specialized plant-based brands and artisanal players. These incumbents utilize their distribution networks, co-manufacturing capabilities, and brand equity to launch plant-based product lines under established names like Breyers and Häagen-Dazs. This approach reduces consumer hesitation and encourages product trials. On the other hand, specialized brands like Oatly, NadaMoo!, and Van Leeuwen differentiate themselves with clean-label products, direct-to-consumer strategies, and sustainability-focused practices. They target affluent, health-conscious consumers who value ingredient transparency and ethical sourcing, even at premium prices. Precision fermentation technologies, developed by companies like Perfect Day and licensed to partners such as Coolhaus, mark a significant turning point. These technologies produce animal-free whey proteins that replicate dairy functionality, enabling brands to offer "real ice cream" sensory qualities while maintaining a vegan identity. This innovation challenges both traditional dairy products and first-generation plant-based alternatives, which often rely on nut, oat, or coconut bases that have limitations in texture and shelf life.
The non-dairy ice cream market is driven by intense product innovation and strategic expansion efforts from key players. Companies are not only introducing new flavors but also enhancing existing formulations to meet the growing demand for healthier options. They demonstrate operational flexibility by investing in research and manufacturing facilities, allowing them to respond quickly to market needs. Strategic initiatives include partnerships with packaging providers and the expansion of distribution channels, particularly in online retail and specialty stores. Sustainability is a core focus, influencing ingredient sourcing and eco-friendly packaging solutions. Growth strategies include both organic expansion and strategic collaborations. The competitive landscape emphasizes differentiation through functionality, ingredient quality, and environmentally conscious packaging designs. Major players in this market include Unilever Plc, Danone SA, Froneri International Limited, Oatly Group AB, and Oregon Ice Cream Company.
Opportunities in the market lie in rural distribution, value-tier products, and functional formulations. Convenience-store placements, such as Klimon's rollout in 7-Eleven and Odd Burger's expansion in Canada, capitalize on impulse purchases in areas underserved by natural-food retailers. Value-tier products priced closer to traditional dairy could drive mass-market adoption, though achieving cost parity requires economies of scale and ingredient innovation, which remain challenges for many players. Functional formulations, including high-protein, low-sugar, and probiotic-enriched options, address specific consumer needs and command premium pricing to offset higher ingredient costs. These products target fitness enthusiasts and consumers focused on gut health. Emerging disruptors, such as regional manufacturers in Mexico and smaller U.S. markets, tailor their offerings to local preferences by customizing flavors and pricing. By bypassing national distribution requirements and fostering community connections through direct sales, these players are building strong customer loyalty.
North America Non-dairy Ice Cream Industry Leaders
-
Danone SA
-
Oatly Group AB
-
Oregon Ice Cream Company
-
Unilever Plc
-
Froneri International Limited
- *Disclaimer: Major Players sorted in no particular order

Recent Industry Developments
- October 2025: Heritage Foods has strategically acquired a 51% stake in Get-A-Way, a health-focused ice cream brand. This move signifies Heritage Foods' efforts to diversify its portfolio by expanding from traditional dairy products into functional food categories.
- December 2024: Flora Professional introduced a versatile plant-based ice cream mix, designed to meet various dietary preferences while maintaining exceptional taste.
- September 2024: Eclipse Foods has introduced Eclipse Bonbons, a new line of plant-based ice cream bonbons, in the US. Developed by an award-winning chef, these non-dairy treats are designed to deliver the creamy texture and rich flavors of traditional ice cream.


North America Non-dairy Ice Cream Market Report Scope
| Standard Ice Cream |
| Novelties |
| Soft Serve |
| Specialty/Artisanal Ice Cream |
| Pints |
| Tubs |
| Sticks |
| Others |
| On-trade | |
| Off-trade | Convenience Stores |
| Specialist Retailers | |
| Supermarkets and Hypermarkets | |
| On-line Retail | |
| Others (Warehouse clubs, gas stations, etc.) |
| United States |
| Canada |
| Mexico |
| Rest of North America |
| Product Type | Standard Ice Cream | |
| Novelties | ||
| Soft Serve | ||
| Specialty/Artisanal Ice Cream | ||
| Packaging Type | Pints | |
| Tubs | ||
| Sticks | ||
| Others | ||
| Distribution Channel | On-trade | |
| Off-trade | Convenience Stores | |
| Specialist Retailers | ||
| Supermarkets and Hypermarkets | ||
| On-line Retail | ||
| Others (Warehouse clubs, gas stations, etc.) | ||
| Conutry | United States | |
| Canada | ||
| Mexico | ||
| Rest of North America | ||


Market Definition
- Dairy Alternatives - Dairy alternatives are foods that are made from plant-based milk/oils instead of their usual animal products, such as cheese, butter, milk, ice cream, yogurt, etc. Plant-based or non-dairy milk alternative is the fast-growing segment in the newer food product development category of functional and specialty beverage across the globe.
- Non-Dairy Butter - Non dairy butter is a vegan butter alternative that is made from a mixture of plant oils. With an increase in alternative diets like vegetarianism, veganism, and gluten intolerance, plant butter is a healthy non-dairy substitute for normal butter.
- Non-Dairy Ice Cream - Plant based ice cream is a growing category. Non-dairy ice cream is a type of dessert made without any animal ingredients. This is typically considered a substitute for regular ice cream for those who cannot or do not eat animal or animal-derived products, including eggs, milk, cream, or honey.
- Plant-Based Milk - Plant based milks are milk substitutes that are made from nuts (e.g., hazelnuts, hemp seeds), seeds (e.g., sesame, walnuts, coconuts, cashews, almonds, rice, oats, etc.) or legumes (e.g., soy). Plant-based milk such as soy milk and almond milk have been popular in East Asia and the Middle East for centuries.
| Keyword | Definition |
|---|---|
| Cultured Butter | Cultured butter is prepared by having the raw butter go through chemical processing and has been added with certain emulsifiers and foreign ingredients. |
| Uncultured Butter | This type of butter is one which has not been processed in any way |
| Natural Cheese | The type of cheese in its most natural form. It is made from natural and simple products and ingredients, including fresh and natural salts, natural colors, enzymes, and high-quality milk. |
| Processed Cheese | Processed cheese undergoes the same processes as natural cheese; however, it requires more steps and many different forms of ingredients. Making processed cheese involves melting natural cheese, emulsifying it, and adding preservatives and other artificial ingredients or colorings. |
| Single Cream | Single cream contains around 18% fat. It’s a single layer of cream that appears over boiled milk. |
| Double Cream | Double cream contains 48% fat, more than double the amount of fat of single cream. It’s heavier and thicker than single cream |
| Whipping Cream | This has a much higher fat percentage than single cream (36%). Used to top cakes, pies, and puddings and as a thickener for sauces, soups, and fillings. |
| Frozen Desserts | Desserts that are meant to be eaten in frozen condition. E.g., sherbets, sorbets, frozen yogurts |
| UHT Milk (Ultra-high temperature milk) | Milk heated at a very high temperature. Ultra-high-temperature processing (UHT) of milk involves heating for 1–8 sec at 135–154°C. which kills the spore-forming pathogenic microorganism, resulting in a product with a shelf-life of several months. |
| Non-dairy butter/Plant-based butter | Butter made from plant-derived oil such as coconut, palm, etc. |
| Non-dairy Yogurt | Yogurt made from typically made from nuts, like almonds, cashews, coconuts, and even other foods like soybeans, plantains, oats, and peas |
| On-trade | It refers to restaurants, QSRs, and bars. |
| Off-trade | It refers to supermarkets, hypermarkets, on-line channels, etc. |
| Neufchatel cheese | One of the oldest kinds of cheese in France. It is a soft, slightly crumbly, mold-ripened, bloomy-rind cheese made in the Neufchâtel-en-Bray region of Normandy. |
| Flexitarian | It refers to a consumer preferring a semi-vegetarian diet, that is centered on plant foods with limited or occasional inclusion of meat. |
| Lactose Intolerance | Lactose intolerance is a reaction in digestive system to lactose, the sugar in milk. It causes uncomfortable symptoms in response to the consumption of dairy products. |
| Cream Cheese | Cream cheese is a soft and creamy fresh cheese with a tangy taste made from milk and cream. |
| Sorbets | Sorbet is a frozen dessert made using ice combined with fruit juice, fruit purée, or other ingredients, such as wine, liqueur, or honey. |
| Sherbet | Sherbet is a sweetened frozen dessert made with fruit and some sort of dairy product such as milk or cream. |
| Shelf stable | Foods that can be safely stored at room temperature, or "on the shelf," for at least one year and do not have to be cooked or refrigerated to eat safely. |
| DSD | Direct Store Delivery is the process in supply chain management wherein the product is delivered from manufacturing plant directly to the retailer. |
| OU Kosher | Orthodox Union Kosher is a kosher certification agency based in New York City. |
| Gelato | Gelato is a frozen creamy dessert made with milk, heavy cream and sugar. |
| Grass-fed Cows | Grass-fed cows are allowed to graze in pastures, where they eat a variety of grasses and clover. |


Research Methodology
Mordor Intelligence follows a four-step methodology in all our reports.
- Step-1: Identify Key Variables: In order to build a robust forecasting methodology, the variables and factors identified in Step 1 are tested against available historical market numbers. Through an iterative process, the variables required for market forecast are set, and the model is built on the basis of these variables.
- Step-2: Build a Market Model: Market-size estimations for the forecast years are in nominal terms. Inflation is not a part of the pricing, and the average selling price (ASP) is kept constant throughout the forecast period for each country.
- Step-3: Validate and Finalize: In this important step, all market numbers, variables, and analyst calls are validated through an extensive network of primary research experts from the market studied. The respondents are selected across levels and functions to generate a holistic picture of the market studied.
- Step-4: Research Outputs: Syndicated Reports, Custom Consulting Assignments, Databases & Subscription Platforms


