Positron Emission Tomography (PET) Market Size and Share
Market Overview
| Study Period | 2020 - 2031 |
|---|---|
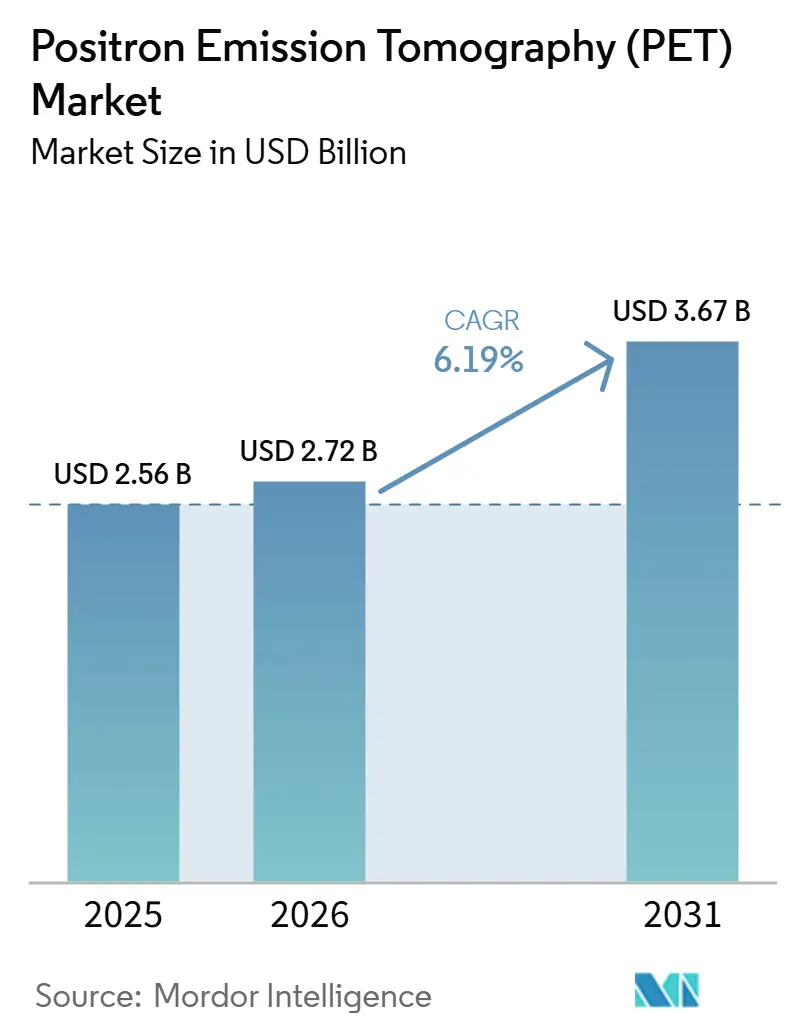
| Market Size (2026) | USD 2.72 Billion |
| Market Size (2031) | USD 3.67 Billion |
| Growth Rate (2026 - 2031) | 6.19% CAGR |
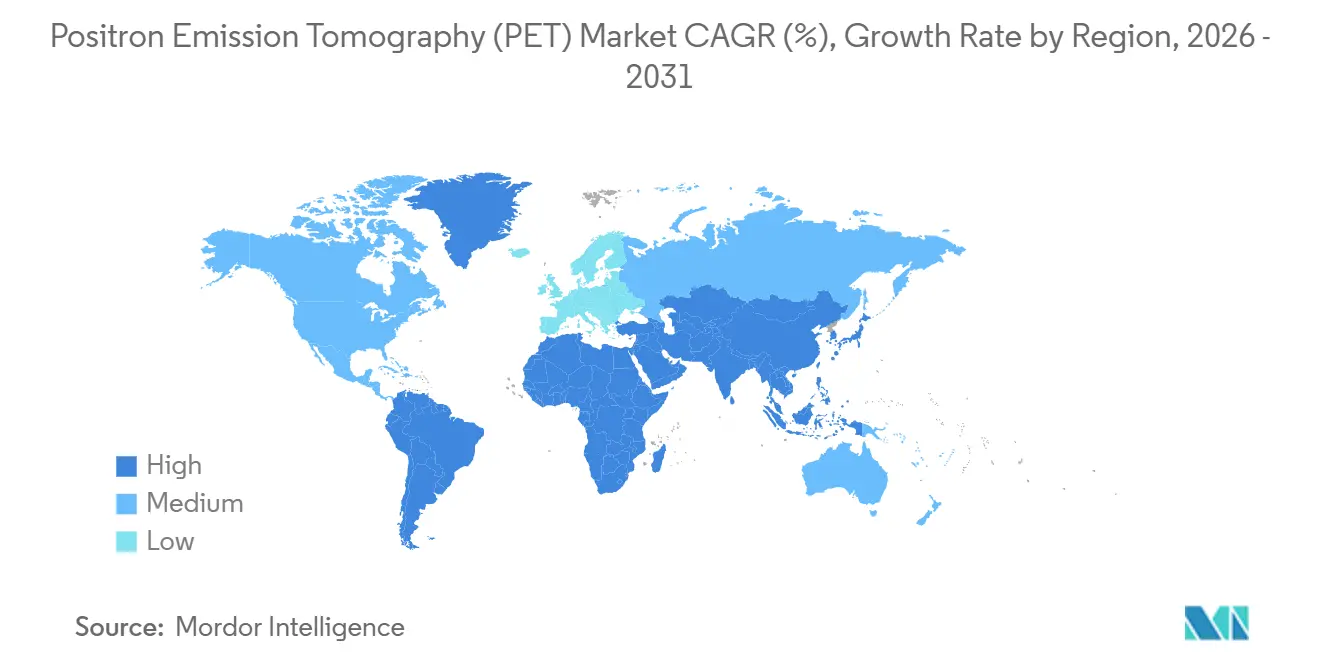
| Fastest Growing Market | Asia Pacific |
| Largest Market | North America |
| Market Concentration | High |
Major Players *Disclaimer: Major Players sorted in no particular order Image © Mordor Intelligence. Reuse requires attribution under CC BY 4.0. | |
Positron Emission Tomography (PET) Market Analysis by Mordor Intelligence
The Positron Emission Tomography Market size was valued at USD 2.56 billion in 2025 and is estimated to grow from USD 2.72 billion in 2026 to reach USD 3.67 billion by 2031, at a CAGR of 6.19% during the forecast period (2026-2031).
Momentum comes from silicon photomultiplier detectors that cut scan time by 40%, total-body platforms that allow ultra-low radiation doses, and artificial-intelligence reconstruction software that shortens acquisitions to fewer than 10 minutes while keeping diagnostic accuracy intact. Oncology commands more than two-thirds of current demand, but neurology imaging is accelerating as Medicare now reimburses amyloid and tau protocols in Alzheimer’s assessment. Detector replacement cycles favor digital architectures that achieve time-of-flight resolution below 300 picoseconds, and hybrid PET/MRI demand is rising within neuroscience and cardiac centers as practitioners seek soft-tissue contrast unavailable in CT fusion. Regionally, North America dominates revenue, yet Asia-Pacific shows the fastest expansion because China and India are funding hundreds of new scanners through 2027.
Key Report Takeaways
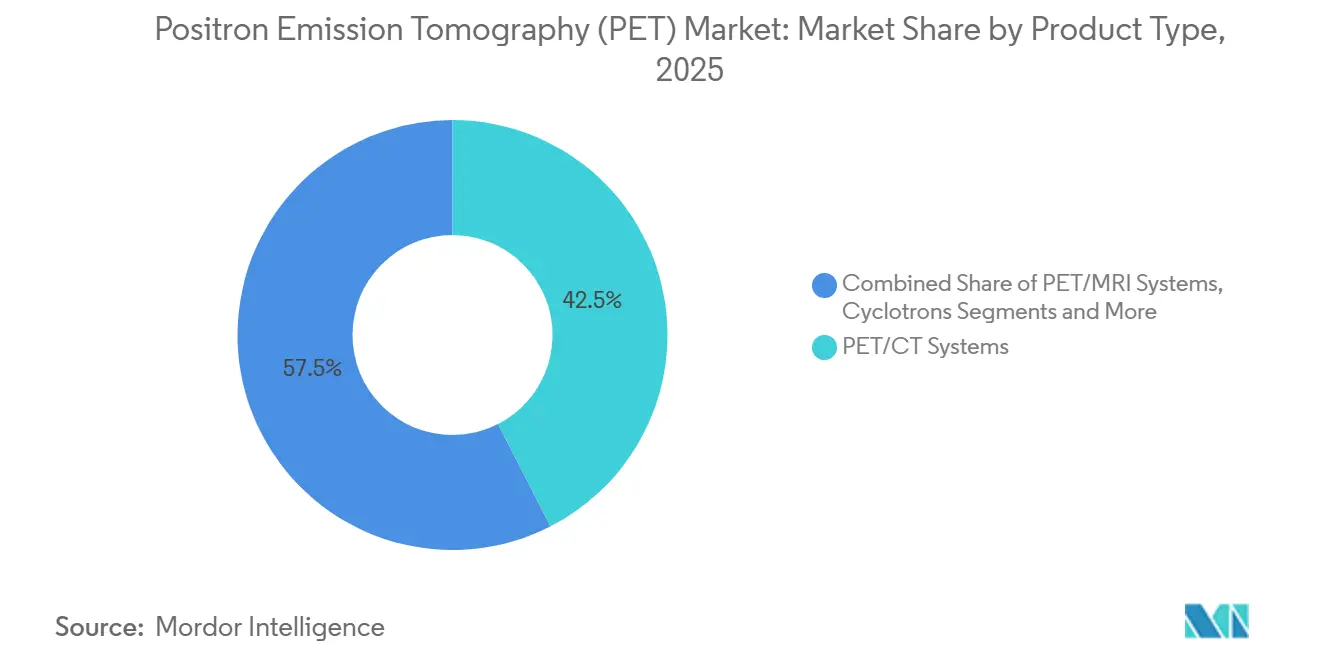
- By product type, PET/CT systems led with 42.46% revenue share in 2025, while PET/MRI platforms are forecast to expand at a 10.62% CAGR through 2031.
- By detector technology, photomultiplier tubes captured 56.24% of 2025 shipments, whereas silicon photomultipliers are projected to grow at a 9.67% CAGR to 2031.
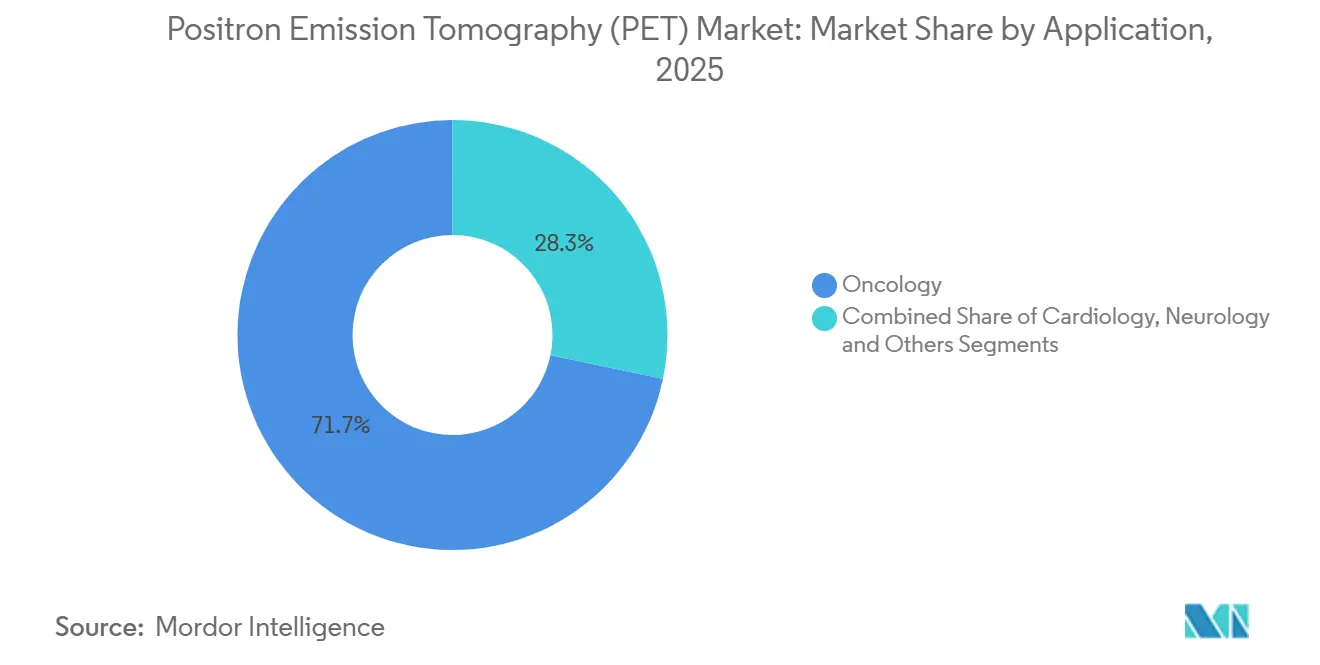
- By application, oncology accounted for 71.74% of scan volume in 2025, and neurology imaging is advancing at an 8.52% CAGR through 2031.
- By end user, hospitals and clinics held 64.27% of 2025 demand, while research institutes are expected to rise at a 9.41% CAGR over the forecast period.
- By geography, North America commanded 42.83% of 2025 revenue, and Asia-Pacific is poised to register the fastest regional growth at an 8.41% CAGR to 2031.
Note: Market size and forecast figures in this report are generated using Mordor Intelligence’s proprietary estimation framework, updated with the latest available data and insights as of January 2026.
Global Positron Emission Tomography (PET) Market Trends and Insights
Driver Impact Analysis*
| Driver | (~) % Impact on CAGR Forecast | Geographic Relevance | Impact Timeline |
|---|---|---|---|
| Rising prevalence of oncology cases | 1.8% | Global, with concentration in North America, Europe, and urban Asia-Pacific | Long term (≥ 4 years) |
| Rapid shift toward fully-digital PET detectors | 1.5% | North America & Europe early adoption, Asia-Pacific following by 2027-2028 | Medium term (2-4 years) |
| Growing uptake of hybrid PET/CT and PET/MRI platforms | 1.2% | North America & Europe for PET/MRI, Asia-Pacific for PET/CT expansion | Medium term (2-4 years) |
| Expanding reimbursement coverage in OECD countries | 1.0% | OECD countries, particularly US Medicare and European national health systems | Short term (≤ 2 years) |
| Commercialisation of total-body PET enabling ultra-low-dose imaging | 0.9% | North America academic centers, selective European and Chinese institutions | Long term (≥ 4 years) |
| AI-enabled image reconstruction reducing scan time & cost | 0.7% | Global, with faster uptake in digitally mature North American and European markets | Medium term (2-4 years) |
| Source: Mordor Intelligence | |||
Rising Prevalence of Oncology Cases
Cancer diagnoses in the United States are expected to reach 2.05 million in 2025, up 3.2% from 2024.[1]American Cancer Society, “Cancer Statistics, 2025,” cancer.org Globally, new cases could hit 28 million by 2040 as populations age and smoking persists in parts of Southeast Asia.[2]World Health Organization, “GLOBOCAN 2022,” gco.iarc.fr PET imaging supports both staging and response monitoring, especially for immunotherapy where metabolic activity changes precede anatomical shrinkage. Oncology already delivers 71.74% of scan volume, yet limited reimbursement for routine surveillance restrains growth potential. U.S. data show lung-cancer staging PET uptake at 87%, but post-therapy surveillance only at 34%, leaving significant untapped revenue.
Rapid Shift Toward Fully-Digital PET Detectors
Silicon photomultiplier modules powered 44% of new system installs in 2025, an increase from 31% two years earlier.[3]Siemens Healthineers, “Biograph Vision Quadra Total-Body PET/CT,” siemens-healthineers.com Timing resolution below 250 picoseconds doubles signal-to-noise ratio, enabling 40% faster workflows or 50% lower tracer doses. GE HealthCare’s Discovery MI Gen 2 and Canon Medical’s Cartesion Prime exemplify this performance leap. Hospitals can now schedule 12 daily scans rather than 8 on legacy systems, improving equipment utilization by one-third. Manufacturing scale remains a hurdle, since SiPM detectors cost 25% more than photomultiplier tubes, but a new Shanghai fabrication plant promises price parity within three years.
Commercialisation of Total-Body PET Enabling Ultra-Low-Dose Imaging
Total-body scanners with fields of view over 100 centimeters entered practice in 2024 at UC Davis and the University of Pennsylvania. Doses as low as 1 MBq/kg now support pediatric and longitudinal studies that were once radiation limited. Siemens’s Biograph Vision Quadra logged 18 placements in 2025, and United Imaging’s uEXPLORER added 12 more, chiefly in China. Capital outlay exceeds USD 5 million per unit, and existing reimbursement codes do not reward full-body coverage, confining uptake to research centers. Nevertheless, evidence from oncology trials is expected to spur future value-based billing that will broaden adoption.
AI-Enabled Image Reconstruction Reducing Scan Time and Cost
FDA cleared deep-learning PET reconstruction tools from Canon, GE, and Siemens between 2024 and 2025. Trained neural networks allow diagnostic images from five-minute acquisitions, cutting technologist labor and increasing throughput by roughly one-third. Yet only 28% of U.S. centers had deployed AI reconstruction by 2025 because of integration hurdles and radiologist skepticism. Cloud-hosted inference promises to lower IT barriers, while professional-society validation guidelines aim to build clinician trust. The broader benefit may prove to be ultra-low-dose protocols that expand eligibility to children and pregnant patients.
Restraints Impact Analysis*
| Restraint | (~) % Impact on CAGR Forecast | Geographic Relevance | Impact Timeline |
|---|---|---|---|
| High capital & maintenance costs of PET systems | -1.2% | Global, with acute impact in emerging markets and rural regions | Long term (≥ 4 years) |
| Radio-isotope (18F-FDG) supply chain vulnerability | -0.9% | Global, with concentration risk in North America and Europe cyclotron networks | Medium term (2-4 years) |
| Limited 68Ge/68Ga generator production capacity | -0.6% | Global, affecting theranostics and PSMA imaging adoption | Long term (≥ 4 years) |
| Data-governance hurdles for AI-driven diagnostics | -0.4% | North America & Europe under HIPAA and GDPR; Asia-Pacific emerging | Short term (≤ 2 years) |
| Source: Mordor Intelligence | |||
High Capital and Maintenance Costs of PET Systems
Digital PET/CT systems average USD 3.8 million while PET/MRI exceeds USD 4.5 million, and annual service contracts can top USD 300,000. India, for instance, operated only 142 scanners in 2025, equivalent to 0.1 units per million residents, compared with 5.2 in the United States. To manage cost, hospitals extend equipment life to 12 years and favor software subscriptions rather than full replacements, a trend that suppresses new-system volume but fuels aftermarket revenue.
Radio-Isotope 18F-FDG Supply-Chain Vulnerability
The tracer’s 110-minute half-life requires cyclotron proximity, yet networks are concentrated in 12 OECD nations. Outages in 2024 and 2025 forced thousands of canceled scans and highlighted dependence on single suppliers. Companies are investing in distributed mini-cyclotrons and on-site generators, but widespread deployment will take several years, keeping supply risk on the radar.
*Our forecasts treat driver/restraint impacts as directional, not additive. The impact forecasts reflect baseline growth, mix effects, and variable interactions.
Segment Analysis
By Product Type: PET/MRI Systems Lead Growth Despite PET/CT Dominance
PET/CT systems generated 42.46% of 2025 revenue, underscoring their oncology foothold and favorable reimbursement. Still, PET/MRI platforms will rise at a 10.62% CAGR through 2031 because neurology and cardiac clinicians value MRI soft-tissue contrast. Siemens logged 34 Biograph mMR installs in 2025, and GE placed 22 SIGNA PET/MR units, mostly in neuroscience centers. Software and services rose 12.3% during 2025, reflecting the industry’s pivot to subscription models that spread cost across operating budgets. Regulatory momentum from CMS proposals for differentiated hybrid-imaging codes could lift the positron emission tomography market size for PET/MRI beyond this baseline.
Second-tier modalities maintain niche roles. Stand-alone PET caters to radiochemistry labs, while cyclotron sales follow local isotope demand. North America added eight medical cyclotrons in 2025, and China installed fourteen to meet its expanding positron emission tomography market capacity.


By Detector Technology: Silicon Photomultipliers Displace Legacy PMT Systems
Photomultiplier tubes still held 56.24% of revenue in 2025 because of a large installed base and a USD 500,000 price advantage per system. Silicon photomultipliers are forecast to grow 9.67% annually to 2031 due to 40% faster scans and 2-fold lesion detectability gains. Clinical trials comparing United Imaging’s uMI Panorama to PMT systems reported 94% sensitivity for sub-centimeter liver lesions versus 76% on older technology. Hospitals therefore plan upgrades once detector costs fall, a scenario likely by 2028 as automotive-scale manufacturing drives economies of scale. Lower injected dose requirements, meanwhile, stretch each radiopharmaceutical batch across more patients, partially easing isotope bottlenecks.
By Application: Neurology Imaging Gains Momentum as Oncology Matures
Oncology remains the backbone at 71.74% of scan volume, yet neurology’s 8.52% CAGR through 2031 positions it as the fastest-growing segment. FDA approval of tau tracer flortaucipir and CMS reimbursement for amyloid imaging have lifted Alzheimer’s PET demand. Each patient may receive three to four scans over 18 months, raising utilization intensity beyond simple volume counts. Cardiology gained 6.8% in 2025, though rubidium-82 reimbursement limits wider adoption. Other emerging uses such as infection or brown adipose tissue research rose 9.1%, hinting at future diversification of the positron emission tomography market.
By End User: Research Institutes Drive Innovation While Hospitals Dominate Volume
Hospitals and clinics held 64.27% of 2025 demand, backed by large insured populations and capital budgets near USD 8 million per facility. Research institutes will expand at 9.41% CAGR as pharmaceutical firms employ PET in 42% of Phase II oncology trials to accelerate decision making. Total-body systems at the University of Pennsylvania and Stanford underline NIH investment in precision medicine. Diagnostic imaging centers, which grew 5.9% in 2025, face shrinking margins after a 3.2% CMS fee cut, curbing their appetite for high-ticket PET/MRI units.
Geography Analysis
North America captured 42.83% of 2025 revenue, supported by 1,740 installed scanners and comprehensive Medicare coverage. The region’s 5.8% forecast CAGR lags the global rate because new installations give way to digital replacements. Outcome-based codes introduced in 2024 already encourage upgrades to SiPM and AI-ready platforms. Canada added fourteen scanners in 2025, while Mexico’s private hospitals installed six units, indicating modest secondary-market expansion.
Asia-Pacific is set to grow at 8.41% CAGR through 2031, driven by China’s goal of 500 new scanners in tier-2 cities by 2027 and India’s USD 120 million diagnostic-infrastructure allocation. United Imaging captured 52% of China’s 2025 installs with competitively priced systems. Japan’s aging population fuels neurology scans, and South Korea’s cancer-screening program maintains oncology demand. India’s limited cyclotron network remains a bottleneck, restraining rural access despite government funding. Australia’s quartet of PET/MRI installs positions it as a neuroscience hub within the region.
In Europe, Germany’s 187-scanner base underpins its oncology capacity, and France added twelve units focused on theranostics research. The United Kingdom installed six scanners in 2025 but earmarked GBP 200 million for imaging by 2027, signaling faster growth ahead. EU medical-device rules add six to twelve months of approval time for AI software, damping early adoption. Middle East & Africa and South America together show incremental growth, led by GCC private-hospital demand and eight new systems in Brazil’s São Paulo corridor.

Competitive Landscape
The positron emission tomography industry has a high concentration. Siemens and GE focus on premium digital platforms and subscription-based software, while United Imaging pursues aggressive pricing outside of China. Patent filings show Siemens prioritizing detector timing and motion correction, with fourteen applications in 2024-2025, and GE emphasizing cloud reconstruction in eleven filings. Niche players address specialized needs, as Cubresa released a USD 800,000 breast PET system in 2025.
Radiopharmaceutical firms like Blue Earth Diagnostics and Telix Pharmaceuticals blur traditional boundaries by integrating tracer development with imaging services. Software entrants such as SOFIE Biosciences received FDA clearance for AI reconstruction that competes with OEM offerings. Chinese vendors plan global expansion; United Imaging submitted its first U.S. 510(k) in 2025 and entered European markets, signaling tougher price competition ahead.
Positron Emission Tomography (PET) Industry Leaders
Siemens Healthineers
GE HealthCare
Koninklijke Philips N.V.
Canon Medical Systems
United Imaging Healthcare
- *Disclaimer: Major Players sorted in no particular order


Recent Industry Developments
- November 2025: GE HealthCare received CE Mark for its Omni 128 cm total-body PET/CT system, enhancing precision oncology imaging.
- June 2025: Telix gained Italian authorization for Illuccix gallium-68 PSMA agent, broadening access to prostate-cancer PET.
- June 2025: S L Raheja Hospital in Mumbai launched AI-enabled digital PET/CT alongside 3 T MRI, elevating pediatric diagnostics.
- March 2025: Jordan opened its first public-hospital nuclear-medicine center with IAEA support, adding PET/CT capacity to oncology care.


Research Methodology Framework and Report Scope
Market Definitions and Key Coverage
Mordor Intelligence defines the positron emission tomography (PET) market as all new, factory-built imaging systems in which annihilation photons from positron-emitting radiotracers are detected to create three-dimensional functional maps used mainly in oncology, cardiology, neurology, and drug research.
Scope exclusion: Service revenues (scan fees, cyclotron operations) and refurbished or hybrid add-on detectors are not counted.
Segmentation Overview
- By Product Type
- Stand-alone PET Systems
- PET/CT Systems
- PET/MRI Systems
- Cyclotrons
- Software & Services
- By Detector Technology
- Photomultiplier Tube (PMT)
- Silicon Photomultiplier (SiPM)
- By Application
- Oncology
- Cardiology
- Neurology
- Others
- By End User
- Hospitals & Clinics
- Diagnostic Imaging Centres
- Research Institutes
- By Geography
- North America
- United States
- Canada
- Mexico
- Europe
- Germany
- France
- United Kingdom
- Italy
- Spain
- Rest of Europe
- Asia-Pacific
- China
- Japan
- India
- South Korea
- Australia
- Rest of Asia-Pacific
- Middle East & Africa
- GCC
- South Africa
- Rest of Middle East & Africa
- South America
- Brazil
- Argentina
- Rest of South America
- North America
Detailed Research Methodology and Data Validation
Primary Research
Mordor analysts interviewed radiologists, nuclear pharmacists, medical-device distributors, and hospital capital-budget managers across North America, Europe, and key Asia-Pacific economies.
Conversations clarified real-world scanner throughput, average selling prices (ASP), tracer shelf-life losses, and reimbursement shifts, which were then matched back to desk findings to refine model assumptions.
Desk Research
Our analysts started with open datasets such as FDA 510(k) clearances, United Nations Comtrade isotope shipment codes, OECD health-expenditure tables, and cancer incidence files from GLOBOCAN.
Industry bodies, Society of Nuclear Medicine & Molecular Imaging, European Association of Nuclear Medicine, and the International Atomic Energy Agency provided equipment stock, tracer demand, and guideline updates.
Company 10-Ks, investor decks, and peer-reviewed papers on time-of-flight PET gave insight into price dispersion and utilization.
Paid repositories (D&B Hoovers for vendor financials and Dow Jones Factiva for deal screening) rounded out hard-to-source metrics.
The list above is illustrative; many additional public and subscription sources were consulted to cross-check signals.
Market-Sizing & Forecasting
A top-down build began with installed-base counts and average replacement cycles, which are then multiplied by region-specific ASPs to reconstruct annual hardware demand.
Selective bottom-up checks, supplier roll-ups and sampled tender prices, validated totals.
Core drivers in the model include (1) annual PET scan volumes, (2) share of hybrid PET/CT versus PET/MRI, (3) prevalence of oncology indications requiring serial imaging, (4) radiopharmaceutical production capacity, and (5) capital-budget elasticity to GDP per capita growth.
Five-year projections use multivariate regression blended with ARIMA to capture cyclical procurement lags, with coefficient inputs vetted during expert calls.
Where bottom-up gaps appeared, regional ASPs were interpolated from nearest tender data before final triangulation.
Data Validation & Update Cycle
Before sign-off, outputs are stress-tested against import values for detector crystals and cyclotron installations.
Variances beyond a set threshold trigger a second analyst review and, if needed, rapid re-contact of domain experts.
The report is refreshed annually, and material events, major tracer approvals or disruptive scanner launches, prompt an interim update so clients always receive the freshest view.
Why Mordor's Positron Emission Tomography Market Baseline Commands Reliability
Published estimates often vary because firms choose different hardware mixes, apply unvetted ASP ladders, or freeze exchange rates months in advance.
Our disciplined scope selection, rolling currency updates, and dual-path validation make the Mordor baseline a steadier compass for strategic decisions.
Benchmark comparison
| Market Size | Anonymized source | Primary gap driver |
|---|---|---|
| USD 1.13 B (2025) | Mordor Intelligence | - |
| USD 2.72 B (2024) | Global Consultancy A | Includes service revenues and refurbished units; ASP sourced from list prices without discount factoring |
| USD 2.50 B (2023) | Trade Journal B | Relies on shipment volumes only, omits PET/MRI, fixed 2023 exchange rates |
In sum, deviations stem chiefly from broader scope choices, older base years, or single-source inputs. By combining validated public datasets, targeted field interviews, and continuous model tuning, Mordor delivers a transparent, reproducible baseline that decision-makers can trust.


Key Questions Answered in the Report
How large is the positron emission tomography market in 2026?
It is valued at USD 2.72 billion in 2026, with a projected CAGR of 6.19% to 2031.
Which modality is growing fastest within the positron emission tomography market?
PET/MRI platforms are expanding at a 10.62% CAGR due to neurology and cardiac demand.
What factor limits positron emission tomography adoption in emerging economies?
High capital and maintenance costs, often exceeding USD 3 million per system, constrain uptake.
Why are silicon photomultipliers important to the positron emission tomography market?
They enable 40% shorter scans and 50% lower tracer doses, driving a 9.67% forecast growth rate.
Which geographic region is expected to grow quickest?
Asia-Pacific is forecast to expand at 8.41% CAGR, propelled by large-scale deployments in China and India.
How are vendors shifting their revenue models?
Market leaders now bundle AI reconstruction and analytics as subscriptions, creating recurring revenue streams.
Page last updated on:


