Market Overview
| Study Period | 2020 - 2031 |
|---|---|
| Forecast Data Period | 2026 - 2031 |
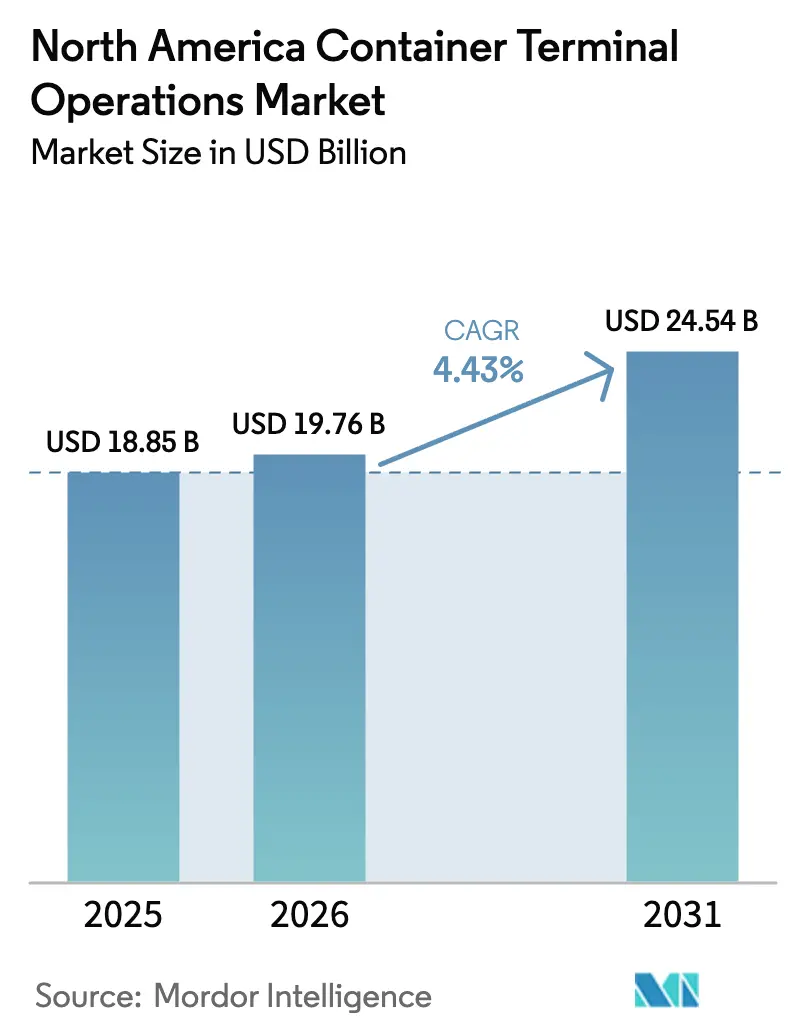
| Base Year Market Size (2025) | USD 18.85 Billion |
| Market Size (2026) | USD 19.76 Billion |
| Market Size (2031) | USD 24.54 Billion |
| Growth Rate (2026 - 2031) | 4.43% CAGR |
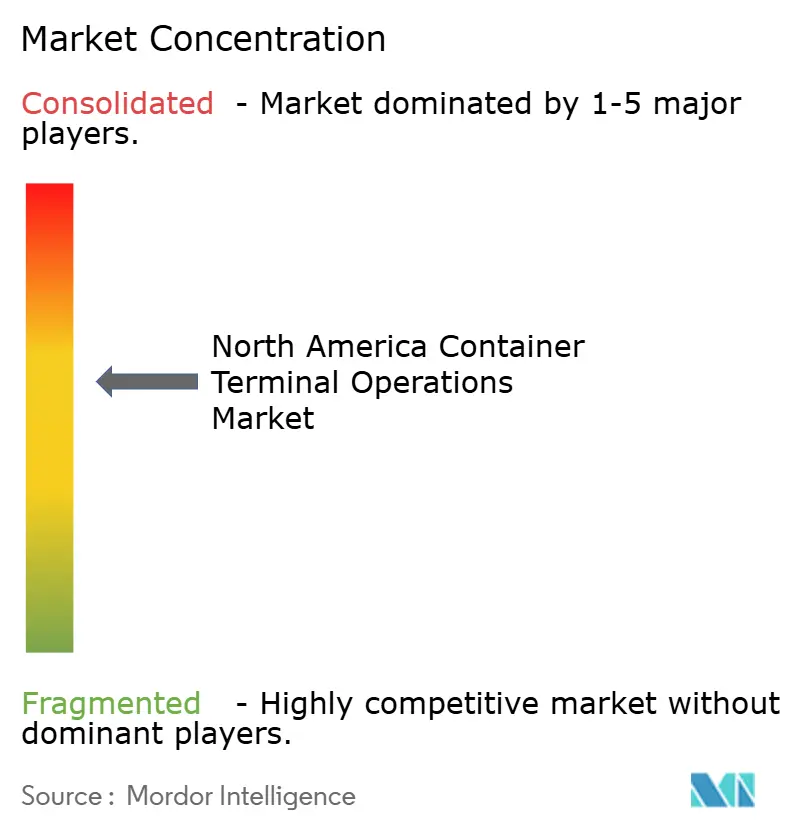
| Market Concentration | Medium |
Major Players *Disclaimer: Major Players sorted in no particular order Image © Mordor Intelligence. Reuse requires attribution under CC BY 4.0. | |
North America Container Terminal Operations Market Analysis by Mordor Intelligence
The North America Container Terminal Operations Market size is projected to expand from USD 18.85 billion in 2025 and USD 19.76 billion in 2026 to USD 24.54 billion by 2031, registering a CAGR of 4.43% between 2026 to 2031. Structural shifts in trade geography linked to USMCA provisions are diverting manufacturing investment toward Mexico and the southern United States, redirecting container routing that once favored West-Coast gateways. Rapid deployment of LNG and shore-power infrastructure is attracting ultra-large vessels that demand reliable green-fuel bunkering, while digital port-community platforms are cutting vessel turnaround and gate cycles by 15-20% through real-time data exchange. Private-equity funds injected more than USD 2 billion into brownfield terminal upgrades during 2024-2025, accelerating capacity additions without new land acquisition. Climate-risk insurance premiums and cybersecurity spending, however, are putting upward pressure on operating costs, challenging terminals to balance resilience investments with productivity gains.
Key Report Takeaways
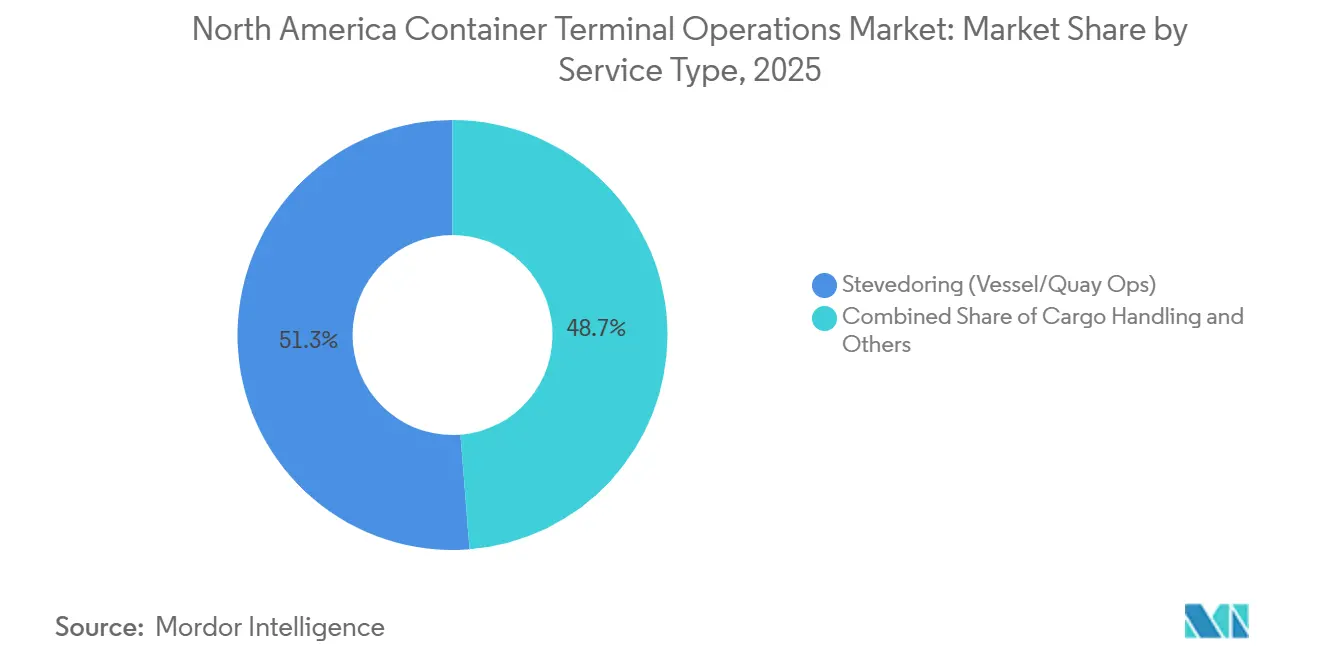
- By service, stevedoring led with 51.26% of the North America container terminal operations market share in 2025; transportation is forecast to expand at a 5.14% CAGR through 2031.
- By ownership model, public-private partnerships held 45.10% share in 2025, while private/independent operators are advancing at a 5.25% CAGR to 2031.
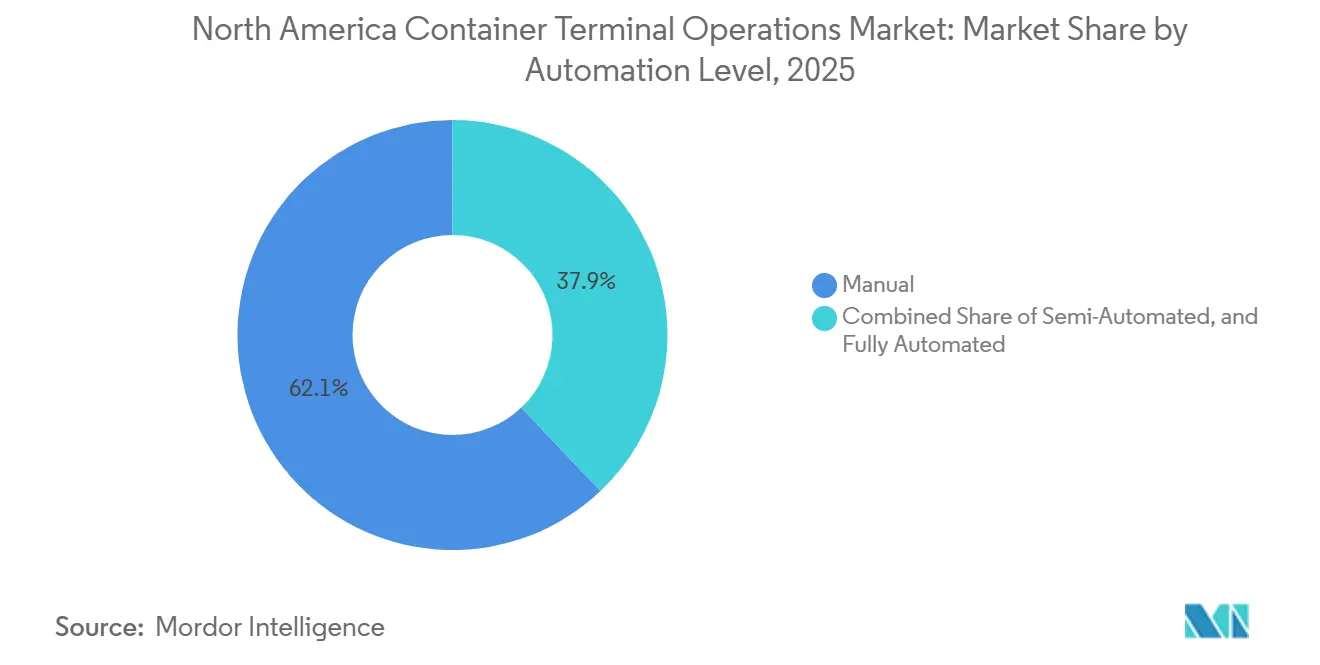
- By automation level, manual facilities commanded 62.09% share of the North America container terminal operations market size in 2025, yet fully automated terminals are growing at a 5.71% CAGR over the forecast period.
- By container type, general containers retained 75.11% share in 2025, and reefers are projected to rise at a 5.03% CAGR to 2031.
- By geography, the United States accounted for 87.40% market share in 2025; Mexico is the fastest-growing country with a 5.19% CAGR between 2026-2031.
Note: Market size and forecast figures in this report are generated using Mordor Intelligence’s proprietary estimation framework, updated with the latest available data and insights as of 2026.
North America Container Terminal Operations Market Trends and Insights
Drivers Impact Analysis*
| Driver | (~) % Impact on CAGR Forecast | Geographic Relevance | Impact Timeline |
|---|---|---|---|
| LNG-bunkering & green-fuel hub development | +0.8% | US Gulf Coast, Canadian Atlantic, select Pacific terminals | Medium term (2-4 years) |
| USMCA-driven surge in intra-regional TEU flows | +1.1% | US-Mexico border crossings, Gulf Coast US, Mexican coasts | Short term (≤ 2 years) |
| Digitized port-community systems | +0.7% | Tier-1 US & Canadian terminals | Medium term (2-4 years) |
| Rising reefer demand from pharma & produce | +0.6% | US East Coast, Canadian Atlantic, Mexican Pacific | Medium term (2-4 years) |
| East-coast demographic boom | +0.9% | US East & Gulf Coast | Short term (≤ 2 years) |
| Private-equity capital inflow | +0.5% | United States & Canada | Long term (≥ 4 years) |
| Source: Mordor Intelligence | |||
LNG-Bunkering & Green-Fuel Hub Development
Green-fuel readiness is redrawing service networks as shipping lines preferentially call at terminals that can supply LNG today and methanol or ammonia tomorrow. The Port of Long Beach commissioned North America’s first shoreside LNG bunkering station in 2024 and immediately secured multi-year calls from dual-fuel vessels operated by CMA CGM and Hapag-Lloyd. Halifax and Vancouver replicate the model on transatlantic routes, leveraging federal incentives to co-finance shore-power systems that lower carrier emissions scores and lock in volume guarantees. Although methanol and ammonia remain pilot fuels, carriers are already negotiating five-year throughput agreements contingent on future supply availability. Terminals able to demonstrate certified low-carbon operations therefore capture both environmental premiums and network stickiness, underpinning long-term capacity expansion plans.
USMCA-Driven Surge in Intra-Regional TEU Flows
USMCA provisions have boosted containerized trade among the United States, Mexico, and Canada by 31% since 2020, pushing intra-regional volumes to 22% of all North American TEU moves. Automotive and electronics shippers increasingly consolidate exports through Mexican Pacific ports, with Lazaro Cardenas handling 1.8 million TEU in 2024, an 18% increase year on year. On-dock rail corridors connecting Monterrey suppliers to Texas distribution hubs now run at near-capacity, pushing terminals with seamless rail interfaces to premium pricing tiers. The shift benefits the North America container terminal operations market by layering customs brokerage, cross-docking, and last-mile delivery revenues onto basic stevedoring, lifting per-box margins 20-30%[1]U.S. Census Bureau, “U.S.–Mexico Trade Statistics 2024,” census.gov
Digitized Port-Community Systems
Cloud-based port-community systems synchronize terminal operating software with trucking fleets and customs platforms, reducing gate transactions from roughly 50 minutes to under 20 minutes at early-adopter facilities. The Port of Los Angeles’ Port Optimizer processed 1.2 million truck moves each month in 2025 while cutting average dwell time by 22 minutes. Blockchain bill-of-lading tools deployed at Port Newark and Savannah eliminate 80% of paperwork, freeing berth capacity equivalent to 15-20% of physical expansion. Such gains create durable competitive moats: carriers reshuffle port rotations in favor of the quickest turn, and trucking firms steer freight toward gates that guarantee predictable slots, thereby reinforcing digital leaders’ throughput growth.
Exploding Reefer Demand from Pharma & Produce
Persistent vaccine logistics and biologics shipments have institutionalized ocean reefer corridors that were temporary during the pandemic. Pharmaceuticals alone lifted reefer penetration at East-Coast terminals to 13% of total boxes in 2025 versus 9% in 2020. Latin American berry and avocado suppliers add 380,000 TEU of ambient-controlled cargo annually, triggering USD 150-200 million waves of plug-point investments such as Port Everglades’ capacity doubling to 2,400 outlets. Because reefer handling fees are 40–60% above dry-box rates, the segment meaningfully lifts terminal EBITDA, although rising grid tariffs are prompting solar and battery retrofits to tame energy costs.
Restraints Impact Analysis*
| Restraint | (~) % Impact on CAGR Forecast | Geographic Relevance | Impact Timeline |
|---|---|---|---|
| Truck-chassis shortages & driver scarcity | -0.7% | United States & Canada | Short term (≤ 2 years) |
| Rising climate-risk insurance premiums | -0.5% | US Gulf & East Coast, Canadian Atlantic | Medium term (2-4 years) |
| Cybersecurity breaches & ransomware | -0.4% | Global | Medium term (2-4 years) |
| Geopolitical trade frictions | -0.6% | Global, asymmetric across gateways | Short term (≤ 2 years) |
| Source: Mordor Intelligence | |||
Chronic Truck-Chassis Shortages & Driver Scarcity
Chassis pools are operating at 92-96% utilization against an optimal 85%, extending box dwell by up to two days at the largest terminals. The American Trucking Associations estimates a 78,000-driver deficit in drayage, with turnover exceeding 90% because wait-time penalties depress earnings. Gray-pool inefficiencies compound the issue as empty equipment accumulates at import-heavy ports, starving export locations. Terminals experimenting with chassis reservations and 24/7 gates see marginal relief, yet OEM backlogs of 12-18 months imply multi-year scarcity. Facilities with captive chassis fleets, therefore, secure volume at competitors’ expense[2]American Trucking Associations, “Driver Shortage Update,” trucking.org.
Rising Climate-Risk Insurance Premiums
Hurricane Idalia inflicted USD 3.6 billion of port damage in 2023, jolting underwriters to lift deductibles and premiums 25-40% for Gulf and Atlantic terminals. Business-interruption cover now costs over 2% of insured value annually in FEMA flood zones, eroding investment budgets available for automation. Resilience projects seawalls, pump stations, and elevated substations add 8-12% to capex without increasing throughput, forcing operators to recalibrate ROI hurdles versus lower-risk regions.
*Our forecasts treat driver/restraint impacts as directional, not additive. The impact forecasts reflect baseline growth, mix effects, and variable interactions.
Segment Analysis
By Service: Transportation Extends Margin Capture
Transportation services are the fastest-expanding slice of the North America container terminal operations market, advancing at 5.14% CAGR as operators integrate rail, drayage, and trans-loading functions to secure revenue beyond quay cranes. Stevedoring still generated 51.26% of North America container terminal operations market share in 2025, reflecting its foundational role, yet integrated logistics yields higher EBITDA per TEU. Mexican facilities capture a disproportionate share as nearshored plants require cross-border last-mile services at premium rates.
Traditional cargo-handling and ancillary services face margin compression from automation that lowers labor inputs. Terminals consequently bundle value-added tasks, customs brokerage, e-seal verification, and hazardous-materials oversight to preserve pricing power. Logistics integration also insulates earnings from vessel-call fluctuations by anchoring inland revenue streams that track domestic consumption rather than global trade cycles. As e-commerce retailers seek single-handshake supply-chain partners, transportation-centric terminals gain negotiating leverage to secure long-term contracts, reinforcing network stickiness and supporting incremental investment in automation.


By Ownership Model: Private Capital Accelerates Modernization
Public-private partnerships account for 45.10% of the North America container terminal operations market size in 2025, but private/independent operators are expanding fastest, clocking a 5.25% CAGR. Brookfield’s Ports America stake typifies the thesis: stable cash flows indexed to CPI, embedded real-estate value, and operational upside make terminals attractive to infra funds. Private owners push performance levers, dynamic gate pricing, extended operating windows, and incentive-based labor contracts, raising crane productivity 15-25% within two years.
State-owned terminals maintain strategic assets but confront budget ceilings and political scrutiny that delay capex decisions. Public facilities are responding via hybrid models that concession operations while retaining land control, but must still match private peers’ digital and environmental benchmarks to preserve carrier calls.
By Automation Level: Fully Automated Terminals Gain Traction
Although manual facilities still handle 62.09% of the North America container terminal operations market share in 2025, fully automated sites are scaling at a 5.71% CAGR. Automation lifts moves per crane hour from roughly 28 to over 40, enabling 24/7 throughput unconstrained by shift patterns. West-Coast terminals exploit more permissive labor contracts to advance automated guided vehicles and rail-mounted gantries, while ILA agreements restrict full automation on the East Coast until 2030, creating regional performance gaps.
Hybrid semi-automated models remain viable for mid-volume ports that lack the density to justify end-to-end automation yet still gain efficiency by automating stacks and gates. Cybersecurity risk, however, scales with automation intensity, mandating parallel investment in OT network hardening.
By Container Type: Reefers Command Revenue Premiums
General containers still dominate at 75.11% of the North America container terminal operations market share in 2025, but reefers’ 5.03% CAGR reflects structural gains from pharmaceuticals and year-round produce imports.
Project cargo and dangerous-goods boxes remain niche yet strategic, enabling terminals to diversify revenue and utilize underserved berths. Dangerous-goods handling also differentiates operators able to comply with strict IMDG requirements, attracting high-margin clients in chemicals and renewable-energy components.
Geography Analysis
United States gateways held 87.40% of 2025 throughput, but internal shifts favor East and Gulf Coasts over Pacific hubs. Gulf terminals such as Houston post 10-12% annual gains on rising Mexican nearshore cargo, although chassis bottlenecks and climate-risk insurance temper profitability.
Canadian terminals leverage green shipping corridors to Europe. Halifax’s LNG and shore-power installations target carriers seeking lower-carbon transatlantic loops, while Vancouver retains 3.7 million TEU despite labor unrest by emphasizing intermodal rail reach to the prairies. Arctic-route speculation remains long-term, yet early ice-class infrastructure bolsters Canada’s strategic relevance[3]Port of Vancouver, “2024 Throughput Report,” portvancouver.com.
Mexico is the fastest-growing sub-region with a 5.19% CAGR. Manzanillo’s USD 3 billion expansion to 10 million TEU by 2030 and the Tehuantepec rail corridor could reposition Mexico as both an origin and a transshipment hub. Security and inland connectivity challenges persist, but policy support and private concessions attract global operators eyeing a first-mover advantage.
Competitive Landscape
Four major global operators, APM Terminals, DP World, PSA International, and Hutchison Ports, control around 60% of North America’s port capacity through leases and joint ventures. This means a few big players dominate the market, though competition still exists. These companies are expanding beyond just moving containers by investing in related services. For example, DP World bought logistics firm Syncreon, and APM is building more on-dock rail connections to move cargo faster and more efficiently.
Technology is also becoming a key factor in how ports compete. Software providers like Navis and Tideworks, along with cybersecurity firms, help ports run smoothly and protect their systems. Having strong digital tools and secure operations is now essential, not optional[4]DP World, “Syncreon Acquisition Closes,” dpworld.com
Private equity investors are adding pressure by putting in heavy investments to modernize ports and get quick returns. Brookfield’s plan with Ports America shows this approach; they’re upgrading 16 terminals with electric cranes, automated gates, and better chassis management to achieve 12-15% returns. Smaller regional ports are staying competitive by focusing on specialized areas like pharmaceutical cold-chain handling, hazardous cargo management, and project cargo services.
North America Container Terminal Operations Industry Leaders
Ports America
SSA Marine
DP World
APM Terminals (Maersk)
Terminal Investment Limited (TIL) (Part of MSC Group)
- *Disclaimer: Major Players sorted in no particular order

Recent Industry Developments
- March 2026: DP World reported strong growth at its Saint John terminal in Canada following modernization investments. The company highlighted that upgrades in berth capacity, yard utilization, and intermodal connectivity significantly improved operational efficiency and attracted new shipping services.
- February 2026: APM Terminals agreed to temporarily operate Balboa terminal (Panama) during a government-led transition after Hutchison’s concession was terminated. The move ensures continuity of operations at one of the most strategic transshipment hubs in the Americas.
- May 2025: DP World announced a USD 2.5 billion global investment plan aimed at expanding logistics and port infrastructure across multiple regions. The initiative reflects a long-term strategy to integrate ports with inland logistics and strengthen global trade corridors.
- April 2025: APM Terminals acquired the Panama Canal Railway Company, a critical logistics asset connecting Atlantic and Pacific ports. This acquisition enhances intermodal capabilities and allows the company to offer end-to-end container transport solutions across the Panama isthmus.


North America Container Terminal Operations Market Report Scope
By Service
| Stevedoring (Vessel/Quay Ops) |
| Cargo Handling |
| Transportation |
| Other Services |
By Ownership Model
| State-Owned |
| Public-Private Partnership |
| Private / Independent |
By Automation Level
| Manual |
| Semi-Automated |
| Fully Automated |
By Container Type
| General |
| Reefer |
| OOG / Project |
| Dangerous Goods (DG) |
By Geography
| United States |
| Canada |
| Mexico |
| By Service | Stevedoring (Vessel/Quay Ops) |
| Cargo Handling | |
| Transportation | |
| Other Services | |
| By Ownership Model | State-Owned |
| Public-Private Partnership | |
| Private / Independent | |
| By Automation Level | Manual |
| Semi-Automated | |
| Fully Automated | |
| By Container Type | General |
| Reefer | |
| OOG / Project | |
| Dangerous Goods (DG) | |
| By Geography | United States |
| Canada | |
| Mexico |


Key Questions Answered in the Report
How large will the North America container terminal operations market be by 2031?
It is projected to reach USD 24.54 billion by 2031, growing at a 4.43% CAGR from 2026-2031.
Which country is expanding fastest in container terminal operations across North America?
Mexico is forecast to post a 5.19% CAGR through 2031, supported by nearshoring and port expansion programs.
What service category is growing quickest for terminal operators?
Transportation services, including on-dock rail, drayage and trans-loading are advancing at a 5.14% CAGR as terminals capture inland logistics margins.
How are environmental regulations influencing terminal investments?
Carriers favor ports with LNG bunkering and shore power, prompting multi-hundred-million-dollar green-fuel infrastructure builds that secure long-term service contracts.
What are the biggest operational risks facing terminals today?
Chassis shortages, cybersecurity threats and escalating climate-risk insurance premiums collectively pressure operating costs and throughput reliability.
What factors drive Mexico’s rapid terminal growth?
Near-shoring manufacturing, capacity expansion at Manzanillo, and improved rail corridors position Mexico for a 3.98% CAGR.
Page last updated on:


