North America Chewing Gum Market Size and Share
Market Overview
| Study Period | 2021 - 2031 |
|---|---|
| Forecast Data Period | 2026 - 2031 |
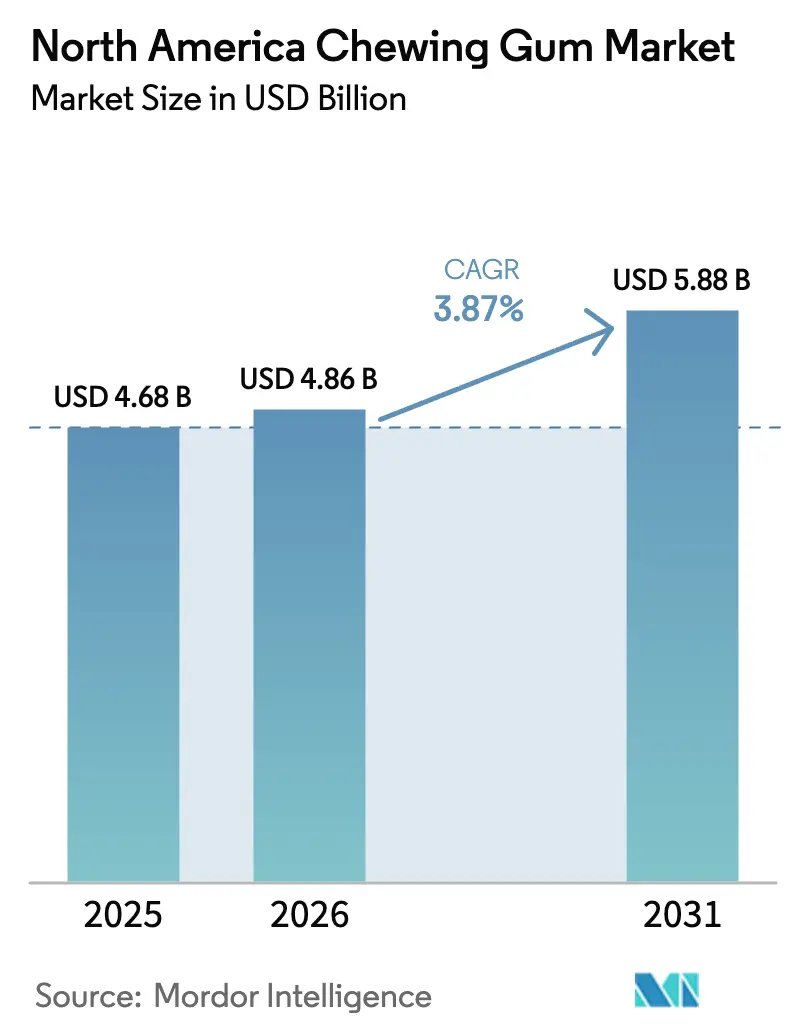
| Base Year Market Size (2025) | USD 4.68 Billion |
| Market Size (2026) | USD 4.86 Billion |
| Market Size (2031) | USD 5.88 Billion |
| Growth Rate (2026 - 2031) | 3.87% CAGR |
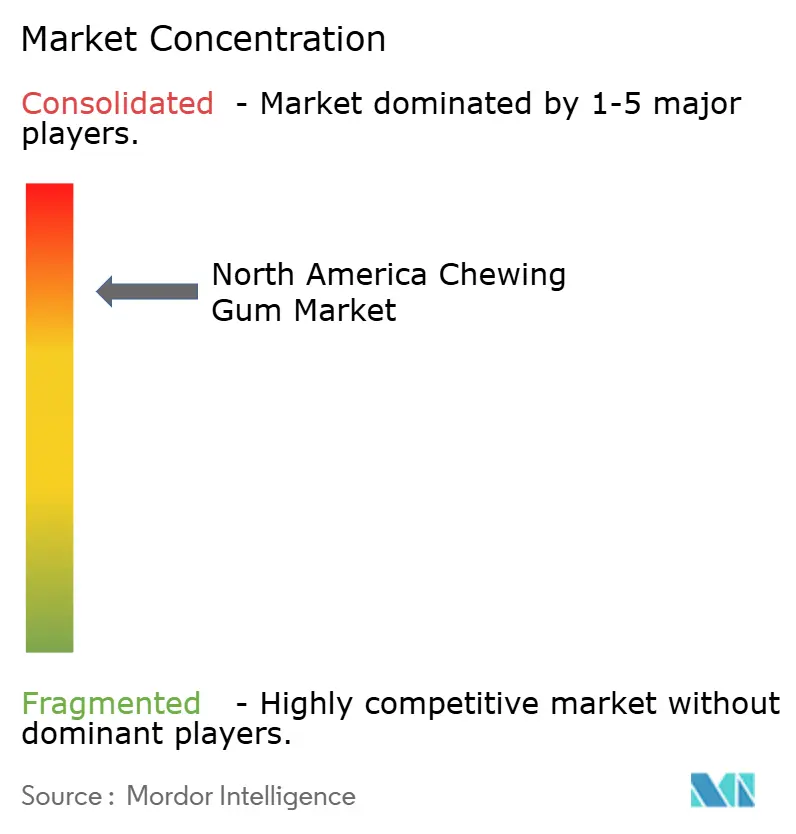
| Market Concentration | High |
Major Players*Disclaimer: Major Players sorted in no particular order Image © Mordor Intelligence. Reuse requires attribution under CC BY 4.0. | |
North America Chewing Gum Market Analysis by Mordor Intelligence
The North America chewing gum market size was valued at USD 4.68 billion in 2025 and estimated to grow from USD 4.86 billion in 2026 to reach USD 5.88 billion by 2031, at a CAGR of 3.87% during the forecast period (2026-2031). While the gum market sees steady growth, a notable shift is underway. Consumers are moving away from low-margin impulse buys, gravitating instead towards premium, functional, and eco-friendly options. These choices cater to a more health-conscious audience. As a result, offerings like sugar-free, vitamin-fortified, and botanical gums are pushing up average selling prices. This trend persists even amidst a decline in unit volumes, enabling major manufacturers to uphold their profitability through a strategy of premiumization. Meanwhile, the dynamics of distribution are evolving. Digital channels, subscription services, and prompts from food delivery upsells are reshaping the landscape. Traditional front-end impulse sales are waning, especially with the rise of self-checkout lanes. This shift compels brands to rebrand gum, positioning it as a deliberate wellness product rather than just a quick breath freshener. On the regulatory front, challenges arise with petroleum-based gum bases and plastic blister packs. Yet, there are also positive developments, like Health Canada's endorsement of xylitol claims and the 21 CFR 172.615 green light for chicle. These factors are collectively guiding reformulation efforts towards biodegradable and clean-label solutions.
Key Report Takeaways
- By product type, sugar chewing gum held 56.53% of the North America chewing gum market share in 2025, while sugar-free variants are forecast to expand at a 7.88% CAGR through 2031.
- By form, stick formats commanded 40.80% of the North America chewing gum market size in 2025, yet dragee gum is projected to record the fastest 6.69% CAGR to 2031.
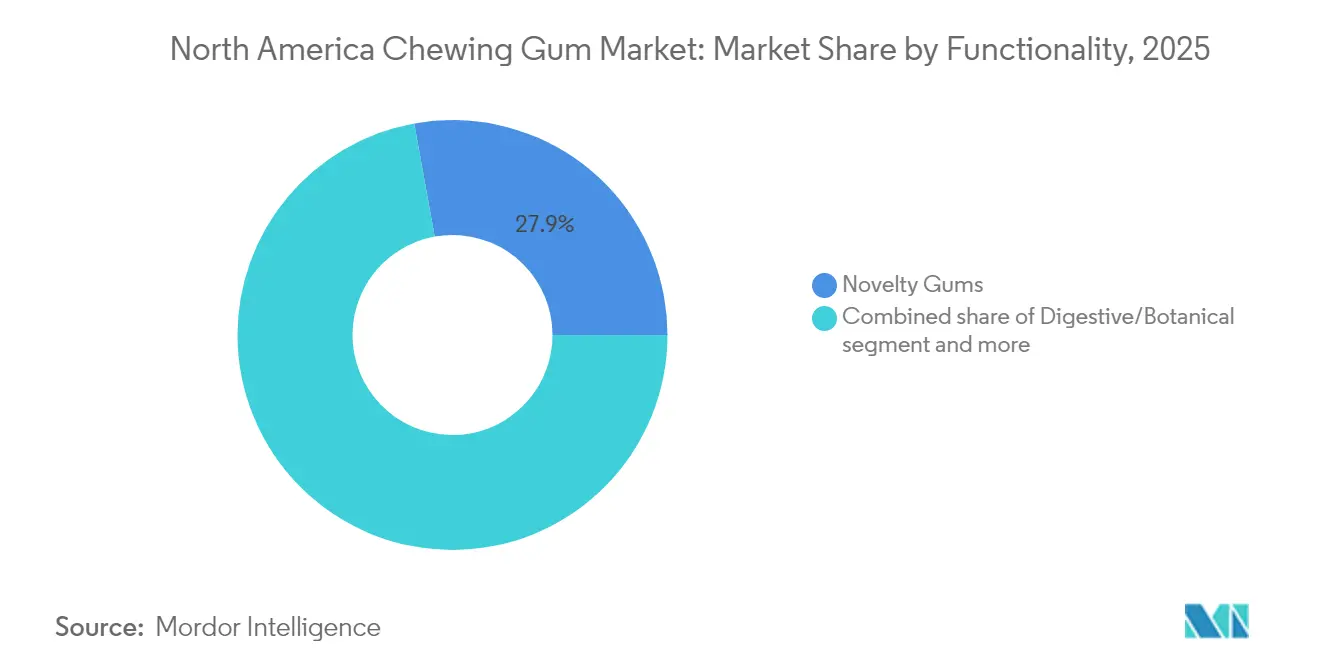
- By functionality, novelty gum occupied 27.85% revenue share in 2025, whereas digestive and botanical formulations are set to grow at a 8.78% CAGR between 2026 and 2031.
- By distribution channel, supermarkets and hypermarkets accounted for 46.05% of 2025 sales, but e-commerce is anticipated to post a 5.56% CAGR over the forecast horizon.
- Geographically, the United States generated 67.63% of 2025 revenue and Mexico is positioned for the strongest 6.08% CAGR through 2031.
Note: Market size and forecast figures in this report are generated using Mordor Intelligence’s proprietary estimation framework, updated with the latest available data and insights as of 2026.
North America Chewing Gum Market Trends and Insights
Drivers Impact Analysis*
| Driver | (~) % Impact on CAGR Forecast | Geographic Relevance | Impact Timeline |
|---|---|---|---|
| Premium and functional gum | +1.2% | United States, Canada, Mexico urban areas | Medium term (2-4 years) |
| Premium retail shelf space and private labels | +0.6% | United States, Canada | Short term (≤2 years) |
| Sugar-free gum aligned with dental campaigns | +0.9% | Region-wide | Long term (≥4 years) |
| CBD/hemp-infused formulations | +0.5% | United States state markets | Medium term (2-4 years) |
| Corporate wellness snack kits | +0.3% | U.S. corporate hubs, Canada | Short term (≤2 years) |
| Biodegradable gum-base regulation | +0.4% | Canada, United States, Mexico | Long term (≥4 years) |
| Source: Mordor Intelligence | |||


Demand for premium and functional gum
Across North America's chewing gum market, product pipelines are now spotlighting functional formulations that promise stress relief, cognitive support, and digestive balance. Notable examples include Mars Wrigley's "Respawn" by 5 gum, NeuroGum's nootropic blend, and Sweet Victory's gymnemic-acid infusion, showcasing the differentiation through ingredients like caffeine, L-theanine, and other botanical actives. These formulations cater to the growing consumer demand for products that offer both convenience and health benefits. This shift is underscored by price elasticity: while average pack prices have risen, dollar growth hasn't stalled, underscoring consumers' readiness to invest in these multi-benefit chews. Furthermore, with pharmaceutical-grade delivery formats from Fertin Pharma and postbiotic inclusions from ADM, the line between confectionery and nutraceutical science blurs, positioning gum as more than just a treat. This convergence highlights the industry's focus on innovation, aiming to meet the evolving preferences of health-conscious consumers.
Premium retail shelf space and push for private labels
Retailers are now focusing on high-velocity SKUs and in-house labels, pushing legacy brands to innovate and amp up promotions to retain shelf space. Studies from Hershey reveal that a strategic front-end redesign can recover 34% of impulse losses, even at self-checkouts, where traditional impulse buying behavior is often diminished. This highlights the premium real estate's significance for participants in North America's chewing gum market, as it directly impacts visibility and sales performance. Leveraging retailer loyalty data, private-label gums are introducing cleaner, sugar-free variants that cater to health-conscious consumers. These products not only undercut branded prices but also maintain trade margins, ensuring profitability for retailers. The PUR Company’s sales surge of 80.6% in 2024 underscores that emphasizing xylitol purity and sustainability can outpace the scale advantages of established players, demonstrating the growing consumer preference for innovative and eco-friendly options.
Sugar-free gum aligned with dental health campaigns
In North America's chewing gum market, sugar-free gum has gained significant traction in mainstream oral-care routines, largely due to institutional endorsements. Brands flaunting the American Dental Association's Seal of Acceptance or leveraging Health Canada's caries-reduction endorsement enjoy a substantial credibility boost, particularly among parents seeking healthier options for their children and older adults prioritizing oral health. Marketing narratives are further strengthened by systematic reviews that highlight a reduction in dental caries associated with xylitol use. This scientific backing allows manufacturers to position their products at premium price points, surpassing standard gum offerings. As a result, the market is witnessing a surge in xylitol-based product launches, which effectively combine oral-health benefits with innovative fruit or mint flavor profiles, catering to evolving consumer preferences.
Legalization of CBD/hemp-infused gum
Despite ongoing federal uncertainties, amendments to the 2024 Farm Bill hint at a potential green light for non-intoxicating, hemp-derived ingredients in food products. This development bolsters research and development investments in cannabinoid-infused gums, as companies aim to capitalize on the growing consumer interest in functional and wellness-oriented products. Pioneering companies are strategically positioning their discreet, workplace-friendly gums as viable alternatives to traditional tinctures and vapes, catering to consumers seeking convenience and subtlety. They're banking on forthcoming FDA guidelines to pave the way for national distribution, which could significantly expand market access. Should these functional claims receive the nod of approval, CBD-infused gum stands poised to carve out a significant premium niche in the expansive North American chewing gum market, offering a unique value proposition within the broader functional food segment.
Restraints Impact Analysis*
| Restraint | (~) % Impact on CAGR Forecast | Geographic Relevance | Impact Timeline |
|---|---|---|---|
| Decline of impulse buys at grocers | -0.8% | U.S., Canada high self-checkout chains | Short term (≤2 years) |
| Synthetic rubber cost inflation | -0.5% | Region-wide | Medium term (2-4 years) |
| Plastic-waste regulations for blister packs | -0.4% | Canada, Mexico, United States | Long term (≥4 years) |
| Rising jaw-related disorders | -0.3% | Region-wide aging cohort | Long term (≥4 years) |
| Source: Mordor Intelligence | |||
Decline of impulse buys at large grocers
In North America, the chewing gum market has taken a significant hit as stores transitioning to self-checkout experience a noticeable decline in front-end impulse sales. This drop is primarily due to the reduced visibility of chewing gum and other impulse items at checkout counters, which have traditionally been key drivers of unplanned purchases. To counteract this trend, manufacturers are increasingly investing in digital merchandising strategies, forming partnerships with convenience stores, and launching occasion-driven campaigns like “Chew You Good” to encourage planned purchases and sustain consumer interest. Additionally, queue redesigns and interactive displays are being explored as potential solutions to recapture some of the lost sales volume by improving product visibility and engaging customers. However, the adoption of these measures varies significantly based on individual retailers' budgets and labor strategies, which influence their ability to implement such initiatives effectively.
Inflation in synthetic rubber raw materials
Producers of conventional gum bases, heavily reliant on petroleum-based polymers like polyisobutylene, find themselves vulnerable to the fluctuations of crude oil prices. As input costs rise, they tighten margins in sensitive market segments, accelerating the industry's pivot towards natural chicle and bio-based elastomers, both of which are already approved under 21 CFR 172.615. Natural chicle, derived from the sap of the sapodilla tree, offers a renewable and biodegradable alternative, aligning with the growing consumer demand for sustainable products. While companies leveraging chicle enjoy the twin benefits of cost stability and sustainability, they still face significant research and development investments to match the desired chew texture and flavor release, which are critical for maintaining consumer satisfaction and market competitiveness.
*Our forecasts treat driver/restraint impacts as directional, not additive. The impact forecasts reflect baseline growth, mix effects, and variable interactions.
Segment Analysis
By Product Type: Sugar-Free Variants Redefine Category Growth
In 2025, sugar-based chewing gum commanded a leading 56.53% share of North America's chewing gum market, primarily appealing to price-sensitive and nostalgic consumers. Yet, a consistent dip in its unit volumes hints at a dwindling everyday user base. In response, Manufacturers therefore confine sugar variants to seasonal flavors or novelty limited editions that rely on social media virality rather than day-to-day usage. These limited-edition offerings often target specific occasions or holidays, aiming to create a sense of urgency and exclusivity among consumers. While sugar gum still finds favor in value packs around USD 1.20, it grapples with rising health and wellness concerns, as more consumers shift towards healthier alternatives.
On the other hand, the sugar-free chewing gum sector is on a rapid ascent, boasting an estimated CAGR of 7.88%. This growth is largely attributed to the increasing recognition of xylitol’s dental advantages, such as its ability to reduce cavity-causing bacteria. Brands are pushing boundaries, infusing sugar-free gums with vitamins, botanicals, probiotics, and mood-enhancers like B-vitamins and chromium picolinate, resulting in premium products fetching up to USD 4.00. These innovations not only cater to health-conscious consumers but also tap into the growing demand for functional foods that offer additional benefits beyond basic nutrition. Industry giants like Mars Wrigley, Perfetti Van Melle, and PUR are ramping up ingredient collaborations, aligning with the health-conscious trend. This shift towards premiumization highlights the segment's robust momentum in North America's chewing gum landscape.


By Form: Soft-Chew Formats Disrupt Traditional Stick Dominance
In 2025, stick gum dominated the North American chewing gum market, making up 40.80% of the region's sales. Its stronghold is bolstered by established merchandising racks and a familiar presence, especially among older consumers. While stick gum enjoys this dominance, it's increasingly marketed as a value option, frequently sold in multipacks. This strategy targets not just price-sensitive consumers but also institutional buyers, including the military and travel retailers. The segment's nostalgic charm and traditional consumption habits are evident, yet it grapples with competition from newer formats that emphasize convenience and a variety of textures.
Dragee and cube gum formats are set to lead the growth trajectory, boasting a projected CAGR of 6.69%. These formats cater to contemporary consumers who prioritize shareability, resealability, and diverse textures in their chewing experience. Products like Ice Breakers Ice Cubes and Orbit Refreshers, housed in resealable tubs, not only offer portability and portion control but also resonate with adults experiencing jaw fatigue. Innovations such as liquid-center capsules and flavor-shifting beads prolong the chewing pleasure, extending beyond the usual initial burst of flavor. Additionally, packaging innovations, like PET canisters featuring QR codes, promote recycling and tackle sustainability issues. These evolving trends suggest that soft-chew and cube gums might soon eclipse the traditional stick gum's allure, especially among the younger demographic.
By Functionality: Digestive and Botanical Formulations Lead Innovation
In 2025, novelty gum dominates the North American chewing gum market, holding a 27.85% market share. Traditionally bolstered by heritage brands and impulse buys, this segment now grapples with margin pressures. As consumers increasingly favor gums with health benefits over mere flavor, brands like Perfetti Van Melle adapt. They've begun infusing functional claims into established flavors, like Mentos and Smint, to cater to the wellness-driven market. These functional claims often include the addition of vitamins, minerals, and adaptogens, which appeal to consumers seeking products that offer more than just taste. While novelty gum's strong branding and habitual use keep it in the limelight, shifting consumer preferences necessitate continuous innovation to sustain its market position and relevance.
Digestive and botanical gum is on a rapid ascent, projected to grow at an impressive CAGR of 8.78% until 2031. This segment capitalizes on innovations like TopGum’s Gummiotics, which quantify probiotic and prebiotic contents, underscoring gut-health benefits. Gums fortified with probiotics, vitamins, and adaptogens not only focus on gut health but also emphasize cognitive performance, stress management, and appetite control, allowing them to command premium prices. These formulations are often developed using advanced bioactive delivery technologies to ensure efficacy and appeal to health-conscious consumers. Typically launched in smaller batches, these health-centric formulations find their way to consumers through e-commerce and specialty retail channels, resonating with those in search of multifunctional snacks. The segment's growth underscores gum's transformation into a bioactive delivery platform in North America, reflecting the increasing consumer demand for innovative and health-oriented products.
By Distribution Channel: E-Commerce Gains as Impulse Channels Weaken
In 2025, supermarkets and hypermarkets dominated the North American chewing gum market, accounting for roughly 46.05% of the total turnover. These retail channels, with their vast physical presence, have always been easily accessible to consumers. However, they're now navigating challenges, notably the rising trend of self-checkout systems. These systems, while efficient, have diminished the traditional impulse purchases that often occur at front-end counters. Large retail chains not only offer a diverse range of products but also employ discounting strategies and loyalty programs, solidifying their market dominance. Their ability to provide immediate product availability and a trusted assortment resonates with a wide consumer base, both in urban centers and suburban locales.
Online retail is emerging as the fastest-growing segment, boasting a projected CAGR of around 5.56% through 2031. This digital channel is reshaping how consumers shop, with planned replenishment purchases slowly overtaking spontaneous buys. Platforms like Amazon, along with brand-specific websites, are capitalizing on this trend by offering subscription bundles. These bundles not only ensure automatic refills for consumers but also boost the customer lifetime value and help suppliers manage seasonality. Meanwhile, direct-to-consumer startups are carving out their niche by emphasizing ingredient transparency and eco-friendly practices. They strategically offset shipping costs and harness online reviews to bolster their visibility, especially given their limited presence in supermarkets. This surge in online retail underscores the pivotal role of digital platforms in reshaping the distribution landscape of chewing gum in North America.
Geography Analysis
In 2025, the U.S. accounted for 67.63% of North America's chewing gum market, bolstered by a robust retail framework, strong brand loyalty, and endorsements from the American Dental Association. Growth is now driven by premiumization rather than sheer volume, exemplified by Mars Wrigley's USD 50 million "Chew You Good" campaign, positioning gum as a micro-wellness ritual. Regulatory moves, like California's SB 54, push for a shift to biodegradable bases, offering early adopters a reputational edge as eco mandates tighten ahead of the 2032 compliance deadline. This regulation encourages manufacturers to innovate and invest in sustainable materials, aligning with growing consumer demand for environmentally friendly products. At the same time, the anticipated increase in temporomandibular disorders, poses a challenge to habitual chewing. This trend nudges the market towards softer formats and limited-chew products, aiming to cater to older demographics who may face discomfort with traditional gum formats.
Mexico emerges as the North American chewing gum market's fastest-growing player, boasting a 6.08% CAGR, driven by modern trade growth and a youthful demographic. Local tastes lean towards fruit flavors and vitamin fortification, echoing wider Latin American confectionery trends. Additionally, proximity to U.S. plants streamlines the supply chain, cutting logistical expenses and enabling faster delivery times. Functional gums appeal to the aspirational consumer, seeking affordable wellness, allowing both multinationals and regional players to broaden their flavor and benefit offerings. This trend reflects a shift in consumer preferences towards products that combine indulgence with health benefits, creating opportunities for innovation in the functional gum segment.
While smaller, Canada distinguishes itself with Health Canada's endorsement of xylitol claims, which solidifies the presence of sugar-free products in pharmacies and grocery stores. Mars Wrigley's EXCEL Refreshers soft-chew launch exemplifies the nation's appetite for premium, clean-label innovations. The Canadian market also shows a growing preference for gums that align with health-conscious lifestyles, such as those with natural ingredients and reduced artificial additives. As retail consolidation intensifies, banner groups gain leverage, making substantiated functional claims essential for shelf visibility in urban centers. This consolidation also fosters competitive pricing and improved product availability, further driving consumer interest in high-quality gum products
Competitive Landscape
Top Companies in North America Chewing Gum Market
A few key players with moderate concentration dominate the North American chewing gum market. Brands from Mars Wrigley, Perfetti Van Melle, and Mondelēz command a significant presence on store shelves. With a USD 1.35 billion acquisition of Trident, Dentyne, and Bubblicious, Perfetti not only expanded its scale but also established a manufacturing base in Illinois, intensifying competition in mainstream outlets. This acquisition has positioned Perfetti as a formidable competitor, reshaping the market dynamics. Mars Wrigley, with its substantial advertising budget and diverse portfolio, is strategically focusing on soft-chew and functional products to maintain its market share and price premiums. The company’s ability to leverage cross-portfolio synergies further strengthens its competitive edge.
Emerging players like The PUR Company, Rev Energy Gum, and Simply Gum are tapping into consumer interests in xylitol, caffeine, and chicle. By prioritizing e-commerce, they sidestep traditional retail hurdles, leveraging influencer marketing and subscription models to grow their brands. These strategies allow them to directly engage with consumers, building loyalty and scale without relying on conventional retail channels. Retailers, eyeing profit margins, are developing their own-label products as budget-friendly alternatives, putting pressure on mid-tier brands that lack unique offerings or the budget for nationwide advertising. This trend is reshaping the competitive landscape, forcing mid-tier players to innovate or risk losing market share.
Investments in technology, from flavor mapping to AI-driven demand forecasting, are helping established players enhance efficiency and cater to niche markets. These advancements enable companies to predict consumer preferences better and optimize their supply chains. With regulatory support for biodegradable materials and potential clarity on CBD, new entrants see opportunities to establish themselves before larger corporations can dominate. These regulatory shifts could open new product categories, creating fresh growth avenues for both incumbents and challengers. In summary, while the North American chewing gum market presents opportunities, the high capital demands and the need for a diverse sales approach pose significant challenges for newcomers.
North America Chewing Gum Industry Leaders
Lotte Corporation
Mars Incorporated
Mondelēz International Inc.
Perfetti Van Melle BV
The Hershey Company
- *Disclaimer: Major Players sorted in no particular order

Recent Industry Developments
- November 2025: Ice Breakers has unveiled its innovative flavor-shifting gum, which boasts a unique technology that transitions from one flavor to another during chewing. This new product aims to enhance the consumer experience by offering a dynamic and engaging taste journey, setting it apart in the competitive gum market.
- May 2025: Trident, a prominent player in the market, had unveiled its latest offering: a sugar-free, cotton candy-flavored gum. This innovative product catered to the growing demand for sugar-free alternatives among health-conscious consumers. It was distributed across the United States, aiming to strengthen Trident's presence in the competitive chewing gum market.
- May 2025: Perfetti Van Melle USA has brought back its beloved Bubblicious bubblegum, a favorite among both kids and adults for its delightful flavor and ability to create big bubbles. This relaunch aims to rekindle nostalgia among long-time fans while introducing the iconic bubblegum to a new generation of consumers.
- May 2025: Rev Gum has rolled out its pink lemonade flavored chewing gum nationwide in the United States. The company touts that the gum is naturally colored and sweetened with monk fruit, offering a healthier alternative to traditional chewing gums.


North America Chewing Gum Market Report Scope
Sugar Chewing Gum, Sugar-free Chewing Gum are covered as segments by Sugar Content. Convenience Store, Online Retail Store, Supermarket/Hypermarket, Others are covered as segments by Distribution Channel. Canada, Mexico, United States are covered as segments by Country.| Sugar Chewing Gum |
| Sugar-free Chewing Gum |
| Stick Gum |
| Dragee Gum |
| Tablet |
| Soft Chew/Cubes |
| Others |
| Novelty |
| Fortified |
| Digestive / Botanicals |
| Others |
| Supermarket/Hypermarket |
| Convenience Stores |
| Online Retail Stores |
| Others |
| United States |
| Canada |
| Mexico |
| Rest of North America |
| By Product Type | Sugar Chewing Gum |
| Sugar-free Chewing Gum | |
| By Form | Stick Gum |
| Dragee Gum | |
| Tablet | |
| Soft Chew/Cubes | |
| Others | |
| By Functionality | Novelty |
| Fortified | |
| Digestive / Botanicals | |
| Others | |
| By Distribution Channel | Supermarket/Hypermarket |
| Convenience Stores | |
| Online Retail Stores | |
| Others | |
| By Geography | United States |
| Canada | |
| Mexico | |
| Rest of North America |


Market Definition
- Milk and White Chocolate - Milk chocolates is a solid chocolate made with milk (in the form of either milk powder, liquid milk, or condensed milk) and cocoa solids. White chocolate is made from cocoa butter and milk and contains no cocoa solids whatsoever. The scope includes regular chocolates, low-sugar, and sugar-free variants
- Toffees & Nougats - Toffees include hard, chewy, and small or one-bite candies marketed with labels as toffee or toffee-like confectionery. Nougat is a chewy confection with almond, sugar, and egg white as a basic ingredient; and it originated in Europe and Middle East countries.
- Cereals Bars - A snack composed of breakfast cereal that has been compressed into a bar shape and is held together with a form of edible adhesive. The scope includes snack bars made with cereals such as rice, oats, corn, etc. mixed with a binding syrup. These also include products labeled as cereal bars, cereal treat bars, or grain bars.
- Chewing Gum - This is a preparation for chewing, usually made of flavored and sweetened chicle or such substitutes as polyvinyl acetate. The types of chewing gums included in the scope are sugar-chewing gums and sugar-free chewing gums
| Keyword | Definition |
|---|---|
| Dark Chocolate | Dark chocolate is a form of chocolate containing cocoa solids and cocoa butter without the milk. |
| White Chocolate | White chocolate is the type of chocolate containing the highest percentage of milk solids, typically around or over 30 percent. |
| Milk Chocolate | Milk chocolate is made from dark chocolate that has a low cocoa solid content and higher sugar content, plus a milk product. |
| Hard Candy | A candy made of sugar and corn syrup boiled without crystallizing. |
| Toffees | A hard, chewy, often brown sweet that is made from sugar boiled with butter. |
| Nougats | A chewy or brittle candy containing almonds or other nuts and sometimes fruit. |
| Cereal bar | A cereal bar is a bar-shaped food product, made by pressing cereals and usually dried fruit or berries, which are in most cases held together by glucose syrup. |
| Protein bar | Protein bars are nutrition bars that contain a high proportion of protein to carbohydrates/fats. |
| Fruit & Nut bar | These are often based on dates with other dried fruit and nut additions and, in some cases, flavorings. |
| NCA | The National Confectioners Association is an American trade organization that promotes chocolate, candy, gum and mints, and the companies that make these treats. |
| CGMP | Current good manufacturing practices are those conforming to the guidelines recommended by relevant agencies. |
| Unstandardized foods | Unstandardized foods are those that do not have a standard of identity or that deviate from a prescribed standard in any manner. |
| GI | The glycemic index (GI) is a way of ranking carbohydrate-containing foods based on how slowly or quickly they are digested and increase blood glucose levels over a period of time |
| Skimmed milk powder | Skimmed milk powder is obtained by removing water from pasteurized skim milk by spray-drying. |
| Flavanols | Flavanols are a group of compounds found in cocoa, tea, apples, and many other plant-based foods and beverages. |
| WPC | Whey protein concentrate- the substance obtained by the removal of sufficient nonprotein constituents from pasteurized whey so that the finished dry product contains greater than 25% protein. |
| LDL | Low density Lipoprotein- the bad cholesterol |
| HDL | High density Lipoprotein- the good cholesterol |
| BHT | butylated Hydroxytoluene is a lab-made chemical that is added to foods as a preservative. |
| Carrageenan | Carrageenan is an additive used to thicken, emulsify, and preserve foods and drinks. |
| Free form | Not containing certain ingredients, such as gluten, dairy, or sugar. |
| Cocoa butter | It is a fatty substance obtained from cocoa beans, used in the manufacture of confectionery. |
| Pastellies | A type of of Brazilian candy made from sugar, eggs, and milk. |
| Draggees | Small, round candies that are coated with a hard sugar shell |
| CHOPRABISCO | Royal Belgian Association of the chocolate, pralines, biscuit, and confectionery industry- A trade association that represents the Belgian chocolate industry. |
| European Directive 2000/13 | A European Union directive that regulates the labeling of food products |
| Kakao-Verordnung | The German chocolate ordinance, a set of regulations that define what can be labeled as "chocolate" in Germany. |
| FASFC | Federal Agency for the Safety of the Food Chain |
| Pectin | A natural substance that is derived from fruits and vegetables. It is used in confectionery to create a gel-like texture. |
| Invert sugars | A type of sugar that is made up of glucose and fructose. |
| Emulsifier | A substance that helps to mix to liquids that does not mix together. |
| Anthocyanins | A type of flavonoid that is responsible for the red, purple, and blue colors of confectionery. |
| Functional Foods | Foods that have been modified to provide additional health benefits beyond basic nutrition. |
| Kosher certificate | This certification verifies that the ingredients, production process including all machinery, and/or food-service process complies with the standards of Jewish dietary law |
| Chicory root extract | A natural extract from the chicory root that is a good source of fiber, calcium, phosphorous, and folate |
| RDD | Recommended daily dose |
| Gummies | A chewy gelatin-based candy that is often flavored with fruit. |
| Nutraceuticals | Food or dietary supplements that are claimed to have health benefits. |
| Energy bars | Snack bars that are high in carbohydrates and calories are designed to provide energy on the go. |
| BFSO | Belgian Food Safety Organization for the food chain. |


Research Methodology
Mordor Intelligence follows a four-step methodology in all our reports.
- Step-1: Identify Key Variables: In order to build a robust forecasting methodology, the variables and factors identified in Step 1 are tested against available historical market numbers. Through an iterative process, the variables required for market forecast are set, and the model is built on the basis of these variables.
- Step-2: Build a Market Model: Market-size estimations for the forecast years are in nominal terms. Inflation is not a part of the pricing, and the average selling price (ASP) is kept constant throughout the forecast period for each country.
- Step-3: Validate and Finalize: In this important step, all market numbers, variables, and analyst calls are validated through an extensive network of primary research experts from the market studied. The respondents are selected across levels and functions to generate a holistic picture of the market studied.
- Step-4: Research Outputs: Syndicated Reports, Custom Consulting Assignments, Databases & Subscription Platforms


