Market Overview
| Study Period | 2021 - 2031 |
|---|---|
| Forecast Data Period | 2026 - 2031 |
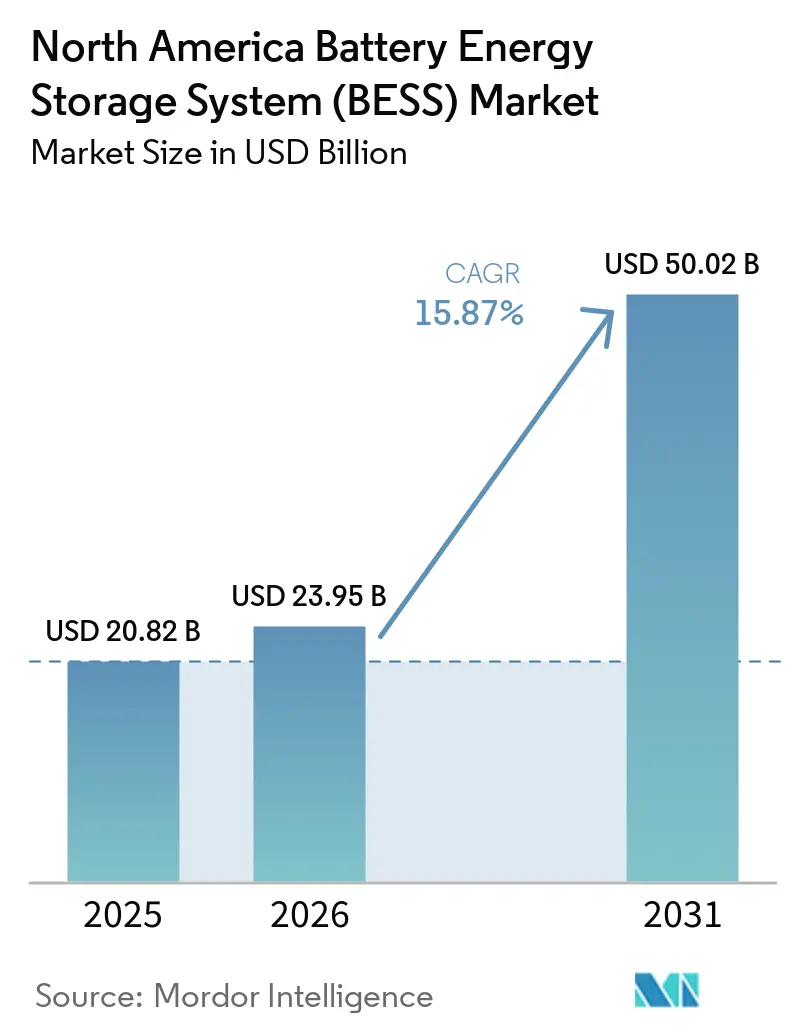
| Base Year Market Size (2025) | USD 20.82 Billion |
| Market Size (2026) | USD 23.95 Billion |
| Market Size (2031) | USD 50.02 Billion |
| Growth Rate (2026 - 2031) | 15.87% CAGR |
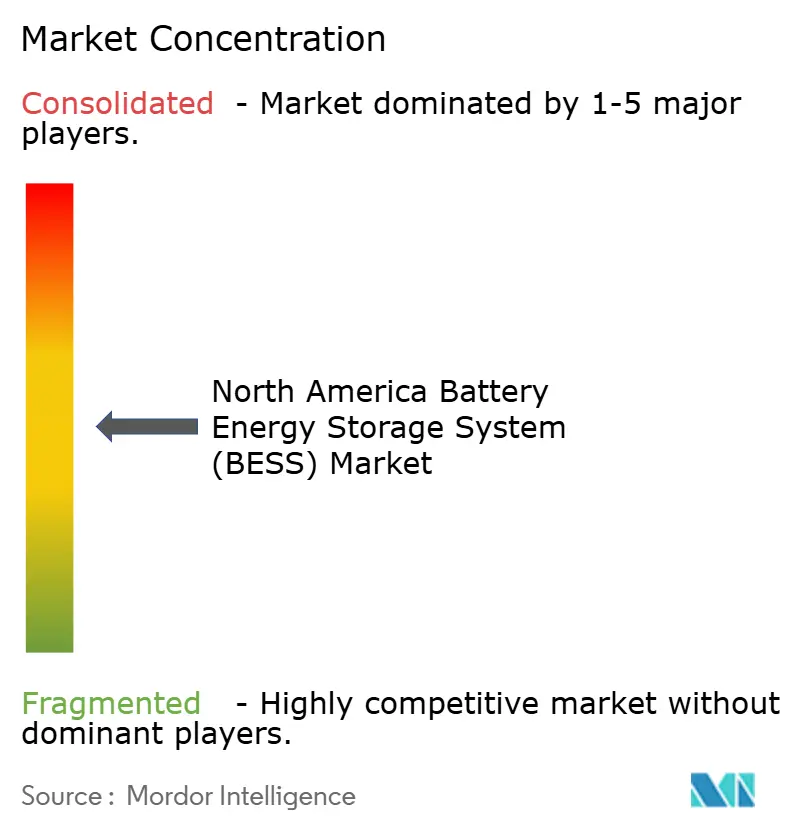
| Market Concentration | Medium |
Major Players
*Disclaimer: Major Players sorted in no particular order Image © Mordor Intelligence. Reuse requires attribution under CC BY 4.0. |
|
North America Battery Energy Storage System (BESS) Market Analysis by Mordor Intelligence
The North America Battery Energy Storage System Market size is projected to be USD 20.82 billion in 2025, USD 23.95 billion in 2026, and reach USD 50.02 billion by 2031, growing at a CAGR of 15.87% from 2026 to 2031.
Heightened state renewable-portfolio standards, the stand-alone storage investment tax credit, and data-center grid constraints are driving capital toward lithium-based systems that displace gas peakers and monetize price-spread arbitrage. Vertically integrated Asian battery manufacturers are localizing production to capture the Domestic Content Adder, while North American gigafactories are compressing module costs, accelerating adoption of lithium iron phosphate chemistries.[1]U.S. Internal Revenue Service, "Section 45X – Advanced Manufacturing Production Credit," irs.gov Merchant developers in ERCOT and CAISO are stacking energy, ancillary, and capacity revenues, a model that institutional investors now view as bankable. Fire-safety moratoria and raw-material price swings remain near-term headwinds, yet AI-enabled asset-management software is elongating cycle life and lifting project returns.
Key Report Takeaways
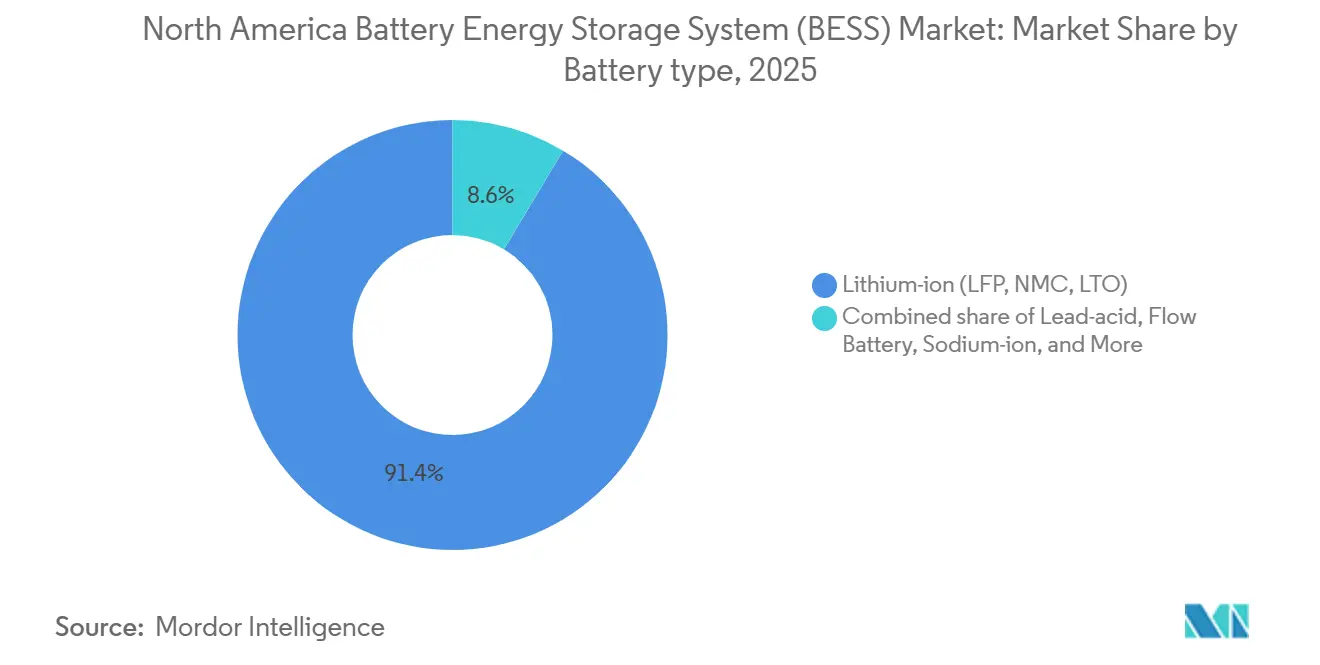
- By battery type, lithium-ion led with 91.4% market share in 2025, whereas flow batteries are expected to advance at a 31.8% CAGR through 2031.
- By connection type, on-grid systems commanded 88.5% of 2025 revenue; off-grid microgrids are expected to grow at 29.1% CAGR through 2031.
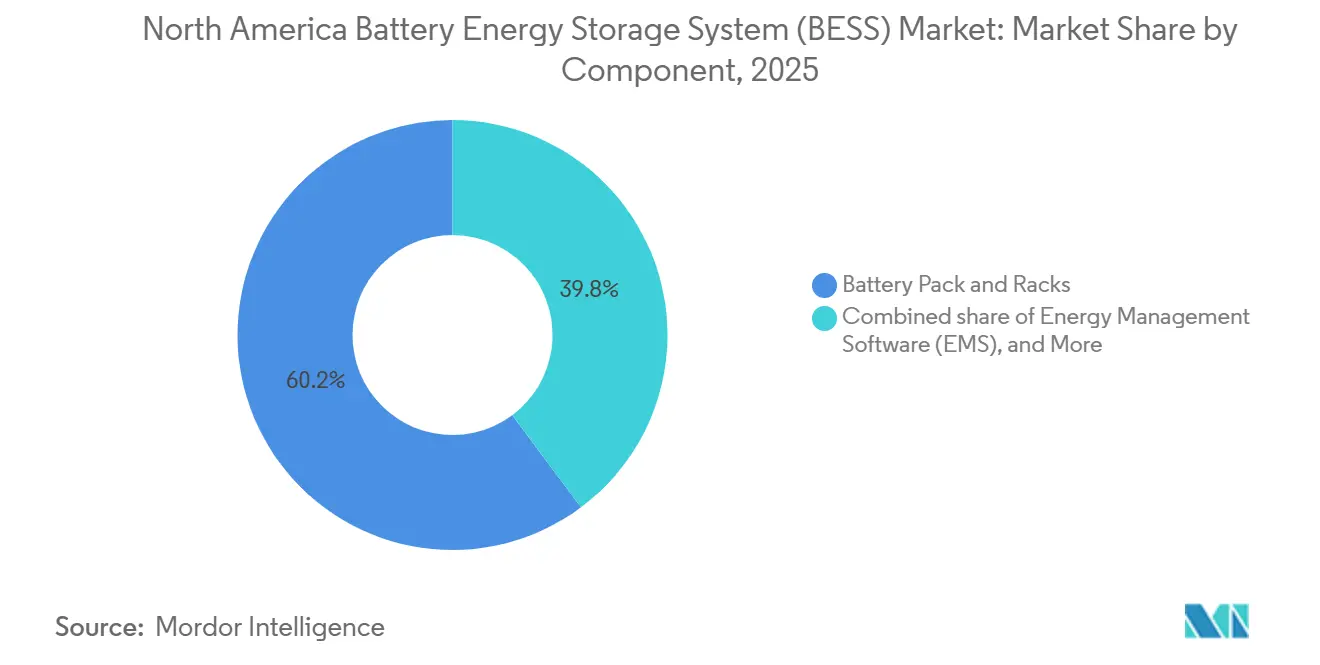
- By component, battery packs and racks held 60.2% of 2025 revenue, while energy-management software is expected to grow at 30.6% CAGR through 2031.
- By energy-capacity range, the 100-to-500 MWh band accounted for 40.7% of the North America battery energy storage system market share in 2025; projects above 500 MWh are projected to grow at 29.0% CAGR through 2031.
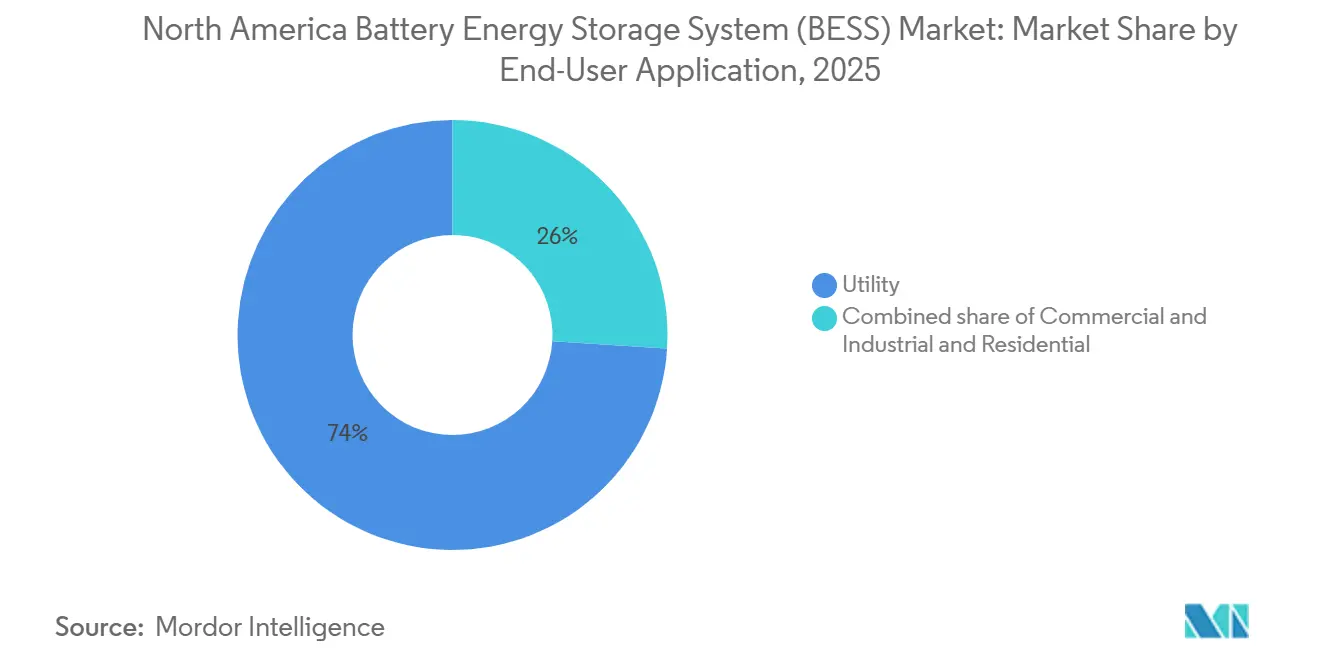
- By end-user, utility applications captured 74.0% of 2025 revenue, yet commercial and industrial deployments are expected to expand at 29.5% CAGR.
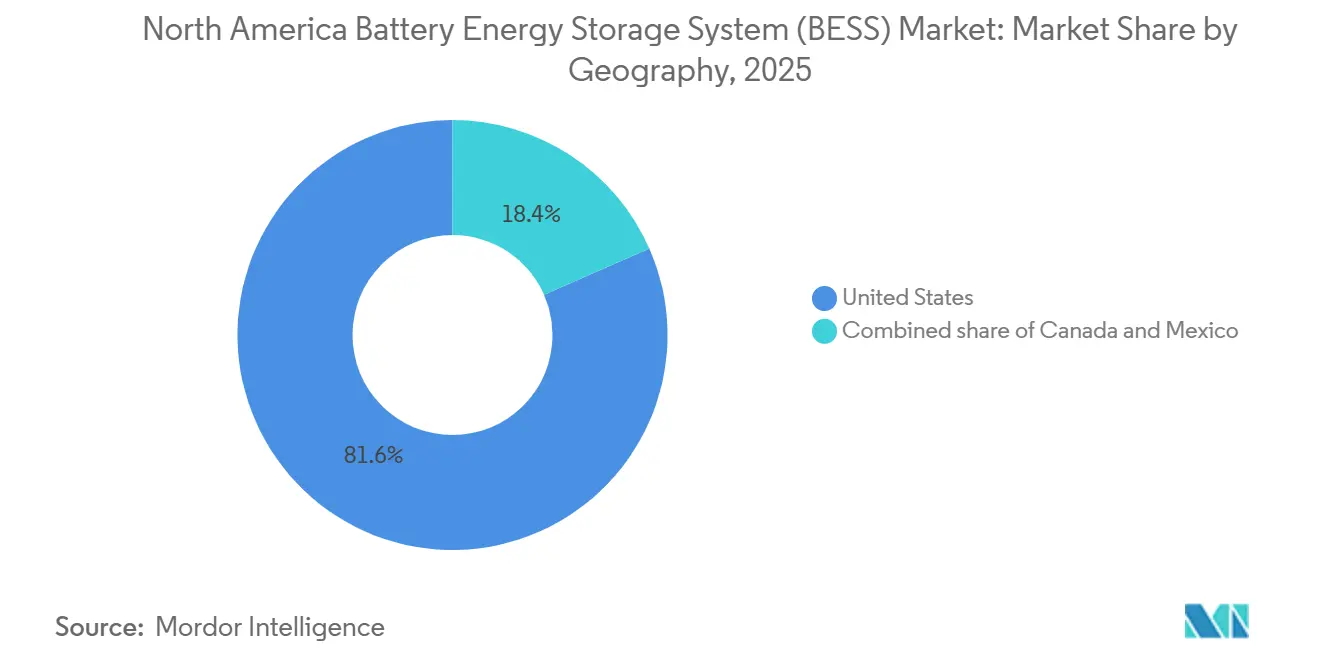
- By geography, the United States represented 81.6% of 2025 revenue and is projected to grow at 16.7% CAGR to 2031.
Note: Market size and forecast figures in this report are generated using Mordor Intelligence’s proprietary estimation framework, updated with the latest available data and insights as of 2026.
North America Battery Energy Storage System (BESS) Market Trends and Insights
Drivers Impact Analysis*
| Driver | (~) % Impact on CAGR Forecast | Geographic Relevance | Impact Timeline |
|---|---|---|---|
| Surging state-level renewable mandates | +3.2% | United States (CA, TX, NY, MA) | Medium term (2-4 years) |
| Falling LFP battery costs from NA gigafactories | +2.8% | United States, Canada | Short term (≤ 2 years) |
| IRA stand-alone storage tax credit | +3.5% | United States | Medium term (2-4 years) |
| Grid-hungry data-center build-out | +2.1% | United States (VA, TX, OR) | Short term (≤ 2 years) |
| Merchant-market revenue-stack innovation | +1.9% | United States (ERCOT, CAISO, PJM) | Medium term (2-4 years) |
| AI-optimised BESS asset management | +1.4% | North America | Long term (≥ 4 years) |
| Source: Mordor Intelligence | |||


Surging State-Level Renewable Mandates
Mandated capacity targets exceed 20 GW by 2030 across California, Texas, New York, Massachusetts, and New Jersey, creating a predictable offtake for four-hour batteries. California requires investor-owned utilities to contract for storage capable of four-hour discharge, crowding out shorter-duration technologies. ERCOT lacks a formal target, yet diurnal price spreads above USD 200/MWh have attracted more than 7 GW of interconnection requests since 2024. New York’s 6 GW storage goal includes a carve-out for ten-hour assets, incentivizing iron-air and flow chemistries.[2]New York State Energy Research and Development Authority (NYSERDA), "Energy Storage Program," nyserda.ny.gov These obligations, structured as capacity, not energy, requirements, accelerate the retirement of gas peakers that struggle with tightening emissions rules.
Falling LFP Battery Costs from NA Gigafactories
Domestic cell prices dropped to USD 89/kWh in late 2025, down 37% year-on-year, as CATL’s Michigan and LG Energy Solution’s Arizona plants surpassed 30 GWh annual output. Learning-curve gains, localized cathode supply, and cobalt-free chemistries reduce bill-of-materials by 18% versus NMC variants. The Domestic Content Adder delivers an additional 10-percentage-point investment credit, creating a USD 15-20/kWh landed-cost edge over imports. Ford’s BlueOval complex will divert 20% of EV-grade LFP cells to stationary projects from 2026, signaling automotive OEM entry into grid storage. Lower module pricing shifts competitive focus to software and long-term warranties.
IRA Stand-Alone Storage Tax Credit
Effective January 2023, stand-alone batteries qualify for the full 30% investment tax credit without solar pairing, improving project internal rates of return by up to 300 basis points. Treasury guidance in May 2024 permits grid-charged batteries if 75% of annual throughput is renewable, easily met in high-solar CAISO and windy SPP regions. Developers filed 40 GW of stand-alone interconnection requests in Texas during 2024-2025, tripling the prior two-year total. The credit also applies to capacity expansions at existing sites, encouraging two-hour projects to extend to four hours for dual energy-arbitrage and ancillary revenue. A phase-down beginning in 2033 is front-loading procurement, tightening the near-term supply of inverters and transformers.
Grid-Hungry Data-Center Build-Out
AI workload growth will add 15-20 GW of electricity demand through 2028, pushing hyperscale operators to co-locate batteries for frequency regulation and demand-charge reduction. Microsoft’s Virginia campus installed 500 MWh in 2025, earning USD 12 million annually from PJM ancillary markets and cutting connection fees by 30%. Google follows with a 300 MWh system in Oregon that aligns hourly consumption with renewable generation. Amazon Web Services pilots a grid-interactive Texas facility where batteries discharge during scarcity events, securing ERCOT capacity payments. FERC Order 2222 authorizes aggregated behind-the-meter resources to bid wholesale, legitimizing this revenue stack. As utilities tighten interconnection queues, on-site storage shifts from optional to obligatory for new data halls.
Restraints Impact Analysis*
| Restraint | (~) % Impact on CAGR Forecast | Geographic Relevance | Impact Timeline |
|---|---|---|---|
| Pumped-hydro & long-duration competition | −1.8% | United States (Pacific Northwest, Northeast) | Long term (≥ 4 years) |
| High up-front CAPEX & raw-material swings | −2.3% | North America | Short term (≤ 2 years) |
| Local fire-safety siting moratoria | −1.2% | United States (California, New York) | Short term (≤ 2 years) |
| Tariff / trade-case cost shocks | −1.6% | United States, Canada | Medium term (2-4 years) |
| Source: Mordor Intelligence | |||
Pumped-Hydro & LDES Competition
Pumped-storage hydro offers 8-to-12-hour discharge at USD 150-180/MWh, undercutting lithium-ion for multi-day needs; three new U.S. licenses totaling 6 GWh were approved in 2024-2025. Venture funding of USD 1.8 billion channeled to iron-air, zinc-bromine, and compressed-air startups signals investor appetite for 100-hour solutions. DOE’s Long Duration Storage Shot targets a 90% cost cut for 10-hour systems by 2030. Yet hydro faces multi-year environmental reviews, and nascent chemistries lack bankability, preserving lithium-ion’s dominance for the decade.
High Up-Front CAPEX & Raw-Material Swings
Turnkey costs of USD 350-450/kWh strain IPP balance sheets, and rate hikes lifted the weighted-average cost of capital by 150 basis points between 2021 and 2026. Lithium carbonate plunged from USD 85,000/t in Jan 2024 to USD 12,000/t by Dec 2025, rewarding flexible buyers but damaging fixed-price contracts. Indonesia’s nickel-ore export ban and Congo’s artisanal-mining crackdown keep NMC input prices volatile. Domestic lithium covers only 1% of global output, forcing reliance on imports despite IRA incentives. Developers are experimenting with tolling models, yet few possess the hedging sophistication to manage commodity exposure.
*Our forecasts treat driver/restraint impacts as directional, not additive. The impact forecasts reflect baseline growth, mix effects, and variable interactions.
Segment Analysis
By Battery Type: Flow Chemistries Extend Duration Economics
The lithium-ion segment held 91.4% of the North America battery energy storage system market share in 2025 and remains the base case for two-to-four-hour discharge because it delivers 88%-plus round-trip efficiency. Flow batteries are pacing the field at a 31.8% CAGR through 2031 as utilities in California, New York, and Alberta solicit ten-hour assets for renewable drought coverage, a trend that widens the addressable pool for vanadium-redox and zinc-bromine variants. Adoption of lithium iron phosphate within the North America battery energy storage system market has increased because domestic cathode supply chains lower bill-of-materials cost and eliminate cobalt-related volatility.
Sodium-ion pilots by Duke Energy and CATL illustrate a lithium-free path, yet limited manufacturing scale keeps costs above USD 120/kWh, restricting the chemistry to test beds for the rest of the decade. Lead-acid, lithium-titanate, and hybrid supercapacitors stay niche as their cycle life or energy density fail to match project-finance criteria. As capacity-market rules increasingly reward effective load-carrying capability, the North America battery energy storage system market is expected to allocate greater capital to chemistries with superior multi-cycle durability.


By Connection Type: Microgrids Offset Transmission Bottlenecks
On-grid projects controlled 88.5% of 2025 revenue because wholesale-market access in ERCOT, CAISO, and PJM underpins bankable cash flows.[3]Joseph Rand, “Queued Up: Characteristics of Power Plants Seeking Transmission Interconnection,” Lawrence Berkeley National Laboratory, lbl.gov Off-grid and hybrid microgrids expand at 29.1% CAGR through 2031, driven by Canadian mines, Alaska island communities, and U.S. military bases that need energy sovereignty during outages. Developers are turning to the North America battery energy storage system market to bypass five-year interconnection queues while capturing diesel-fuel savings that shorten payback to under seven years.
Microgrids sized 50-100 MWh now integrate wind, solar, and batteries to reach 70% renewable penetration and comply with provincial carbon-pricing schemes. Military installations, guided by the Department of Defense’s resilience mandate, use containerized 2 MW/8 MWh systems to sustain critical loads for two weeks, a capability that also earns demand-response revenue on local distribution tariffs. The widening cost gap between distributed and central-station upgrades sustains off-grid momentum inside the North America battery energy storage system market.
By Component: Software Captures Annuity Revenues
Battery packs and racks produced 60.2% of component sales in 2025, reflecting the capital intensity of cell manufacturing, yet price pressure from Chinese oversupply is shifting margins toward digital services. Energy-management software is forecast to compound at 30.6% per year as owners pursue algorithmic dispatch that raises project IRR by three to five percentage points. The North America battery energy storage system market size linked to software subscriptions is therefore projected to cross USD 5 billion by 2031.
Power-conversion systems retain roughly 20% of installed cost because UL 1741-SA certification and grid-forming features remain essential for NERC compliance. Balance-of-plant spend rises as NFPA 855 requires redundant thermal controls, a rule that especially influences urban projects in New York and San Diego. Vendors now bundle 10-year performance guarantees, O&M, and cyber-security patches with AI platforms, ensuring that software revenue recurs long after hardware depreciation.
By Energy Capacity Range: Gigawatt Hubs Lead Cost Compression
Systems rated 100-500 MWh delivered 40.7% of 2025 revenue, the historic sweet spot for four-hour applications that blend arbitrage with frequency response. Assets above 500 MWh are climbing at 29% CAGR because economies of scale drop turnkey cost from USD 450/kWh for 100 MWh arrays to USD 320/kWh for 1 GWh builds, a delta that reshapes the North America battery energy storage system market. NextEra’s 2,800 MWh Texas plant evidenced this by securing capacity payments sufficient to yield a sub-six-year payback.
Below-10 MWh projects, typically behind commercial meters, grow only 18% annually as they lack wholesale-market access and depend on demand-charge savings alone. Community choice aggregators prefer the 10-100 MWh band because tax-exempt municipal financing offsets the smaller scale. Developers increasingly target coal-plant brownfields where existing substations lower interconnection cost by up to 50%, sustaining the march toward gigawatt hubs inside the North America battery energy storage system market.
By End-User Application: C&I Growth Outpaces Utilities
Utility procurements still comprise 74% of value thanks to mandated capacity pipelines in California, New York, and Ontario. Commercial and industrial buyers, however, are growing at 29.5% CAGR as hyperscale data centers and auto manufacturers install batteries to shave USD 20-30/kW demand charges and secure backup power during wildfire or ice-storm outages. Residential aggregation into virtual power plants rises 22% per year under California’s Self-Generation Incentive Program.
Microsoft’s 500 MWh installation in Virginia shows that a single data-center campus can unlock USD 12 million of ancillary-service revenue, making batteries a profit center rather than a cost line. Manufacturing sites leverage five-to-20 MWh systems to hedge volatile time-of-use tariffs that now swing tenfold in ERCOT peak hours. Collectively, these behind-the-meter deployments will elevate the North America battery energy storage system market by democratizing access to wholesale-quality cash flows.
Geography Analysis
The United States dominated 81.6% of 2025 regional revenue, and its portion of the North America battery energy storage system market size is projected to rise at a 16.7% CAGR through 2031 as federal tax credits overlap with state procurement targets.[4]California Public Utilities Commission, “Energy Storage,” cpuc.ca.gov California alone operated 6.8 GW by year-end 2025 because Public Safety Power Shutoff regulations reward distribution-level resiliency assets. Texas added 4.2 GW across 2024-2025, the fastest expansion since scarcity-pricing events above USD 5,000/MWh create outsized arbitrage spreads in.
Canada captured about 12% of the 2025 value, led by Ontario’s 1.5 GW long-term RFP that replaces retiring nuclear baseload and by Alberta’s capacity-market reform that now pays storage for peak shaving.[5]Independent Electricity System Operator, “Long-Term RFP,” ieso.ca Provincial carbon-pricing regimes accelerate storage in Quebec and British Columbia remote mines where diesel offsets exceed USD 0.40/kWh. Mexico held under 7% share, but the 2024-2030 National Electric Development Program positions storage as critical to meet a 30% renewables goal, with Enel’s 20 MWh Villanueva array signaling commercial readiness in northern states.
Cross-border transmission corridors connecting Baja California with CAISO and the Rio Grande Valley with ERCOT open arbitrage trades that further expand the North America battery energy storage system market share in Mexico. Regulatory debates over private-sector participation linger, but tariff exemptions on imported modules keep levelized costs competitive versus diesel peakers in Sonora.
Competitive Landscape
Fluence Energy, Tesla, NextEra Energy Resources, AES Corporation, and Powin controlled roughly 60% of commissioned capacity in 2025, rendering the North America battery energy storage system industry moderately concentrated. Asian cell giants, Contemporary Amperex Technology, LG Energy Solution, and BYD, are building U.S. gigafactories to earn the 10-percentage-point Domestic Content Adder, a move that forces system integrators to compete more on software than on hardware. Fluence’s Mosaic and Tesla’s Autobidder already bill USD 3-5 per kW-year for optimization, creating stickier customer relationships than turnkey EPC contracts.
Iron-air and zinc-bromine startups such as Form Energy, Eos Energy, and Invinity secured USD 1.8 billion of venture backing across 2024-2025 and court utilities seeking 100-hour discharge, yet bankability hurdles slow large-scale awards. Companies lacking UL 9540A certification or IEEE 1547-2018-compliant inverters lost bids in 2025 RFPs, evidenced by ESS Inc.’s Chapter 11 filing after failing to scale its flow-battery pipeline. Automakers Ford and General Motors are vertically integrating stationary storage channels, diverting LFP and repurposed EV packs to grid assets, a development that intensifies rivalry across the North America battery energy storage system market.
White-space niches include second-life EV modules, cyber-secure microgrid controllers, and insurance-backed performance wraps for merchant assets. Strategic alliances, Fluence with TransAlta in Alberta, Tesla with Southern California Edison, illustrate a pivot toward long-duration service revenue over one-time hardware margin. Players unable to fund in-house AI platforms or certify grid-forming controls risk relegation to subcontract status.
North America Battery Energy Storage System (BESS) Industry Leaders
-
BYD Company Limited
-
Tesla Inc.
-
LG Energy Solution Ltd.
-
Samsung SDI Co Ltd
-
Fluence Energy Inc.
- *Disclaimer: Major Players sorted in no particular order

Recent Industry Developments
- February 2026: Lyten finalized the acquisition of key Northvolt battery assets, expanding its manufacturing and R&D capabilities to bolster a trans-Atlantic battery ecosystem serving both North America and Europe. This acquisition strengthens supply chains for future BESS deployments in the U.S. market.
- December 2025: Redwood Materials has unveiled its energy storage venture, Redwood Energy, and partPowerBank announced a 5 MW AC hybrid solar-plus-BESS project in upstate New York, supported by NYSERDA incentives. Designed as a community solar initiative with battery backup, the project will enhance local grid resilience and support New York’s distributed energy and BESS deployment goals.
- October 2025: Energy Vault acquired the 150 MW/300 MWh SOSA BESS project in Texas through its Asset Vault platform, enhancing its U.S. energy storage portfolio. This project aims to improve grid reliability within ERCOT and is scheduled to begin construction in late 2025, contributing to the growth of the North American BESS market.
- May 2025: Next Energy introduced U.S.-manufactured LFP cells, modules, and BMS for grid-scale BESS applications, addressing increasing domestic demand while qualifying for future federal ITC bonuses. Concurrently, AESI began winding down operations, signaling ongoing market consolidation in the North American energy storage sector.


North America Battery Energy Storage System (BESS) Market Report Scope
Battery energy storage is considered a critical technology in transitioning to a sustainable energy system. Battery energy storage systems store the generated energy and release it as needed by the end-user. They regulate voltage and frequency, reduce peak demand charges, integrate renewable sources, and provide a backup power supply. Batteries are crucial in energy storage systems, accounting for approximately 60% of the system's total cost.
The North American battery energy storage system (BESS) Market is segmented by battery type, connection type, component, energy capacity, end-user, and geography. By battery type, the market is segmented into lithium-ion, lead-acid, flow battery, sodium-ion, and other technologies. By connection type, the market is segmented into on-grid and off-grid. By component, the market is segmented into battery packs and racks, power conversion systems (PCS), energy management software (EMS), and balance-of-plant and services. By energy capacity, the market is segmented into below 10 MWh, 10 to 100 MWh, 100 to 500 MWh, and above 500 MWh. By end user, the market is segmented into utility-scale, commercial and industrial (C&I), and residential. The report also covers the market size and forecasts for the North America Battery Energy Storage System Market across the major countries (the United States, Canada, and Mexico). The market sizing and forecasts for each segment are based on the revenue (USD Billion).
By Battery Type
| Lithium-ion (Lithium Iron Phosphate (LFP), Nickel-Manganese-Cobalt (NMC), Lithium Titanate (LTO)) |
| Lead-acid |
| Flow Battery (Vanadium Redox, Zinc-Bromine) |
| Sodium-ion |
| Other Battery Technologies (NiCd, Hybrid Super-capacitors) |
By Connection Type
| On-Grid (Utility Interconnected) |
| Off-Grid (Micro-Grid, Hybrid) |
By Component
| Battery Pack and Racks |
| Power Conversion System (PCS) |
| Energy Management Software (EMS) |
| Balance-of-Plant and Services |
By Energy Capacity Range
| Below 10 MWh |
| 10 to 100 MWh |
| 100 to 500 MWh |
| Above 500 MWh |
By End-user Application
| Utility |
| Commercial and Industrial |
| Residential |
By Geography
| United States |
| Canada |
| Mexico |
| By Battery Type | Lithium-ion (Lithium Iron Phosphate (LFP), Nickel-Manganese-Cobalt (NMC), Lithium Titanate (LTO)) |
| Lead-acid | |
| Flow Battery (Vanadium Redox, Zinc-Bromine) | |
| Sodium-ion | |
| Other Battery Technologies (NiCd, Hybrid Super-capacitors) | |
| By Connection Type | On-Grid (Utility Interconnected) |
| Off-Grid (Micro-Grid, Hybrid) | |
| By Component | Battery Pack and Racks |
| Power Conversion System (PCS) | |
| Energy Management Software (EMS) | |
| Balance-of-Plant and Services | |
| By Energy Capacity Range | Below 10 MWh |
| 10 to 100 MWh | |
| 100 to 500 MWh | |
| Above 500 MWh | |
| By End-user Application | Utility |
| Commercial and Industrial | |
| Residential | |
| By Geography | United States |
| Canada | |
| Mexico |


Key Questions Answered in the Report
How large is the North America battery energy storage system market today?
It reached USD 23.95 billion in 2026 and is projected to climb to USD 50.02 billion by 2031 at a 15.87% CAGR.
Which battery chemistry is gaining ground on lithium-ion?
Flow batteries, led by vanadium-redox designs, are advancing at a 31.8% CAGR through 2031 because utilities need 10-hour duration.
Why are data centers installing large batteries?
Behind-the-meter storage cuts demand charges, speeds interconnection, and earns ancillary-service revenue, as Microsoft's 500 MWh Virginia system illustrates.
What incentives support stand-alone storage in the United States?
The Inflation Reduction Act grants a 30% investment tax credit plus a 10-percentage-point Domestic Content bonus for U.S.-made cells and modules.
How fast are commercial and industrial deployments growing?
The segment is expanding at 29.5% CAGR as factories and hyperscale operators adopt batteries for resilience and arbitrage.
Which regions in Canada lead storage uptake?
Ontario and Alberta top installations owing to a 1.5 GW long-term RFP and a newly introduced capacity market, respectively.
Page last updated on:


