Compressed Air Energy Storage (CAES) Market Size and Share
Market Overview
| Study Period | 2021 - 2031 |
|---|---|
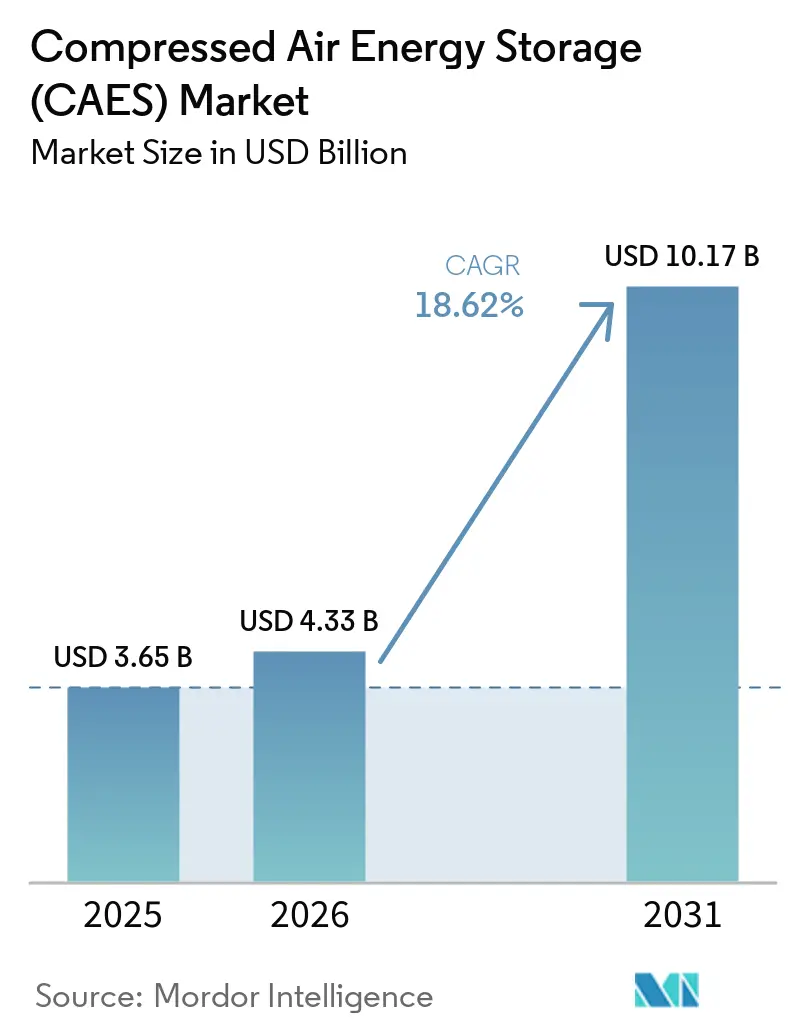
| Market Size (2026) | USD 4.33 Billion |
| Market Size (2031) | USD 10.17 Billion |
| Growth Rate (2026 - 2031) | 18.62% CAGR |
| Fastest Growing Market | Europe |
| Largest Market | North America |
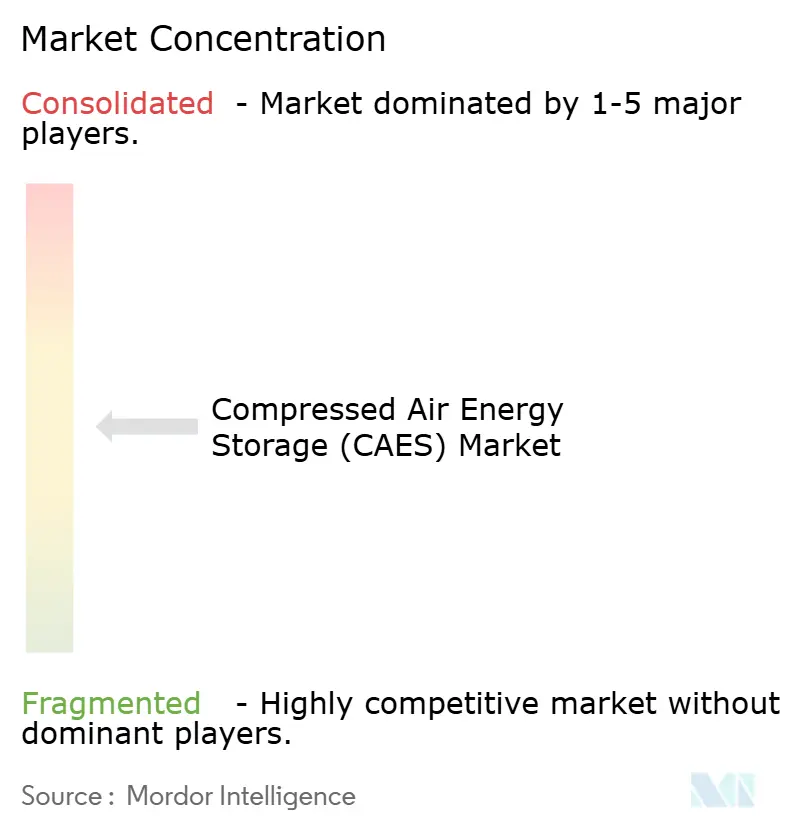
| Market Concentration | Medium |
Major Players
*Disclaimer: Major Players sorted in no particular order Image © Mordor Intelligence. Reuse requires attribution under CC BY 4.0. |
|
Compressed Air Energy Storage (CAES) Market Analysis by Mordor Intelligence
Compressed Air Energy Storage market size in 2026 is estimated at USD 4.33 billion, growing from 2025 value of USD 3.65 billion with 2031 projections showing USD 10.17 billion, growing at 18.6% CAGR over 2026-2031.
Long-duration storage mandates, federal loan guarantees, and the widening gap between renewable generation peaks and evening demand profiles underpin this rapid expansion. Utilities continue to dominate procurement, yet data center operators and mining site landlords are emerging as influential buyers. Salt-domed caverns remain the mainstream storage configuration, but hard-rock and mined caverns are gaining traction as developers repurpose abandoned infrastructure. Competitive pressure from falling battery costs persists in sub-8-hour applications; however, the compressed air energy storage market enjoys a structural cost advantage in projects lasting≥ 8 hours, particularly those linked to power-to-hydrogen initiatives. Intensified R&D in thermal management and AI-based dispatch optimization is lifting round-trip efficiencies toward 75%, positioning the compressed air energy storage industry as a credible zero-emission alternative to gas-fired peakers.
Key Report Takeaways
- By technology, the diabatic segment captured 49.75% of the compressed air energy storage market share in 2025, while adiabatic systems are projected to advance at a 22.10% CAGR through 2031.
- By storage configuration, salt-domed caverns accounted for 52.40% of the compressed air energy storage market size in 2025, and hard-rock/mined caverns are likely to grow at a CAGR of 24.80% over the forecast period.
- By power capacity, installations exceeding 100 MW accounted for 68.20% of the compressed air energy storage market share in 2025, while medium-scale (10 to 100 MW) units are expanding at a 25.30% CAGR.
- By application, renewable-integration firming led with a share of 37.40% of the market in 2025, while power-to-X hydrogen hybrids are forecast to expand at a 33.20% CAGR to 2031.
- By end-user, electric utilities held a 46.90% revenue share in 2025, while data centers and digital infrastructure are expected to grow at a 31.40% CAGR through 2031.
- By geography, Europe is on track to post the fastest 27.10% CAGR through 2031, even as North America retained 34.40% revenue share in 2025.
Note: Market size and forecast figures in this report are generated using Mordor Intelligence’s proprietary estimation framework, updated with the latest available data and insights as of 2026.
Global Compressed Air Energy Storage (CAES) Market Trends and Insights
Drivers Impact Analysis*
| Driver | % Impact on CAGR Forecast | Geographic Relevance | Impact Timeline |
|---|---|---|---|
| Renewable-energy penetration mandates | +4.2% | Global, with concentration in EU & California | Medium term (2-4 years) |
| Declining $/kWh for adiabatic CAES | +3.8% | North America & Europe, expanding to APAC | Long term (≥ 4 years) |
| Government long-duration storage tenders | +3.1% | UK, Australia, California, Germany | Short term (≤ 2 years) |
| Repurposing depleted gas fields for CAES | +2.7% | North America, Europe, Middle East | Medium term (2-4 years) |
| AI-optimised thermal management boosts round-trip efficiency | +2.4% | Global, led by North America & Europe | Long term (≥ 4 years) |
| Corporate 24/7 clean-power PPAs driving >8-hour storage | +2.1% | North America, Europe, APAC hyperscale markets | Medium term (2-4 years) |
| Source: Mordor Intelligence | |||
Renewable-Energy Penetration Mandates Drive Grid Stability Investments
Mandates in California, the EU, and select Australian states are compelling utilities to secure long-duration capacity that can bridge daily renewable gaps. California alone has earmarked USD 270 million for non-lithium storage and set a 4 GW target for assets with a six-hour duration, providing compressed air energy storage market projects with a clear policy runway. The UK’s cap-and-floor scheme, finalized in 2025, offers a regulated revenue stream for assets with discharge windows exceeding 6 hours, making CAES a bankable proposition for investors.[1]Department for Energy Security and Net Zero, “Long Duration Electricity Storage Cap-and-Floor Consultation,” gov.uk These frameworks directly address the “duck curve,” a scenario in which solar output falls steeply as evening demand rises, creating a four- to six-hour deficit that favors CAES over batteries. Australia’s New South Wales followed suit, contracting 1 GW/13 GWh of long-duration storage capacity, further expanding the compressed air energy storage market.[2]AEMO Services, “NSW LDES Tender Results,” aemoservices.com
Declining $/kWh Costs for Adiabatic CAES Technology
Thermal-management advances and standardized turbomachinery have driven adiabatic CAPEX down to USD 1,100-1,400 per kW, lifting round-trip efficiencies to 70-75%, and closing much of the gap versus pumped-hydro assets. Packed-bed heat-storage modules using phase-change materials now reach 61.5% energy efficiency and recoup costs within 3.5 years, enabling fossil-free operation and recurring carbon-credit revenue. Emerging low-temperature adiabatic designs operating at 90-200 °C are snaring frequency-regulation contracts thanks to sub-90-second start-up times. These cost and performance gains are positioning the compressed air energy storage market as a mainstream choice for multi-service portfolios that include arbitrage, spinning reserve, and synthetic inertia.
Government Long-Duration Storage Tenders Accelerate Deployment
Competitive tender programs offer multi-year availability payments that derisk financing. The UK dispersed GBP 69 million in grants during the LDES competition’s first tranche, catalyzing a 320 MWh CAES pipeline. California’s Camp Pendleton pilot attracted a USD 42 million grant for a 14-day backup project, highlighting the state's willingness to underwrite novel storage chemistries. These tenders typically mandate ≥8-hour discharge capability, immediately skewing award pools toward CAES technology and shrinking project debt-service spreads. Heightened developer rivalry in bidding rounds also compresses EPC and O&M margins, indirectly shaving levelized costs for follow-on projects in the compressed air energy storage market.
Repurposing Depleted Gas Fields Reduces Infrastructure Costs
Reusing depleted fields reduces site-preparation time by 18-24 months and cuts cavern-construction costs by 25-35%. Penn State simulations showed geothermal-assisted well retrofits can raise exergy efficiency by 9.5% while sealing methane-leaking wells. The Norton mine concept validated low-migration rates in hard-rock voids, confirming the feasibility of a multi-decade service life. In China, abandoned-mine caverns achieved a 50.31% round-trip efficiency and an energy density of 3.23 kWh/m³, bolstering the case for compressed air energy storage in regions lacking salt strata.
Restraints Impact Analysis*
| Restraint | % Impact on CAGR Forecast | Geographic Relevance | Impact Timeline |
|---|---|---|---|
| High up-front capex & long payback | -2.8% | Global, particularly in developing markets | Medium term (2-4 years) |
| Geological site limitations | -2.3% | Global, excluding regions with salt formations | Long term (≥ 4 years) |
| Battery price deflation pressure | -2.1% | Global, with higher impact in short-duration applications | Long term (≥ 4 years) |
| Community opposition over cavern integrity & seismicity | -1.6% | North America & Europe, localized project impacts | Short term (≤ 2 years) |
| Source: Mordor Intelligence | |||
High Up-Front Capital Expenditure Constrains Market Entry
Typical utility-scale CAES installations require USD 1,600-2,300 per kW for diabatic designs, with overall project budgets exceeding USD 100 million. The McIntosh plant’s inflation-adjusted build-out cost illustrates the sizable balance-sheet exposure developers face.[3]Pacific Northwest National Laboratory, “Cost Assessment of CAES Technologies,” pnnl.gov Four- to six-year payback horizons—even for 75%-efficient adiabatic systems—compare unfavorably with two- to three-year returns on front-of-the-meter battery arrays. Geological surveys, bespoke turbomachinery, and cavern-lining warranties increase contingency allowances, which dampens the appeal of the compressed air energy storage industry in capital-scarce regions that lack targeted policy support.
Battery Price Deflation Creates Competitive Pressure
Lithium-ion cell prices have plunged nearly 90% since 2010, eroding CAES’s margin of safety in four-to-eight-hour duty cycles. While levelized costs for 10-hour CAES units stand at USD 122 per kWh—still favorable to long-duration batteries—ongoing improvements in battery energy density threaten to close that gap. Battery arrays' 6-to 9-month deployment timelines contrast with the multi-year permitting and civil works schedules for CAES. As a result, proponents of the compressed air energy storage market are pivoting toward niches with durations exceeding 8 hours, emphasizing intrinsic inertia and black-start capabilities that batteries struggle to replicate.
*Our forecasts treat driver/restraint impacts as directional, not additive. The impact forecasts reflect baseline growth, mix effects, and variable interactions.
Segment Analysis
By Type: Adiabatic Systems Lead Efficiency Revolution
Adiabatic designs captured rising investor attention as round-trip efficiencies surged toward 75% and fuel-free operation aligned with corporate net-zero targets. The adiabatic segment is forecast to grow at a 22.10% CAGR to 2031, despite diabatic plants still holding a 49.75% market share in the compressed air energy storage market as of 2025. Forward-looking utilities favor adiabatic assets for zero-emission credentials, while regions with abundant gas pipelines and urgent capacity shortages continue to commission diabatic units. The compressed air energy storage market size for advanced isothermal prototypes remains small, but could expand once deep-ocean tethering tests validate a 90% theoretical efficiency.
Thermal-storage media costs have fallen by almost 30% since 2022, underpinning the adiabatic runway. Diabatic stalwarts are responding with hybrid-steam cycles that marginally improve efficiency yet rely on lower fuel heat rates to stay relevant. Isothermal ocean-floor pilots target offshore wind balancing, but CAPEX estimates between USD 1,500 and USD 3,000 per kW constrain near-term uptake. Continual innovation in phase-change composites, meanwhile, keeps the compressed air energy storage industry on a rapid learning curve.
By Storage Configuration: Underground Infrastructure Drives Innovation
Salt caverns accounted for 52.40% of the compressed air energy storage market size in 2025, owing to their geological prevalence in North America and Europe, proven sealing integrity, and mature leaching techniques. Developers report leakage rates below 0.02% per year, reinforcing bankability. Hard-rock and mined caverns, however, are growing at a 24.80% CAGR as operators retrofit abandoned mines in Australia, Germany, and China, benefiting from pre-existing shafts that slash excavation costs.
Above-ground pressure vessels cater to remote microgrids and fast-track projects under 10 MW but become cost-prohibitive at utility scale. Aquifer storage remains limited to pilot deployments because heterogenous porosity complicates pressure management. Underwater pipe concepts, although technically viable, still wrestle with mooring and maintenance logistics. Consequently, salt-domed and hard-rock caverns are likely to dominate the compressed air energy storage market share throughout the decade.


By Power Capacity: Utility-Scale Dominance Continues
Projects exceeding 100 MW accounted for 68.20% of the installed capacity in 2025, as bulk-power providers pursued economies of scale and stacked ancillary services. Such plants typically pair 275-bar compressors with multi-stage expander trains, delivering discharge windows of 8 to 12 hours. Intermediate-scale (10-100 MW) systems are accelerating at 25.30% CAGR, driven by industrial campuses and municipal utilities seeking self-sufficiency. Small-scale <10 MW units cater to island grids and critical-facility backup but remain margin-pressured by maturing battery alternatives.
Utility-scale dominance in the compressed air energy storage market stems from favorable cost curves: each doubling of plant size has historically resulted in a 14% reduction in per-kW CAPEX. Future modular skid designs under development could narrow the economic gap for mid-tier customers, fostering wider geographic diffusion.
By Application: Power-to-X Integration Transforms Market Dynamics
Renewable-integration firming retained 37.40% revenue share in 2025, but power-to-X hydrogen hybrids are forecast to post the fastest 33.20% CAGR. Pairing CAES compression stages with electrolyzers leverages waste-heat streams, achieving exergy efficiencies of 60.4% and unlocking multi-product income from electricity, hydrogen, and process steam. Peak-shaving remains popular among commercial users facing steep demand charges, whereas transmission-deferral schemes help postpone substation upgrades in congestion-prone corridors.
Growing electrification of mobility and industry amplifies hourly volatility, propelling the compressed air energy storage market toward broader grid-service portfolios that include voltage control and inertia support. Seasonal storage pilots that couple CAES with ammonia synthesis are in early feasibility assessment, foreshadowing a diverse application roadmap.
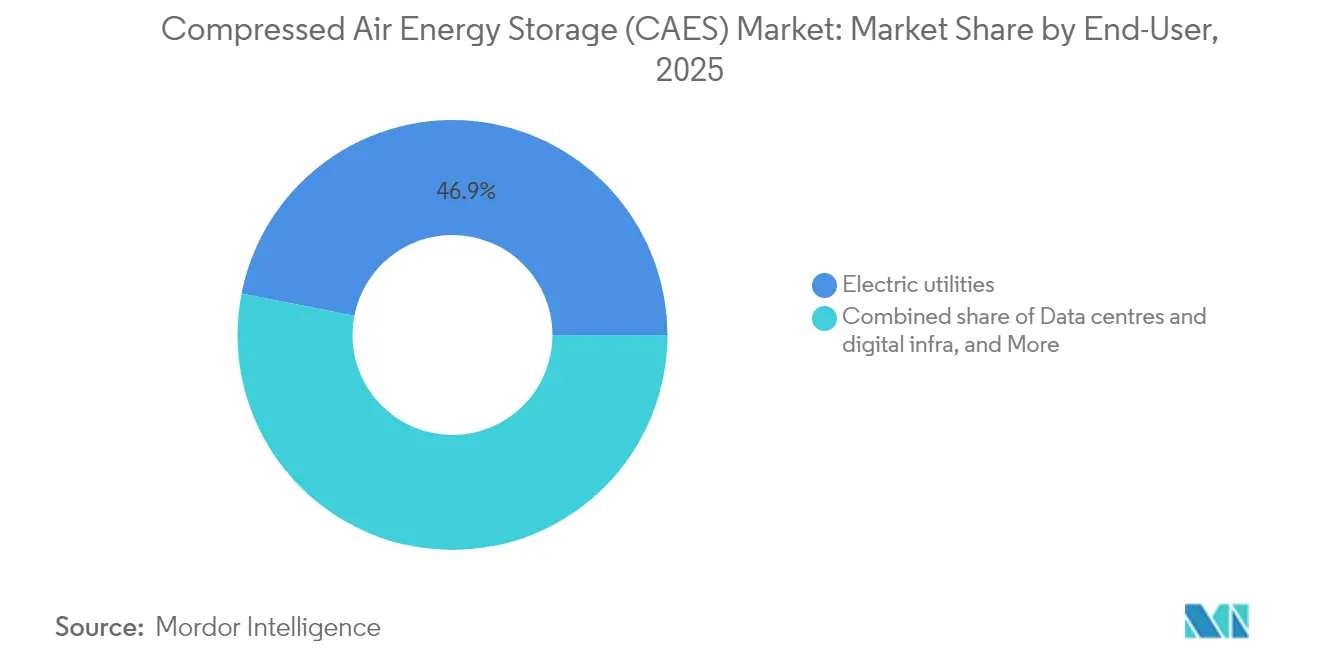
By End-User: Data Centers Drive Digital Infrastructure Demand
Electric utilities retained 46.90% revenue share in 2025, but data-center operators are the breakout growth story, expanding at 31.40% CAGR as hyperscalers chase 24/7 carbon-free energy goals. U.S. data-center load is expected to increase by 65 GW by 2029, elevating interest in solutions with≥8-hour backup capabilities over diesel generators. Independent power producers are also scaling CAES portfolios to complement wind-solar pipelines and secure firm-capacity revenues.
Remote communities in Alaska and northern Canada are piloting diesel-displacement schemes that marry CAES with micro-hydro and solar arrays. Industrial users with co-located process heat demand find thermal sharing synergies attractive. Overall, the compressed air energy storage market is diversifying beyond its traditional core in the utility sector.
Geography Analysis
North America captured 34.40% of revenues in 2025, driven by federal lending support and ambitious state procurement targets. Hydrostor’s 400 MW Willow Rock center in California exemplifies large-scale momentum, while Canada’s Quinte facility secured USD 200 million in growth capital to advance a 500 MW build-out. Mexico, though still exploratory, boasts ample salt formations that could host future sites once policy incentives materialize.
Europe’s 27.10% CAGR trajectory rests on cohesive decarbonization mandates. The UK’s cap-and-floor plan ensures baseload-style earnings, encouraging tender pipelines that favor technologies with discharge thresholds exceeding six hours. Germany’s grid-balancing needs have catalyzed proposals for CAES systems utilizing disused salt mines, and the Netherlands is studying repurposed gas fields for hybrid hydrogen-CAES hubs. Eastern Europe’s mining legacies offer an optionality for low-cost cavern conversion as renewable energy penetration grows.
Asia-Pacific region is evolving into a test bed for giga-scale installations. China’s 300 MW Jiangsu plant validated 40-bar, 600 °C operation, and additional 500 MW projects are moving through provincial approvals. Australia’s Long Duration Storage auctions secured over 1 GW of capacity, which includes CAES bids with 8-15-hour capabilities. Japan’s research consortia are evaluating seabed-pipe isothermal prototypes, while India’s Renewable Energy Storage Roadmap indicates potential fiscal incentives for assets with a storage duration of≥ 10 hours. Overall, the compressed air energy storage market is expanding rapidly, particularly where high renewable energy penetration is combined with supportive financing mechanisms.


Competitive Landscape
The compressed air energy storage industry shows moderate concentration, led by Hydrostor, Siemens Energy, and a cadre of regional developers. Hydrostor leverages its patented hydrostatic compensation reservoirs and recently attracted USD 200 million from Goldman Sachs Alternatives and the Canada Growth Fund to accelerate a 9 GWh global pipeline. Siemens Energy supplies turnkey diabatic and adiabatic plants rated up to 300 MW, bundling digital twins for predictive maintenance.
Conventional turbine OEMs are entering the fray through technology partnerships, while niche entrants focus on AI-optimized thermal storage skids and underwater isothermal concepts. Patent activity centers on the integration of compressors and expanders, advanced phase-change media, and grid-service stacking algorithms. White-space opportunities remain in repurposing hard-rock mines and combining CAES with green hydrogen production lines, arenas where first movers can carve durable moats.
Regional players, such as Corre Energy in Europe and Bhumi in India, are localizing cavern design know-how by partnering with EPCs that possess mining remediation skills. Hybrid power-to-X configurations are poised to reshape competitive dynamics as electrolyzer vendors and gas-grid operators seek synergies with long-duration storage assets.
Compressed Air Energy Storage (CAES) Industry Leaders
-
Siemens Energy AG
-
Hydrostor Inc.
-
General Compression Ltd.
-
Storelectric Ltd.
-
Mitsubishi Power Americas
- *Disclaimer: Major Players sorted in no particular order

Recent Industry Developments
- February 2025: Hydrostor raised USD 200 million in convertible equity and development loans to advance its 4 GWh Quinte Energy Storage Centre in Ontario.
- February 2025: Hydrostor secured environmental clearance for Australia’s 1.6 GWh Broken Hill advanced-CAES facility, a USD 638 million investment expected to create up to 400 construction jobs.
- January 2025: The U.S. DOE issued a conditional USD 1.76 billion loan guarantee to Hydrostor’s Willow Rock Energy Storage Center, marking the largest federal commitment to compressed air energy storage market deployment.
- December 2024: The California Energy Commission awarded USD 42 million to a 14-day CAES resilience project at Camp Pendleton, underscoring the public sector's interest in ultra-long-duration energy storage assets.


Global Compressed Air Energy Storage (CAES) Market Report Scope
The compressed air energy storage (CAES) market report include:
| Diabatic |
| Adiabatic |
| Isothermal |
| Super-/Advanced Isothermal |
| Salt-domed cavern |
| Hard-rock/mined cavern |
| Aquifer |
| Abandoned mine/tunnel |
| Above-ground pressure vessel |
| Underwater/seabed pipe |
| Small-scale (Below 10 MW) |
| Medium-scale (10 to 100 MW) |
| Renewable-integration firming |
| Peak-shaving and load-shifting |
| T&D deferral |
| Backup and resilience/microgrids |
| Industrial waste-heat recovery |
| Power-to-X hydrogen hybrids |
| Electric utilities |
| Independent power producers |
| Commercial and industrial |
| Remote and off-grid communities |
| Data centres and digital infra |
| North America | United States |
| Canada | |
| Mexico | |
| Europe | Germany |
| United Kingdom | |
| Italy | |
| Spain | |
| France | |
| Netherlands | |
| Norway | |
| Russia | |
| Rest of Europe | |
| Asia-Pacific | China |
| Japan | |
| India | |
| South Korea | |
| ASEAN Countries | |
| Australia | |
| Rest of Asia-Pacific | |
| South America | Brazil |
| Argentina | |
| Rest of South America | |
| Middle East and Africa | Saudi Arabia |
| United Arab Emirates | |
| Israel | |
| South Africa | |
| Egypt | |
| Rest of Middle East and Africa |
| By Type | Diabatic | |
| Adiabatic | ||
| Isothermal | ||
| Super-/Advanced Isothermal | ||
| By Storage Configuration | Salt-domed cavern | |
| Hard-rock/mined cavern | ||
| Aquifer | ||
| Abandoned mine/tunnel | ||
| Above-ground pressure vessel | ||
| Underwater/seabed pipe | ||
| By Power Capacity | Small-scale (Below 10 MW) | |
| Medium-scale (10 to 100 MW) | ||
| By Application | Renewable-integration firming | |
| Peak-shaving and load-shifting | ||
| T&D deferral | ||
| Backup and resilience/microgrids | ||
| Industrial waste-heat recovery | ||
| Power-to-X hydrogen hybrids | ||
| By End-User | Electric utilities | |
| Independent power producers | ||
| Commercial and industrial | ||
| Remote and off-grid communities | ||
| Data centres and digital infra | ||
| By Geography | North America | United States |
| Canada | ||
| Mexico | ||
| Europe | Germany | |
| United Kingdom | ||
| Italy | ||
| Spain | ||
| France | ||
| Netherlands | ||
| Norway | ||
| Russia | ||
| Rest of Europe | ||
| Asia-Pacific | China | |
| Japan | ||
| India | ||
| South Korea | ||
| ASEAN Countries | ||
| Australia | ||
| Rest of Asia-Pacific | ||
| South America | Brazil | |
| Argentina | ||
| Rest of South America | ||
| Middle East and Africa | Saudi Arabia | |
| United Arab Emirates | ||
| Israel | ||
| South Africa | ||
| Egypt | ||
| Rest of Middle East and Africa | ||


Key Questions Answered in the Report
What is the projected compressed air energy storage market size by 2031?
The market is forecast to reach USD 10.17 billion by 2031, expanding at an 18.62% CAGR during 2026-2031.
Which technology segment is growing fastest within the compressed air energy storage market?
Adiabatic systems are expected to post a 22.10% CAGR through 2031 due to higher efficiencies and zero-emission operation.
Why are data centers adopting compressed air energy storage solutions?
Hyperscale facilities need ≥8-hour clean backup power to meet 24/7 carbon-free goals, driving a 31.40% CAGR in CAES procurement among digital-infrastructure operators.
How does compressed air energy storage compare with lithium-ion batteries on cost?
CAES maintains a levelized-cost advantage in projects requiring ≥8-hour discharge durations, whereas batteries dominate shorter-duration windows because of lower upfront CAPEX and quicker deployment.
Which region is expected to grow fastest in the compressed air energy storage market?
Europe is projected to record a 27.10% CAGR through 2031, buoyed by the UK’s cap-and-floor scheme and Germany’s renewable-integration needs.
What is the main restraint hindering wider CAES adoption?
High up-front capital expenditure and multi-year payback periods, especially in regions lacking targeted policy support, continue to constrain market entry.
Page last updated on:


