Nordics Road Freight Transport Market Size and Share
Market Overview
| Study Period | 2018 - 2031 |
|---|---|
| Forecast Data Period | 2026 - 2031 |
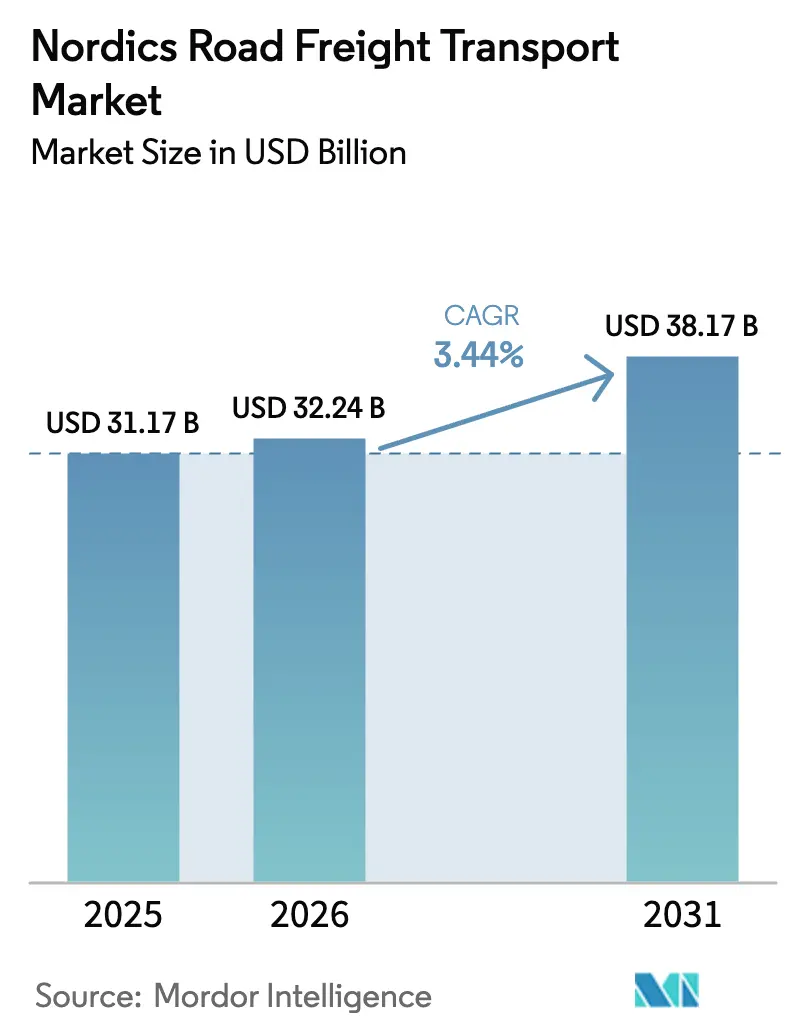
| Base Year Market Size (2025) | USD 31.17 Billion |
| Market Size (2026) | USD 32.24 Billion |
| Market Size (2031) | USD 38.17 Billion |
| Growth Rate (2026 - 2031) | 3.44% CAGR |
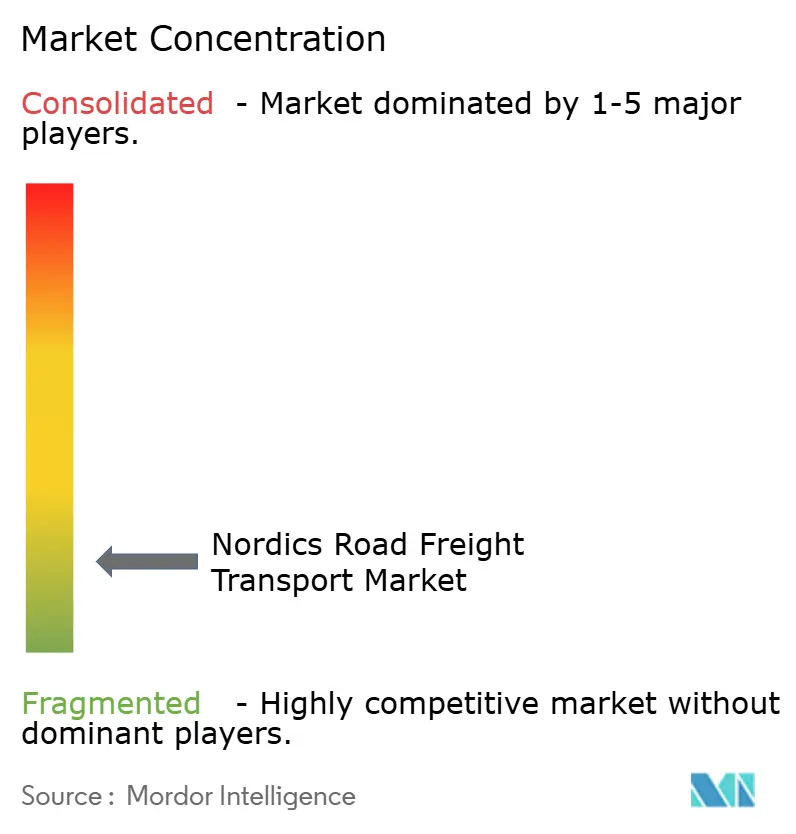
| Market Concentration | Low |
Major Players *Disclaimer: Major Players sorted in no particular order Image © Mordor Intelligence. Reuse requires attribution under CC BY 4.0. | |
Nordics Road Freight Transport Market Analysis by Mordor Intelligence
The Nordics road freight transport market size is expected to grow from USD 31.17 billion in 2025 to USD 32.24 billion in 2026 and is forecast to reach USD 38.17 billion by 2031 at 3.44% CAGR over 2026-2031. Manufacturing-led industrial output, rising e-commerce penetration that now exceeds 85% in major Nordic cities, and policy changes such as EU maritime-ETS surcharges together reinforce modal shifts toward road corridors. Sweden’s approval of 34.5-meter long vehicle combinations from April 2025 and Denmark’s distance-based carbon tolls reward high-utilization fleets, while AI-driven collaborative routing and growing cold-chain needs improve asset productivity and service differentiation. The domestic segment retains the bulk of freight flows, yet cross-border volumes rise faster as the Nordics road freight transport market deepens trade ties with continental Europe and the emerging Arctic gateway. Intensifying consolidation—exemplified by DSV’s EUR 14.3 billion (USD 15.78 billion) purchase of DB Schenker—reconfigures competitive benchmarks, with scale economies and technology investments shaping future margins.
Key Report Takeaways
- By end user industry, manufacturing led with 30.92% of the Nordics road freight transport market share in 2025, while wholesale and retail trade is projected to expand at a 4.02% CAGR between 2026-2031.
- By destination, domestic freight accounted for 64.02% of the Nordics road freight transport market share in 2025, whereas international lanes are advancing at a 4.09% CAGR between 2026-2031.
- By truckload specification, full-truck-load services dominated with 80.05% share in 2025; less-than-truck-load operations post the fastest 3.92% CAGR between 2026-2031.
- By containerization, non-containerized cargo held 87.62% of 2025 revenue, while containerized flows are set to grow at a 3.54% CAGR between 2026-2031.
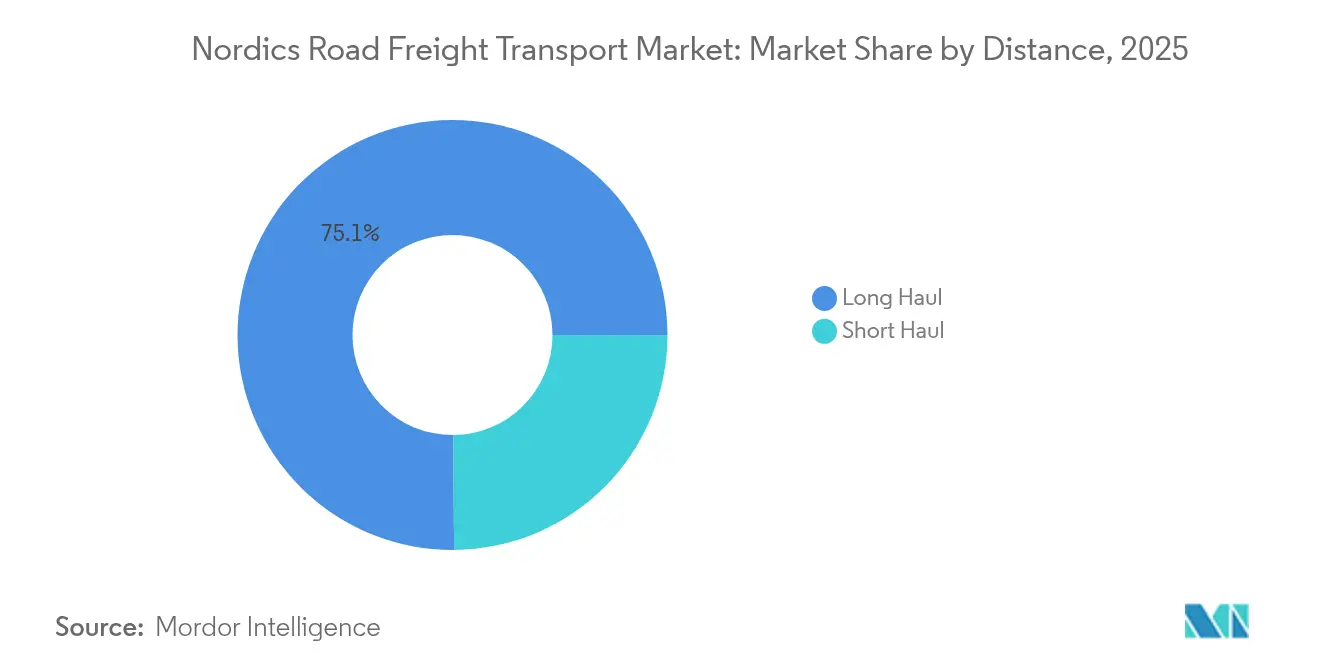
- By distance, long-haul movements captured 75.12% of 2025 market value and also represent the quickest growth path at a 3.64% CAGR between 2026-2031.
- By goods configuration, solid goods generated 70.74% of 2025 turnover, whereas fluid goods exhibit the highest 3.74% CAGR between 2026-2031.
- By temperature control, non-temperature-controlled freight contributed 93.95% of 2025 revenues, yet the temperature-controlled segment is rising at a 3.83% CAGR between 2026-2031.
- By geography, Sweden commanded 35.01% of 2025 value, while Finland shows the strongest 3.55% CAGR during 2026-2031.
Note: Market size and forecast figures in this report are generated using Mordor Intelligence’s proprietary estimation framework, updated with the latest available data and insights as of 2026.
Nordics Road Freight Transport Market Trends and Insights
Drivers Impact Analysis*
| Driver | (~) % Impact on CAGR Forecast | Geographic Relevance | Impact Timeline |
|---|---|---|---|
| E-commerce parcel-locker boom raises first/last-mile demand | +0.6% | Sweden, Denmark, Norway urban centers | Short term (≤ 2 years) |
| Port-centric cold-chain clusters shift reefer volumes from sea to road | +0.8% | Gothenburg, Copenhagen, Oslo | Medium term (2-4 years) |
| EU maritime-ETS surcharges shift short-sea cargo to road corridors | +0.4% | Denmark-Sweden, Norway-Denmark | Short term (≤ 2 years) |
| AI-enabled collaborative routing improves truck load factors | +0.5% | Stockholm, Copenhagen, Helsinki | Medium term (2-4 years) |
| Cross-laminated-timber boom accelerates north-to-south timber flows | +0.3% | Finland, Sweden to continental EU | Long term (≥ 4 years) |
| Hydrogen-ICE retrofit subsidies extend diesel fleet life | +0.4% | Norway, Denmark pilot lanes | Long term (≥ 4 years) |
| Source: Mordor Intelligence | |||


E-commerce Parcel-Locker Boom Raises First/Last-Mile Demand
Automation of more than 6,000 PostNord parcel-locker units containing over 200,000 compartments reshapes urban distribution by requiring two to three daily replenishments in contrast with weekly retail restocks. Micro-distribution networks anchored in city consolidation centers increase truck rotations and lift vehicle utilization by double-digit rates, aligning with consumers’ willingness to pay for same-day delivery. Elevated frequency supports higher yield per kilometer and entrenches the Nordics road freight transport market position in metropolitan logistics[1]“EU Emissions Trading System,” European Commission, climate.ec.europa.eu.
Port-Centric Cold-Chain Clusters Shift Reefer Volumes From Sea to Road
Gothenburg’s port-adjacent facilities now handle more than 40% of Nordic pharmaceutical imports, leveraging road speed to satisfy strict just-in-time delivery windows. Enhanced trailer refrigeration capable of maintaining ±2 °C tolerance across 1,000 km journeys removes intermediate hand-offs and awards road carriers superior reliability. These cluster-based flows deepen the Nordics road freight transport market integration into high-margin pharma and fresh-food supply lines[2]“Long Vehicle Combinations Approval,” Swedish Transport Administration, trafikverket.se.
EU Maritime-ETS Surcharges Shift Short-Sea Cargo to Road Corridors
Carbon costs of EUR 80-100 (USD 88.29 - 110.36) per ton of CO₂ add roughly 3-5% to Nordic ferry freight rates, prompting shippers to favor the Oresund Bridge road link where truck volumes climbed 8% in early 2025 versus 2024. Modal substitution reinforces road’s time-definite advantage and stimulates new service offerings throughout the Nordics road freight transport market.
AI-Enabled Collaborative Routing Improves Truck Load Factors
Regional carriers connecting Stockholm, Copenhagen, and Helsinki employ real-time cargo-sharing software that reduces empty running and compresses delivery windows. Operators report material gains in fuel savings and faster payback on telematics investments, driving operational excellence throughout the Nordics road freight transport market.
Restraints Impact Analysis*
| Restraint | (~) % Impact on CAGR Forecast | Geographic Relevance | Impact Timeline |
|---|---|---|---|
| Carbon-based truck tolls erode diesel haulage margins | -0.7% | Denmark, Sweden | Short term (≤ 2 years) |
| Driver hiring gap limits fleet utilization | -0.9% | Region-wide, acute in Sweden & Norway | Medium term (2-4 years) |
| Grid-capacity bottlenecks delay fleet electrification | -0.5% | Urban periphery logistics hubs | Medium term (2-4 years) |
| EU Stage VII emission proposal inflates tractor CAPEX | -0.6% | All Nordic markets | Long term (≥ 4 years) |
| Source: Mordor Intelligence | |||
Carbon-Based Truck Tolls (2025+) Erode Diesel Haulage Margins
Distance-based charges reaching DKK 1.10 (USD 0.16) per km in Denmark and complementary Swedish levies raise operating expenses by up to 12% on typical Nordic lanes. Preferential tariffs for zero-emission trucks pressure legacy fleets and could accelerate consolidation within the Nordics road freight transport market as scale economies dictate survival[3] “Driver Shortage Update 2025,” IRU, iru.org.
Driver Hiring Gap (>18% Vacancy Rate) Limits Fleet Utilization
Vacancy rates surpass 18% and touch 25% in hazardous-goods segments, forcing carriers to park assets or decline loads despite demand growth. Rising wages partially mitigate attrition, yet lifestyle deterrents persist, restricting supply capacity across the Nordics road freight transport market[4]“Euro 7/Stage VII Emission Proposal,” European Commission, ec.europa.eu.
*Our forecasts treat driver/restraint impacts as directional, not additive. The impact forecasts reflect baseline growth, mix effects, and variable interactions.
Segment Analysis
By End User Industry: Manufacturing Drives Nordic Trade Flows
Manufacturing accounted for 30.92% of the Nordics road freight transport market size in 2025, crystallizing the sector’s pivotal freight role. Automotive, machinery, and forest-products plants produce high-frequency shipments that align with road’s time-definite profile. Wholesale and retail trade currently contributes a smaller share yet records the fastest 4.02% CAGR between 2026-2031 as e-commerce saturation demands doorstep logistics solutions. Agriculture, forestry, and fishing ride export momentum for sustainably sourced goods, whereas construction freight rises alongside bold Nordic infrastructure programs.
Lean production techniques amplify shipment frequency, cementing road transport’s indispensability. Reverse-logistics flows for remanufacturing enhance two-way lane balance, optimizing capacity in the Nordics road freight transport market. Circular-economy mandates spur backhaul utilization gains, supporting stable yields even when economic cycles soften.


By Destination: Cross-Border Growth Outpaces Domestic Expansion
Domestic movements represented 64.02% of the Nordics road freight transport market share in 2025, serving sparsely populated geographies that necessitate reliable door-to-door service. International lanes, however, chart a 4.09% CAGR between 2026-2031 on the back of harmonized customs platforms and strengthened continental links. Enhanced Nordic-Baltic corridors and the forthcoming Fehmarn Belt link will shave transit times, guiding incremental volumes toward road.
Integrated digital processes reduce border friction, letting carriers reposition assets swiftly and capture high-value loads. While carbon tolls raise local cost bases, dynamic routing and longer vehicles keep road competitive on distance-sensitive hauls, reinforcing the Nordics road freight transport market positioning for cross-border agility.
By Truckload Specification: LTL Services Gain Share Through Consolidation
Full-truck-load commanded an 80.05% slice of the Nordics road freight transport market size in 2025 thanks to bulk commodities and long-distance manufacturing flows. Less-than-truck-load now posts a 3.92% CAGR between 2026-2031 as real-time freight-matching platforms consolidate fragmented consignments into optimized routes. Automated sorting terminals and daily cross-dock services narrow delivery windows and elevate service expectations.
As shippers favor smaller but more regular deliveries, LTL networks monetize density and visibility advantages. Groupage Network 2.0 slashed European transit times by 34%, exemplifying network redesign benefits. The shift also tempers driver shortages by maximizing payload per kilometer, enhancing resilience across the Nordics road freight transport market.
By Containerization: Specialized Handling Drives Non-Containerized Dominance
Non-containerized cargo retained 87.62% market share in 2025, given the prevalence of forestry products, mining output, and oversized machinery ill-suited to standard containers. Containerized freight is, nonetheless, advancing at 3.54% CAGR between 2026-2031 on deepening Asia trade and inland terminal investments. Container-on-flatcar experiments on select corridors hint at modal blending, yet specialized trailers keep premium-rate niches profitable.
Strong know-how in heavy-lift and project logistics yields defensible margins as wind turbines and energy infrastructure components demand bespoke handling. Carriers exploit backhaul containerized flows to balance network economics, showcasing the adaptive depth of the Nordics road freight transport market.
By Distance: Long-Haul Operations Leverage Geographic Scale
Long-haul routes generated 75.12% of the Nordics road freight transport market size in 2025, underlining the need to bridge remote production hubs with consumption centers scattered across vast terrain. A 3.64% CAGR between 2026-2031 accompanies Sweden’s 34.5-meter truck rollout, raising payloads by 13% per trip. Short-haul segments still flourish in urban fulfillment circuits but carry lower absolute growth.
Autonomous driving pilots focus on highway stretches, aiming to relieve the acute driver deficit. Continuous investment in roadway winterization and digital traffic management systems further boosts reliability, securing the Nordics road freight transport market appeal for extended-distance shippers.
By Goods Configuration: Solid Goods Reflect Industrial Base
Solid goods held 70.74% share in 2025, propelled by timber, metals, machinery, and packaged products. Fluid goods register a 3.74% CAGR between 2026-2031, underpinned by biofuel and chemicals capacity expansions that demand specialized tankers and stringent safety protocols. Intermodal tank-container uptake trims handling steps, yet road transport provides critical last-mile versatility.
Regulatory regimes governing hazardous liquids elevate barrier-to-entry, enabling qualified carriers to command higher yields. Biochemical exports leverage road flexibility to time deliveries tightly around downstream production slots, enriching the Nordics road freight transport market revenue mix.
By Temperature Control: Cold Chain Expansion Serves Pharma Growth
Non-temperature-controlled freight represented 93.95% of the Nordics road freight transport market share in 2025. Temperature-controlled volumes, however, post a 3.83% CAGR between 2026-2031, fueled by Nordic biopharma output and direct-to-consumer fresh food services. Advanced telematics permit real-time temperature traceability, satisfying regulators and insurers alike.
Trailer systems sustaining ±2 °C over 1,000 km enable seamless door-to-door movements from regional plants to continental depots. As precision medicine widens the variety of chilled SKUs, specialized fleets cement their strategic role inside the Nordics road freight transport market ecosystem.
Geography Analysis
Sweden dominates the Nordics road freight transport market with 35.01% share in 2025, anchored by robust automotive and machinery clusters that funnel continuous freight streams into Gothenburg and Stockholm hubs. Long-vehicle adoption raises payload efficiency, mitigating cost pressures from carbon tolls while keeping door-to-door transit times ahead of rail alternatives. Advanced consolidation centers around Gothenburg align maritime, rail, and road flows, cementing Sweden’s status as the regional logistics nucleus.
Finland records the quickest expansion at a 3.55% CAGR between 2026-2031, leveraging Rail Nordica’s standard-gauge extension to funnel Baltic and Arctic trade southward. Modernized forest-industry lines feed value-added wood exports, and updated intermodal depots heighten road feeder activity. Strategic emphasis on east-west corridors lets carriers hedge geopolitical uncertainties and redirect cargo toward Western Europe, augmenting the Nordics road freight transport market’s resilience.
Denmark sustains steady gains through its gateway function into continental Europe. Distance-based carbon tolls push fleets toward aerodynamics and telematics integration, thinning cost gaps with rail ferries. Norway’s energy transition pivots carriers toward wind-turbine and hydrogen equipment moves as offshore petroleum volumes taper, while Iceland’s compact geography and dependable road grid underpin reliable intra-island delivery patterns.
Competitive Landscape
The market is fragmented. Post-acquisition, the merged DSV-DB Schenker entity commands outsized bargaining power and network reach, reshaping rate structures and service benchmarks across every major Nordic corridor. Medium-sized operators respond by doubling down on sector specialization—temperature-controlled, oversized, and hazardous-goods services—to avoid direct price wars. AI-driven routing and real-time tracking become baseline expectations, with early adopters realizing notable uptime and customer-retention benefits.
Electrification divides the field: DFDS’s fleet of 225 heavy electric trucks exemplifies first-mover advantage, though grid bottlenecks cap immediate rollout. Operators securing early charging slots at urban logistics parks capture eco-focused client segments and lock in premium contracts. Driver recruitment emerges as a hidden differentiator; firms incorporating flexible rostering and continuous training reduce vacancy rates and sustain higher fleet utilization, cushioning the Nordics road freight transport market against chronic labor shortages.
Regulatory escalation around carbon pricing and Stage VII emissions tilts the table toward capital-rich players capable of briskly renewing fleets. Hybrid financial models—lease-back combined with green-bond funding—surface as popular tools for mid-tier carriers seeking parity. Collaboration among niche specialists through digital freight exchanges deepens network coverage without heavy asset duplication, underscoring the adaptive fabric of the Nordics road freight transport market.
Nordics Road Freight Transport Industry Leaders
DSV A/S (including DB Schenker)
DHL Group
DFDS Logistics
Kuehne + Nagel
Girteka
- *Disclaimer: Major Players sorted in no particular order

Recent Industry Developments
- April 2025: DSV A/S finalized its EUR 14.3 billion (USD 15.78 billion) purchase of DB Schenker, creating a USD 41.6 billion-revenue logistics leader.
- April 2025: Girteka introduced new rail-road intermodal services linking Sweden-Germany and Finland-Germany corridors, expanding low-carbon freight options.
- March 2025: DFDS took delivery of 100 additional Volvo heavy electric trucks, raising its battery-electric fleet to 225 units.
- January 2024: Rhenus Group rolled out its Groupage Network 2.0, cutting European transit times to Nordic destinations by an estimated 34%.


Nordics Road Freight Transport Market Report Scope
Agriculture, Fishing, and Forestry, Construction, Manufacturing, Oil and Gas, Mining and Quarrying, Wholesale and Retail Trade, Others are covered as segments by End User Industry. Domestic, International are covered as segments by Destination. Full-Truck-Load (FTL), Less than-Truck-Load (LTL) are covered as segments by Truckload Specification. Containerized, Non-Containerized are covered as segments by Containerization. Long Haul, Short Haul are covered as segments by Distance. Fluid Goods, Solid Goods are covered as segments by Goods Configuration. Non-Temperature Controlled, Temperature Controlled are covered as segments by Temperature Control. Denmark, Finland, Iceland, Norway, Sweden are covered as segments by Country.| Agriculture, Fishing, and Forestry |
| Construction |
| Manufacturing |
| Oil and Gas, Mining and Quarrying |
| Wholesale and Retail Trade |
| Others |
| Domestic |
| International |
| Full-Truck-Load (FTL) |
| Less than-Truck-Load (LTL) |
| Containerized |
| Non-Containerized |
| Long Haul |
| Short Haul |
| Fluid Goods |
| Solid Goods |
| Non-Temperature Controlled |
| Temperature Controlled |
| Denmark |
| Finland |
| Iceland |
| Norway |
| Sweden |
| End User Industry | Agriculture, Fishing, and Forestry |
| Construction | |
| Manufacturing | |
| Oil and Gas, Mining and Quarrying | |
| Wholesale and Retail Trade | |
| Others | |
| Destination | Domestic |
| International | |
| Truckload Specification | Full-Truck-Load (FTL) |
| Less than-Truck-Load (LTL) | |
| Containerization | Containerized |
| Non-Containerized | |
| Distance | Long Haul |
| Short Haul | |
| Goods Configuration | Fluid Goods |
| Solid Goods | |
| Temperature Control | Non-Temperature Controlled |
| Temperature Controlled | |
| Country | Denmark |
| Finland | |
| Iceland | |
| Norway | |
| Sweden |


Market Definition
- Agriculture, Fishing, and Forestry (AFF) - This end user industry segment captures the external (outsourced) logistics expenditure incurred by the AFF industry players on road freight transport service. The end user players considered are the establishments primarily engaged in growing crops, raising animals, harvesting timber, harvesting fish & other animals from their natural habitats and providing related support activities. Herein, across the value chain, Logistics Service Providers (LSPs) play a crucial role in acquisition, storage, handling, transportation, and distribution activities for the optimal & continuous flow of inputs (seeds, pesticides, fertilizers, equipment, and water) from manufacturers or suppliers to the producers and smooth flow of output (produce, agro-goods) to distributors/ consumers. This includes both termperature controlled and non-temperature controlled logistics, as and when required according to the shelf life of goods being transported or stored.
- Construction - This end user industry segment captures the external (outsourced) logistics expenditure incurred by the construction industry players, on road freight transport service. The end user players considered are the establishments primarily engaged in constructing, repairing and renovating residential & commercial buildings, infrastructure, engineering works, subdividing and developing land. Logistics Service Providers (LSPs) play a crucial role in increasing profitability of construction projects by maintaing the inventory of raw materials & equipment, time-critical supplies and by providing other value added services for effective project management.
- Containerized Road Freight Transport - The segment captures the external (outsourced) logistics expenditure incurred by the road freight transport service end users on Full-Truck-Load (FTL) services. FTL road freight transport is characterized as a full single load not combined with other shipments. It comprises of shipments (i) devoted to the goods of a single shipper (ii) taken directly from a point of origin to one or more destination points (iii) comprising of bulk mail truck transportation (iv) comprising of both Container (Full Container Load, FCL)/Non-Container trucking services (v)comprsing of goods requiring temperature controlled or non-temperature controlled transportation services (vi) comprising of bulk liquid tankering (vii) invoving trucking of waste (viii) hazardous material trucking. Related value added services (VAS) of sorting, consolidation, deconslidation are included in the other services segment of freight and logistics market.
- Export Trends and Import Trends - Overall logistics performance of an economy is positively and significantly (statistically) correlated to its trade performance (exports and imports). Hence, in this industry trend, total value of trade, major commodities/ commodity groups and the major trade partners, for the studied geography (country or region as per the scope of report) have been analysed alongside the impact of major trade/logistics infrastructure investments & regulatory environment.
- Fluid Goods - The segment captures the external (outsourced) logistics expenditure incurred by the road freight transport service end users for the transport of bulk liquids, that are often used in extraction, manufacturing, food processing, agriculture industries among others. It includes transportation of liquids like (i) Chemicals/ hazardous goods (for instance acids) (ii) Water (potable as well as waste) (iii) Oil and gas (upstream as well as downstream like gasoline, fuel, crude oil, or propane), (iv) Food grade bulk liquids (like milk, or juice), (v) Rubber, (vi) Agrichemical products, among others. These goods are generally transported through tanker trucking.
- Fuel Price - Fuel price spikes can cause delays and diruption for logistics service providers (LSPs), while drops in the same can result in higher short-term profitability and increased market rivalry to offer consumers with the best deals. Hence, the fuel price variations have been studied over the review period and presented along with the causes as well as market impacts.
- Full-Truck-Load (FTL) Road Freight Transport - The segment captures the external (outsourced) logistics expenditure incurred by the road freight transport service end users on Full-Truck-Load (FTL) services. FTL road freight transport is characterized as a full single load not combined with other shipments. It comprises of shipments (i) devoted to the goods of a single shipper (ii) taken directly from a point of origin to one or more destination points (iii) comprising of bulk mail truck transportation (iv) comprising of both Container (Full Container Load, FCL)/Non-Container trucking services (v)comprsing of goods requiring temperature controlled or non-temperature controlled transportation services (vi) comprising of bulk liquid tankering (vii) invoving trucking of waste (viii) hazardous material trucking. Related value added services (VAS) of sorting, consolidation, deconslidation are included in the other services segment of freight and logistics market.
- GDP Distribution by Economic Activity - Nominal Gross Domestic Product and distribution of the same, across major economic sectors in the geography studied (country or region as per scope of the report) have been studied and presented in this industry trend. As GDP is positively related to the profitability and growth of logistics industry, this data has been used in adjunction to the input-output tables/ supply-use tables for analyzing the potential major contributing sectors towards the logistics demand.
- GDP Growth by Economic Activity - Growth of Nominal Gross Domestic Product across major economic sectors, for the geography studied (country or region as per scope of the report) have been presented in this industry trend. This data has been utilized for assessing the growth of logistics demand from all the market end users (economic sectors considered here).
- Inflation - Variations in both Wholesale Price Inflation (YoY change in producer price index) and Consumer Price Inflation have been presented in this industry trend. This data has been used to assess the inflationary environment as it plays a vital role in smooth functioning of the supply chain, directly impacting the logistics operational cost components e.g., pricing of tyres, driver wages & benefits, energy/fuel prices, maintenace costs, toll charges, warehousing rents, custom brokerage, forwarding rates, courier rates etc. hence impacting the overall freight and logistics market.
- Key Industry Trends - The report section named "Key Industry Trends" include all the key variables/parameters studied to better analyze the market size estimates and forecasts. All the trends have been presented in the form of data points (time series or latest available data points) along with analysis of the paramter in the form of concise market relevant commentary, for the geography studied (country or region as per the scope of report).
- Key Strategic Moves - The action taken by a company to differentiate from its competitor or used as a general strategy is referred to as a key strategic move (KSM). This includes (1) Agreements (2) Expansions (3) Financial Restructuring (4) Mergers and Acquisitions (5) Partnerships, and (6) Product Innovations. Key players (Logistics Service Providers, LSPs) in the market have been shortlisted, their KSM have been studied and presented in this section.
- Less than-Truck-Load (LTL) Road Freight Transport - The segment captures the external (outsourced) logistics expenditure incurred by the road freight transport service end users on Less than-Truck-Load (LTL) services. LTL road freight transport is characterized as multiple shipments combined onto a single truck for multiple deliveries within a network. It comprises of establishments (i) primarily engaged in general and specialized freight trucking of less than complete truck-loads, (ii) characterized by the use of terminals to consolidate shipments, generally from several shippers, into a single truck for haulage between a load assembly terminal and a disassembly terminal, where the load is sorted and shipments are re-routed for delivery (iv) Less than-Container-Load (LCL) shipping/ Groupage Shipping in case of trucking services. The activities in scope include (i) local pick-up, (ii) line-haul, and (iii) local delivery. Related value added services (VAS) of sorting, consolidation, deconslidation are included in the other services segment of freight and logistics market.
- Logistics Performance - Logistics Performance and Logistics Costs are the backbone of trade, and influences trade costs, making countries compete globally. Logistics performance is influenced by market wide adopted supply chain management strategies, government services, investments & policies, fuel/ energy costs, inflationary environment etc. Hence, in this industry trend, the logistics performance of the geography studied (country/ region as per the scope of report) has been analysed and presented over the review period.
- Major Truck Suppliers - Market share of truck brands is influenced by factors like geographical preferences, portfolio of truck types, truck prices, local production, truck repair & maintenance service peneteration, customer support, technological innovations (like electric vehicles, digitalization, autonomous trucks), fuel efficiency, financing options, annual maintenance costs, availability of substitutes, marketing startegies etc. Hence, the distribution (share % for base year of the study) of truck sales volume for leading truck brands and commentary on current market scenario & market anticipation over the forecast period have been presented in this industry trend.
- Manufacturing - This end user industry segment captures the external (outsourced) logistics expenditure incurred by the Manufacturing industry players, on road freight transport service. The end user players considered are the establishments primarily engaged in the chemical, mechanical or physical transformation of materials or substances into new products. Logistics Service Providers (LSPs) play a crucial role in maintaining a smooth flow of raw materials across the supply chain, enabling timely delivery of finished goods to distributors or end customers and storing & supplying the raw materials to clients for just-in-time manufacturing.
- Modal Share - Freight Modal Share is influenced by factors like modal productivity, government regulations, containerization, distance of shipment, temperature control requirements, type of goods, international trade, terrain, speed of delivery, shipment weight, bulk shipments, etc. Also, modal share by tonnage (tons) and modal share by freight turnover (ton-km) differ as per average distance of shipments, weight of major commodity groups transported in the economy and number of trips. This industry trend represents the distribution of freight transported by mode of transport (tons as well as ton-km), for the study base year.
- Oil and Gas, Mining and Quarrying - This end user industry segment captures the external (outsourced) logistics expenditure incurred by the extraction industry players, on road freight transport service. The end user players considered are the establishments that extract naturally occurring mineral solids, such as coal and ores; liquid minerals, such as crude petroleum; and gases, such as natural gas. Logistics Service Providers (LSPs) covers entire phases from upstream to downstream and plays a crucial role in the transportation of machinery, drilling equipments, extracted minerals, crude oil & natural gas and refined/ processed products from one place to another.
- Other End Users - Other end user segment captures the external (outsourced) logistics expenditure incurred by the financial services (BFSI), real estate, educational services, healthcare, and professional services (administrative, waste management, legal, architectural, engineering, design, consulting, scientific R&D), on road freight transport service. Logistics Service Providers (LSPs) plays a crucial role in the reliable movement of supplies and documents to/from these industries such as transporting any equipment or resources required, shipping confidential documents and files, movement of medical goods & supplies (surgical supplies and instruments, including gloves, masks, syringes, equipment) to name a few.
- Producer Price Inflation - It indicates inflation from viewpoint of the producers viz. the average selling price received for their output over a period of time. Annual change (YoY) of producer price index is reported as wholesale price inflation in the "Inflation" industry trend. As WPI captures dynamic price movements in most comprehensive way, it is widely used by governments, banks, industry, business circles and is deemed important in formulation of trade, fiscal and other economic policies. The data has been used in adjunction to consumer price inflation for better understanding the inflationary environment.
- Road Freight Pricing Trends - Freight pricing by mode of transport (USD/tonkm), over the review period, has been presented in this industry trend. The data has been used in assessing the inflationary environment, impact on trade, freight turnover (tonkm), road freight transport market demand and hence the road freight transport market size.
- Road Freight Tonnage Trends - Freight tonnage (weight of goods in tons) handled by mode of transport, over the review period, has been presented in this industry trend. The data has been used as one of the parameters apart from average distance per shipment (km), freight volume (tonkm), and freight pricing (USD/tonkm) to assess the freight transport market size.
- Road Freight Transport - Hiring a road freight transport logistics service provider (LSP) or haulier (outsourced logistics), for the transport of commodities constitutes road freight transport market. The scope of study includes (i) road transport of goods reported by hauliers registered in the reporting countries (ii) transport of raw materials or manufactured goods (solids as well as fluids) (iii) transport using commerical motor vehicles (rigid trucks or tractor-trailers, (iv) Full-Truck-Load (FTL) or Less than-Truck-Load (LTL) transport (v) containerized or non-containerized transport (vi) temperature controlled or non-temperature controlled trasnport, (vii) short haul or long haul (Over-the-road, OTR) transport, (viii) used office or household goods transport (movers and packers), (ix) other specialized cargo transport (dangerous goods, oversized cargo) and (x) outsourced first mile/ middle mile/last mile delivery shipments undertaken by road freight transport players. The scope does not include (i) transport undertaken by hauliers registered in other countries (ii) last mile meal delivery market (iii) grocery delivery market (iv) transportation via road network undertaken/ reported by Courier, Express, and Parcel (CEP) players.
- Road Length - As infrastructure plays a vital role in an economy's logistics performance, variables like length of roads, distribution of road length by surface category (paved v/s unpaved), distribution of road length by road classification (expressways v/s highways v/s other roads), have been analysed and presented in this industry trend.
- Segmental Revenue - Segmental Revenue has been triangulated or computed and presented for all the major players in the market. It refers to the road freight transport market specific revenue earned by the company, over the base year of study, in the geography studied (country or region as per the scope of report). It is computed through the study and analysis of major parameters like financials, service portfolio, employee strength, fleet size, investments, number of countries present in, major economies of concern, etc. that have been reported by the company in its annual reports, webpage. For companies having scarce financial disclosures, paid databases like D&B Hoovers, Dow Jones Factiva have been resorted to and verified through industry/expert interactions.
- Short Haul Road Freight Transport - The segment captures the external (outsourced) logistics expenditure incurred by the road freight transport service end users on local trucking (less than 100 miles). It includes the road transport of goods (i) within a single administrative area and its hinterland, (ii) by smaller trucks and pickup trucks (iii) via containerized as well as dry bulk services (iv) intermodal from ports, container terminals or airports, and (v) outsourced first mile/ last mile delivery shipments undertaken by road freight transport players.
- Transport and Storage Sector GDP - Value and growth of Transport and Storage Sector GDP has a direct relation to the freight and logistics market size, and hence road freight transport market size. Therefore, this variable has been studied and presented over the review period, in value terms (USD) and as share % of total GDP, in this industry trend. The data has been supported by concise and relevant commentary around the investments, developments, and current market scenario.
- Trends in E-Commerce Industry - Enhanced internet connectivity and boom in smartphone penetration, coupled with increasing disposable incomes, has led to a phenomenal growth in the e-commerce market globally. Online shoppers require fast and efficient delivery of their orders leading to an increase in the demand for logistics services especially e-commerce fulfilment services. Hence, the Gross Merchandise Value (GMV), historial and projected growth, breakup of major commodity groups in e-commerce industry for the studied geography (country or region as per scope of the report) have been analysed and presented in this industry trend.
- Trends in Manufacturing Industry - Manufacturing industry involves the transformation of raw materials into finished products, while logistics industry ensures the efficient flow of raw materials to the factory, and the transport of manufactured products to the distributors & consumers. Demand-Supply of both industries are highly cross-linked and critical for a seamless supply chain. Hence, the Gross Value Added (GVA), breakup of GVA into major manufacturing sectors, and growth of manufacturing industry over the review period have been analysed and presented, in this industry trend.
- Trucking Fleet Size By Type - Market share of truck types is influenced by factors like geographical preferences, major end user industries, truck prices, local production, truck repair & maintenance service peneteration, customer support, technological disruptions (like electric vehicles, digitalization, autonomous trucks) etc. Hence, the distribution (share % for base year of study) of truck parc volume by type of truck, market disruptors, truck manufacturing investments, truck specifications, truck use & import regulations, and market anticipation over the forecast period have been presented in this industry trend.
- Trucking Operational Costs - The prime reasons for measuring/ benchmarking logistics performance of any trucking company are to reduce operational costs and increase profitability. On the other hand, measuring operational costs helps to identify whether and where to make operational changes to control expenses and identify areas for improved performance. Hence, in this industry trend, trucking operational costs and the variables involved viz. driver wages & benefits, fuel prices, repairs & maintenance costs, tyre costs etc. have been studied over the base year of study, and presented for the geography studied (country or region as per the scope of report).
- Wholesale and Retail Trade - This end user industry segment captures the external (outsourced) logistics expenditure incurred by the wholesalers and retailers, on road freight transport service. The end user players considered are the establishments primarily engaged in wholesaling or retailing merchandise, generally without transformation, and rendering services incidental to the sale of merchandise. Logistics Service Providers (LSPs) plays a crucial role in the reliable movement of supplies to and finished products from production houses to the distributors and finally to the end customer covering activites like material sourcing, transportation, order fulfillment, warehousing & storage, demand forecasting, inventory management etc.
| Keyword | Definition |
|---|---|
| Cabotage | Road transport by a motor vehicle registered in a country performed on the national territory of another country. |
| Cross Docking | Cross docking is a logistics procedure where products from a supplier or manufacturing plant are distributed directly to a customer or retail chain with marginal to no handling or storage time. Cross docking takes place in a distribution docking terminal; usually consisting of trucks and dock doors on two (inbound and outbound) sides with minimal storage space. The name ‘cross docking’ explains the process of receiving products through an inbound dock and then transferring them across the dock to the outbound transportation dock. |
| Cross Trade | International road transport between two different countries performed by a road motor vehicle registered in a third country. A third country is a country other than the country of loading/embarkation and than the country of unloading/disembarkation. |
| Dangerous Goods | The classes of dangerous goods carried by Road are those defined by the fifteenth revised edition of the UN Recommendations on the Transport of Dangerous Goods, United Nations, Geneva 2007. They include Class 1: Explosives; Class 2: Gases; Class 3: Flammable Liquids; Class 4: Flammable solids- substances liable to spontaneous combustion; substances which, on contact with water, emit flammable gases; Class 5: Oxidizing substances and organic peroxides; Class 6: Toxic and infectious substances; Class 7: Radioactive material and Class 8: Corrosive substances, Class 9: Miscellaneous dangerous substances and articles. |
| Direct Shipment | Direct shipment is a method of delivering goods from the supplier or the product owner to the customer directly. In most cases, the customer orders the goods from the product owner. This delivery scheme reduces transportation and storage costs, but requires additional planning and administration. |
| Drayage | A drayage is a form of trucking service that connects the different modes of shipping (intermodal), such as ocean freight or air freight. It’s a short-haul trip that transports goods from one place to another, usually before or after its long-haul shipping process. Drayage trucks move cargo to and from various destinations, such as container ships, storage lots, order fulfillment warehouses, and rail yards. Typically, drayage only transports goods in short distances and operates only in one metropolitan area. It also requires only one trucker in a single shift. But despite this, but it plays an important role in long-haul shipping because it gets the goods to the cargo and vice versa. It makes intermodal transport much more efficient and enables the seamless transfer of goods to the end customer. |
| Dry van | A dry van is a type of semi-trailer that's fully enclosed to protect shipments from outside elements. Designed to carry palletized, boxed or loose freight, dry vans aren't temperature-controlled (unlike refrigerated “reefer” units) and can't carry oversized shipments (unlike flatbed trailers). |
| Final Demand | Final demand includes all types of commodities (goods as well as services) consumed as final use and might include personal consumption, or consumption by government, by businesses as capital investment, and as exports. includes all types of commodities (goods as well as services) consumed as final use and might include personal consumption, or consumption by government, by businesses as capital investment, and as exports. |
| Flatbed Truck | A flatbed truck is a type of truck with rigid design. It has a back body that is flatly shaped for easy loading and unloading of goods. The flatbed truck is mostly used to transport heavy, oversized, wide and indelicate goods such as machinery, building supplies or equipment. Due to the truck open body, the goods transported with it must not be vulnerable to rain. By functionality, the flatbed truck is comparable to a flatbed trailer. |
| Inbound Logistics | Inbound logistics is the way materials and other goods are brought into a company. This process includes the steps to order, receive, store, transport and manage incoming supplies. Inbound logistics focuses on the supply part of the supply-demand equation. |
| Intermediate Demand | Intermediate demand includes goods, services, and maintenance and repair construction sold to businesses, excluding capital investment. |
| International Loaded | Place of loading of goods in reporting country (i.e., country in which the vehicle performing the transport is registered) and place of unloading in a different country. |
| International Unloaded | Place of unloading of goods in reporting country (i.e., country in which the vehicle performing the transport is registered) and place of loading in a different country. |
| OOG cargo | Out of Gauge (OOG) cargo is any cargo that can not be loaded into six-sided shipping containers simply because it is too large. The term is a very loose classification of all cargo with dimensions beyond the maximum 40HC container dimensions. That is a length beyond 12.05 meters – a width beyond 2.33 meters – or a height beyond 2.59 meters. |
| Pallets | Raised platform, intended to facilitate the lifting and stacking of goods. |
| Part load | A part load describes goods which only fills a truck partially. In essence, the quantity of the shipment is bigger than the Less Than Truckload (LTL) shipment. Also, the shipment cannot fully occupy a truck i.e. its capacity is much lower than a Full Truckload (FTL) shipment. |
| Paved Road | Road surfaced with crushed stone (macadam) with hydrocarbon binder or bituminized agents, with concrete or with cobblestone. |
| Reverse Logistics | Reverse logistics comprises of the sector of supply chains that process anything returning inwards through the supply chain or traveling ‘backward’ through the supply chain. |
| Road Freight Transport Service | Hiring a trucking agency for transport of commodities (raw materials or manufactured goods including both solids and liquids) form the origin to a destination within the country (domestic) or cross-border (international) constitutes road freight transport market. The service might be Full-Truck-Load or Less than-Truck-Load, containerized or non-containerized, temperature controlled or non temperature controlled, short haul or long haul. |
| Tautliner vehicle | Tautliner and curtainsider are used as generic names for curtain sided trucks/trailers. The curtains are permanently fixed to a runner at the top and detachable rails/poles at front and rear, allowing the curtains to be drawn open and forklifts used all along the sides for easy and efficient loading and unloading. When closed for travel, vertical load restraint straps are attached to a rope rail beneath the truck bed, connecting the truck bed and curtain along both sides. Winches at either end of the curtain tension it, hence the 'Tautliner' name. This stops the curtain from flapping or drumming in the wind and can also help retain light loads from slipping sideways. |
| Transport for hire or reward | The carriage for remuneration of goods. |
| Unpaved Road | Road with a stabilized base not surfaced with crushed stone, hydrocarbon binder or bituminized agents, concrete or cobblestone. |


Research Methodology
Mordor Intelligence follows a four-step methodology in all our reports.
- Step-1: Identify Key Variables: In order to build a robust forecasting methodology, the variables and factors identified in Step-1 are tested against available historical market numbers. Through an iterative process, the variables required for market forecast are set and the model is built on the basis of these variables.
- Step-2: Build a Market Model: Market-size estimations for the forecast years are in nominal terms. Inflation is considered to be a part of the pricing, and the average selling price (ASP) is varying throughout the forecast period for each country
- Step-3: Validate and Finalize: In this important step, all market numbers, variables and analyst calls are validated through an extensive network of primary research experts from the market studied. The respondents are selected across levels and functions to generate a holistic picture of the market studied.
- Step-4: Research Outputs: Syndicated Reports, Custom Consulting Assignments, Databases & Subscription Platforms


