Nordics Freight And Logistics Market Size and Share
Market Overview
| Study Period | 2018 - 2031 |
|---|---|
| Forecast Data Period | 2026 - 2031 |
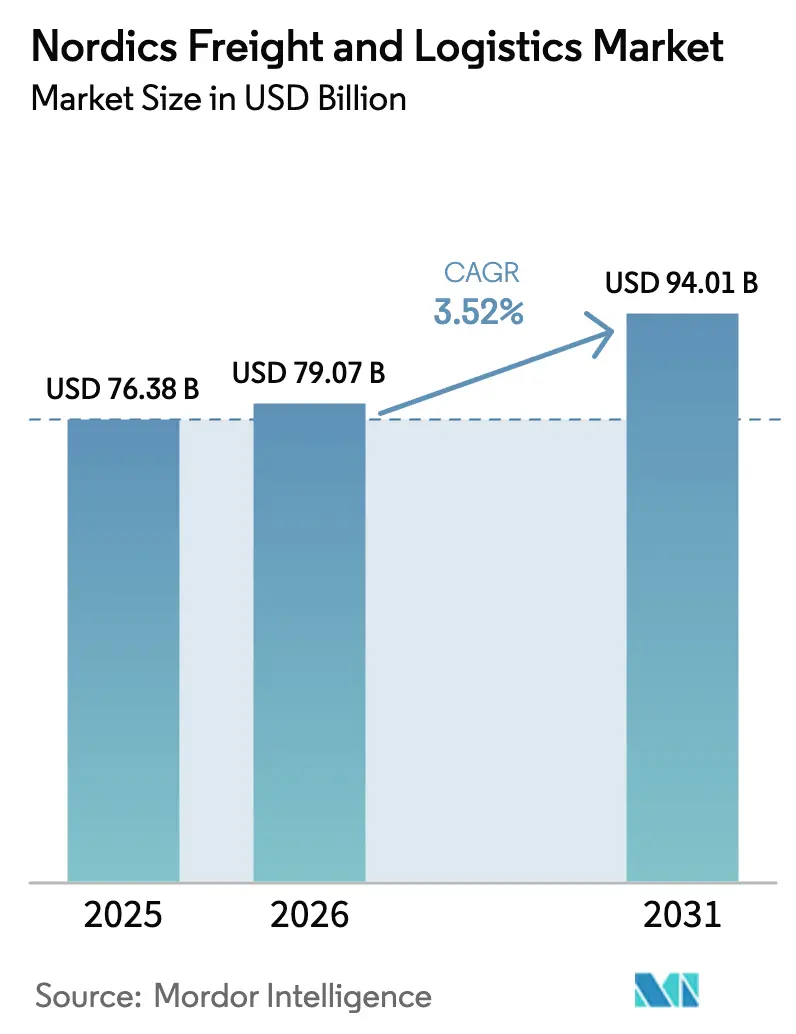
| Base Year Market Size (2025) | USD 76.38 Billion |
| Market Size (2026) | USD 79.07 Billion |
| Market Size (2031) | USD 94.01 Billion |
| Growth Rate (2026 - 2031) | 3.52% CAGR |
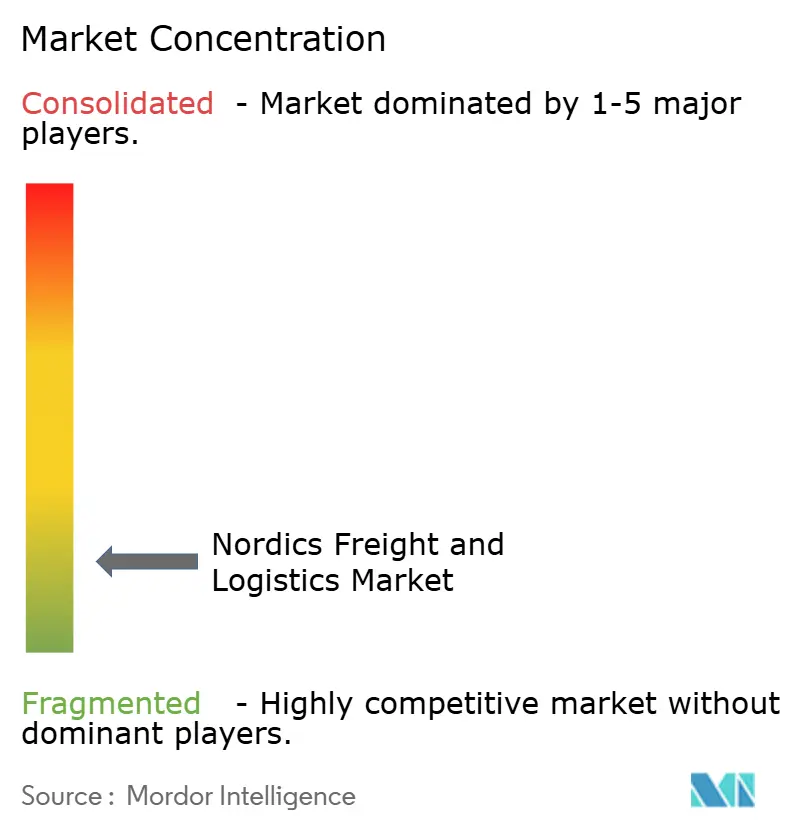
| Market Concentration | Low |
Major Players *Disclaimer: Major Players sorted in no particular order Image © Mordor Intelligence. Reuse requires attribution under CC BY 4.0. | |
Nordics Freight And Logistics Market Analysis by Mordor Intelligence
The Nordics freight and logistics market size is expected to grow from USD 76.38 billion in 2025 to USD 79.07 billion in 2026 and is forecast to reach USD 94.01 billion by 2031 at 3.52% CAGR over 2026-2031. This growth pace is underpinned by the region’s role as a land-bridge between Europe, North America, and Asia, a robust digital backbone that enables real-time supply-chain orchestration, and environmental policies that steadily redirect cargo toward low-emission modes. E-commerce, now accounting for well over one-third of B2C retail spending in Sweden, injects dense parcel flows that reshape last-mile networks, while the offshore-wind build-out fuels demand for heavy-lift project cargo logistics. Parallel rail-infrastructure upgrades, notably Sweden’s Norrbotniabanan and Malmbanan programs, raise freight-train capacity and lower per-unit costs, thereby nudging a modal shift away from road. Tightening European Union carbon-pricing rules, alongside zero-emission vehicle incentives, are already visible in freight-rate structures, prompting shippers to reassess modal mixes and contract tenors.
Key Report Takeaways
- By logistics function, freight transport led with 62.78% of the Nordics freight and logistics market share in 2025; courier, express, and parcel (CEP) services are forecast to expand at a 4.08% CAGR between 2026-2031.
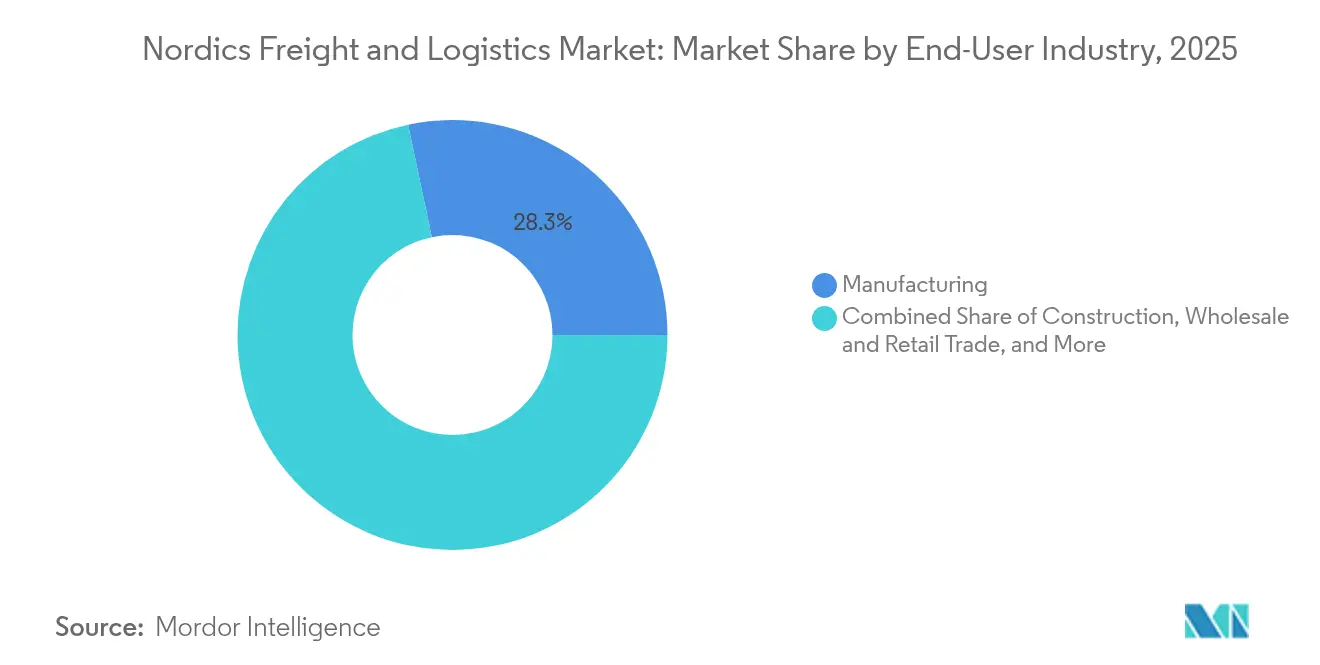
- By end user industry, manufacturing held 28.31% of the Nordics freight and logistics market size in 2025; wholesale and retail trade is projected to grow at a 3.88% CAGR between 2026-2031.
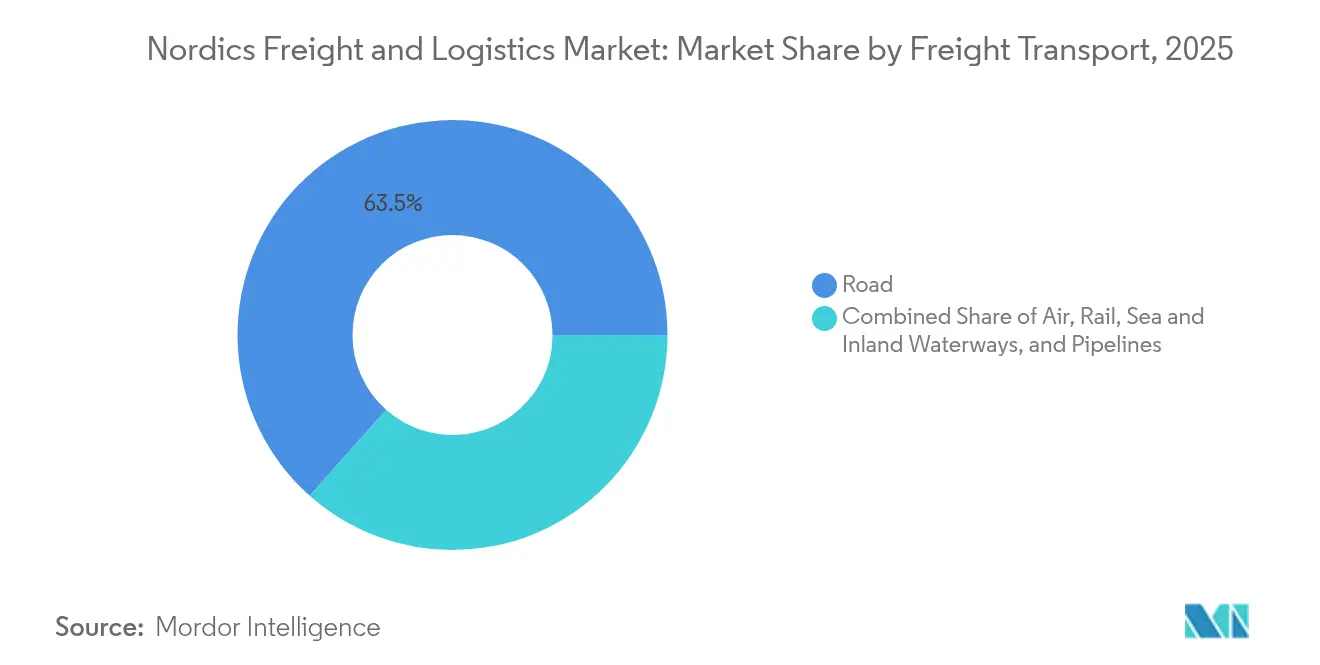
- By freight transport mode, road freight accounted for a 63.45% share in 2025; sea and inland waterways freight are expected to rise at a 4.02% CAGR between 2026-2031.
- By CEP destination, domestic CEP services captured a 64.12% share in 2025; international flows are anticipated to post a 4.21% CAGR between 2026-2031.
- By warehousing and storage, non-temperature controlled facilities dominated with 91.15% share in 2025; temperature-controlled space is forecast to expand at a 3.44% CAGR between 2026-2031.
- By freight forwarding mode, sea and inland waterways freight forwarding held a 65.20% share in 2025; air freight forwarding is poised to grow at a 3.28% CAGR between 2026-2031.
- By country, Sweden commanded a 35.01% share in 2025; Finland is set to advance at a 3.67% CAGR between 2026-2031.
Note: Market size and forecast figures in this report are generated using Mordor Intelligence’s proprietary estimation framework, updated with the latest available data and insights as of 2026.
Nordics Freight And Logistics Market Trends and Insights
Drivers Impact Analysis*
| Driver | (~) % Impact on CAGR Forecast | Geographic Relevance | Impact Timeline |
|---|---|---|---|
| Rapid e-commerce parcelisation | +0.8% | Nordic-wide; strongest in Sweden and Denmark | Short term (≤ 2 years) |
| Offshore wind build-out boosting project cargo | +0.6% | Denmark, Sweden, Norway coastal regions | Medium term (2-4 years) |
| Rail-friendly policy and 740-m siding upgrades | +0.4% | Sweden, Finland, Norway | Long term (≥ 4 years) |
| Zero-emission heavy-truck incentives (HVO/BEV/H₂) | +0.5% | Nordic-wide; early adoption in Norway | Medium term (2-4 years) |
| Green-Corridor maritime funding | +0.3% | Baltic Sea routes, major ports | Long term (≥ 4 years) |
| AI-enabled dynamic pricing and load-pooling | +0.2% | Nordic-wide; concentrated in major hubs | Short term (≤ 2 years) |
| Source: Mordor Intelligence | |||


Rapid E-commerce Parcelization Drives CEP Expansion
Domestic online spending continues to climb, propelling the Nordics freight and logistics market CEP volumes well past pre-pandemic peaks. Local surveys show Swedish consumers preferring pickup points, whereas Norwegian shoppers favor door delivery, compelling operators to fine-tune last-mile routing and micro-fulfillment footprints[1]Nordic Innovation, “Nordic Smart Mobility and Connectivity,” nordicinnovation.org. Parcel machines and in-car boot deliveries proliferate in urban clusters, shrinking failed-delivery ratios by double-digit percentages. Sortation centers increasingly deploy vision-guided robotics that lift throughput by 20% while trimming unit labor costs. Cold-chain parcel traffic also rises as fresh-food platforms scale, requiring carriers to roll out multi-temperature fleets and insulated lockers. Together, these shifts lock in a durable parcel-volume growth path that sustains the segment’s growth.
Offshore Wind Build-out Creates Specialized Project-Cargo Opportunities
More than 20 GW of offshore-wind projects are slated for installation in Nordic waters by 2030, triggering a surge in turbine-blade, nacelle, and monopile moves that seldom fit standard freight networks[2]Ship & Bunker, “EU Launches €8 Million Funding for Zero-Emission Maritime Projects,” shipandbunker.com. Heavy-lift demand pushes day-rates for jack-up vessels to record highs, and port-side lay-down areas are fast reaching capacity. Integrated logistics providers that can pool feeder vessels, coordinate weather windows, and assure just-in-time component sequencing secure margin premiums. Denmark’s Esbjerg port is doubling heavy-load-out quay space, while Swedish Gulf of Bothnia ports race to add reinforced quays. Despite bottlenecks, specialized players maintain high utilization, making the project-cargo niche a resilient profit pool.
Rail Infrastructure Modernization Enables Modal Shift
Sweden’s SEK 155 billion (USD 15.4 billion) rail-upgrade package funds double-tracking, 740 m passing loops, and automated traffic management along the north–south spine, lifting corridor capacity for bulk and intermodal trains by an estimated 40%[3]Trafikverket, “National Transport Plan,” trafikverket.se. Harmonized axle-load standards cut interface frictions at the Finnish and Norwegian borders, accelerating cross-border freight times. Improved reliability, together with EU carbon-pricing escalation, tilts door-to-door comparisons in rail’s favor for distances above 600 km. Forwarders respond by bundling block-train services that guarantee 95% on-time performance, luring high-value electronics and automotive cargo away from the road. The upgrades thus widen rail’s modal share prospects beyond its current 19% threshold.
Zero-Emission Vehicle Incentives Accelerate Fleet Transformation
Norway exempts battery-electric heavy trucks from road tolls, ferry fees, and purchase tax, yielding total-cost-of-ownership parity with diesel for mileage-dense urban routes. Sweden pilots battery-swap depots along the E4 corridor, cutting dwell times to parity with diesel refueling[4]MDPI, “Competition Between Geographically Spread Charge Point Operators for Battery Electric Trucks,” mdpi.com. Hydrogen fuel-cell trials on 44-ton rigs demonstrate 600 km real-world range in winter conditions, narrowing payload penalties that hamper electric trucks. Bridge operators on the Øresund and Storebælt corridors extend 13% discounts to Euro 6 and zero-emission trucks, nudging large fleets toward early adoption. As fleets retire Euro 5 trucks, OEM order books for BEVs and FCVs stretch into late 2026, indicating structural demand momentum.
Restraints Impact Analysis*
| Restraint | (~) % Impact on CAGR Forecast | Geographic Relevance | Impact Timeline |
|---|---|---|---|
| Truck-driver shortage >20 % by 2027 | -0.7% | Nordic-wide; acute in Sweden and Norway | Short term (≤ 2 years) |
| Port grid-capacity bottlenecks | -0.4% | Major ports in Denmark, Sweden, Finland | Medium term (2-4 years) |
| Rising road-toll and carbon-pricing pass-through | -0.3% | Cross-border routes, urban areas | Short term (≤ 2 years) |
| Baltic Sea sulphur-cap cost gap | -0.2% | Baltic Sea shipping routes | Medium term (2-4 years) |
| Source: Mordor Intelligence | |||
Truck-Driver Shortage Constrains Capacity Growth
With only 5% of European truck drivers younger than 25, retirement attrition eclipses recruitment, leaving 745,000 seats unfilled across Europe and a forecast regional shortfall exceeding 20% by 2027. High living costs in Nordic capitals compound the wage hurdle, while cabotage limits curb the import of lower-cost labor. Larger fleets pilot autonomous convoy trials on the E6, yet regulatory clearance remains years away. Hub-and-spoke routing, double-stack swap-body combinations, and increased trailer lengths cushion capacity gaps but cannot offset the labor deficit entirely. Consequently, road-freight spot rates have risen 6-8 % year-on-year since 2024, accelerating the shift toward rail and coastal short-sea solutions.
Port Grid-Capacity Bottlenecks Limit Electrification
Ambitious shore-power deadlines collide with constrained grid infrastructure at Nordic deep-sea terminals. Copenhagen Malmö Port’s plan to electrify three container berths stalls while awaiting a 130 MW sub-station, and similar delays ripple through Gothenburg and Helsinki. Vessel operators face berth-allocation conflicts, paying premiums for the few plugs available. Cargo diversion to ports with scalable grid access, such as Aarhus, underlines the competitive stakes. Until grid-expansion projects materialize, shipping lines burn additional low-sulphur fuel to comply with berth emission limits, inflating voyages by EUR 5–8 (USD 5.5-8.8)/TEU on average.
*Our forecasts treat driver/restraint impacts as directional, not additive. The impact forecasts reflect baseline growth, mix effects, and variable interactions.
Segment Analysis
By End User Industry: Manufacturing Leadership Challenged by Retail Growth
Manufacturing commanded 28.31% of the Nordics freight and logistics market share in 2025, driven by automotive, pulp-and-paper, and precision-machinery exports. Stable production volumes, predictable routing, and supplier-park clustering yield high trailer turn-rates that underpin freight-contract stickiness. However, the wholesale and retail trade’s 3.88% CAGR (2026-2031) signals a power shift. Online fashion retailers run seven order cycles daily, demanding granular inventory allocation and urban cross-dock proximity. Return-logistics loops, now exceeding 15% of retail parcel volumes, create specialized flows that legacy manufacturing networks rarely encounter.
Oil and Gas, Mining and Quarrying sustain outsized equipment flows to Norway’s continental-shelf projects, while Construction freight rises in tandem with green-building mandates across Nordic capitals. Agriculture, Fishing, and Forestry retains importance for reefer and bulk carriers, particularly on Iceland–EU seafood lanes. Emerging technology-hardware distribution gains traction as Nordic data-center clusters attract cloud hyperscalers, adding high-value air-freight demand layers.


By Logistics Function: Freight Transport Dominates Despite CEP Acceleration
Freight Transport generated 62.78% of the Nordics freight and logistics market revenue in 2025, anchored by bulk-commodity flows and cross-border industrial shipments. The segment’s stability rests on integrated road–sea–rail corridors that knit Sweden’s manufacturing belts to continental hubs. Yet CEP’s 4.08% CAGR (2026-2031) challenges incumbents; parcel hubs routinely process 350,000 items per shift, spurring robotics deployments that lift sort speeds by 30%. Traditional forwarders roll out time-definite LTL parcel bundles to defend share, while digital platforms aggregate empty capacity across small carriers. As shippers demand real-time ETA visibility, AI-enabled load pooling compresses deadhead miles by up to 15%, trimming emissions and costs.
Other logistics functions follow divergent paths. Warehousing occupancy remains above 96% in metropolitan Stockholm, pushing developers to retrofit brownfield sites into multistory facilities with mezzanine pick towers. Customs-clearance automation dovetails with the region’s single-window platform, cutting documentation lead times to under 15 minutes. Freight Forwarding adapts by embedding carbon accounting into quoting tools, a prerequisite for ESG-focused manufacturers. Collectively, these dynamics sustain Freight Transport’s dominance yet pave pathways for CEP-led revenue diversification.
By CEP Destination: Domestic Services Lead International Growth
Domestic CEP streams captured 64.12% of the revenue share in 2025, bolstered by the region’s customs-union features and consumer proximity. Advanced network density allows carriers to achieve sub-two-hour delivery windows in major cities, stimulating demand for ultra-same-day services. International CEP’s faster 4.21% CAGR (2026-2031) stems from cross-border e-commerce platforms tapping the Nordics’ high disposable incomes. Digitoll roll-out, though delayed to 2026, ultimately promises frictionless customs clearance, cutting dwell times at borders by 40%. VAT on E-Commerce (VOEC) rules simplify duties on consignments under EUR 150 (USD 165.5), encouraging SME exporters.
Service differentiation hinges on pickup-point coverage; Swedish networks now average one locker within 350 m walking distance for 78% of the urban population. Norwegian home-delivery preference drives route-optimization investments that shave 12 % off delivery kilometers. International lanes rely heavily on air-freight line-hauls to East Asian hubs, where Nordic-branded consumer goods command premium prices.
By Warehousing and Storage: Automation Drives Cold-Chain Growth
Non-temperature-controlled facilities retained 91.15% of the revenue share in 2025, serving FMCG, industrial spare parts, and apparel flows. Vacancy rates in prime locations sit below 2%, catalyzing speculative multistory builds near Copenhagen and Stockholm. Temperature-controlled capacity, while smaller, is scaling at 3.44% CAGR (2026-2031) as pharma, biotech, and online grocery sectors proliferate. Operators deploy multi-temperature AutoStore grids that condense footprint by 60% versus conventional racking, achieving ROI within four years.
Cold-chain reliability standards rise; GDP-compliant hubs record temperature deviations under 0.2°C, minimizing spoilage risks. IoT sensors feed data into blockchain ledgers, ensuring immutable traceability for high-value biologics. Energy-cost inflation spurs rooftop solar-battery hybrids that trim warehouse power bills by 18%. These investments increase the segment’s resilience and attractiveness to institutional investors.
By Freight Transport Mode: Road Dominance Faces Modal Shift Pressure
Road transport contributed 63.45% to the revenue share in 2025, leveraging dense highway grids and high schedule flexibility. Yet the combination of driver shortages, 12 % average toll hikes, and diesel-exemption rollbacks erodes cost advantages. Sea and inland waterways freight, benefiting from green-corridor funding, posts the fastest 4.02% CAGR (2026-2031); RoRo operators introduce methanol-ready ferries, trimming CO₂ emissions by 65% relative to 2020 baselines. Rail’s capacity boost from 740 m sidings permits 25% longer trains, cutting per-ton-kilometer costs and courting retail and automotive volumes that historically moved on roads.
Air-freight tonnage rebounds on the back of semiconductor, biotech, and premium seafood exports, commanding rate premiums despite elevated fuel surcharges. Pipelines maintain flat growth, reflecting mature hydrocarbon networks and gradual energy transition policies. Mode-selection algorithms now weigh carbon taxes explicitly, reshaping routing matrices away from diesel-intensive legs.
By Freight Forwarding Mode: Maritime Dominance Meets Air Growth
Sea and inland waterways freight forwarding dominated with a 65.20% share in 2025, supported by competitive feeder services that link Gothenburg, Aarhus, and Hamburg within 24 hours. EU ETS inclusion raises compliance costs by EUR 85–100 (USD 93.8-110.3)/TEU, but carriers offset through efficiency, slow steaming, and alternative-fuel surcharges. Air freight forwarding’s 3.28% CAGR (2026-2031) rides on high-value Nordic exports—precision instruments, salmon, and cell-therapy shipments—requiring end-to-end visibility and active temperature control.
Digital twin technology now simulates vessel arrival times with 98% accuracy, enabling forwarders to pre-book terminal slots and truck pickups, shrinking dwell times by 15%. Multimodal forwarding gains traction as shippers request carbon-footprint transparency, pushing providers to bundle rail and sea legs. Green-corridor subsidies covering up to 30% of incremental fuel costs accelerate the deployment of ammonia-ready vessels on Baltic routes.
Geography Analysis
Sweden commanded 35.01% of the Nordics freight and logistics market revenue in 2025, leveraging manufacturing clusters around Gothenburg and Stockholm that generate steady container flows. Norrbotniabanan rail upgrades ease bottlenecks on the Lulea–Umea corridor, unlocking new timber and mineral export volumes. Sweden’s progressive carbon-pricing, USD 193/ton in 2025, nudges shippers toward rail and short-sea options, reinforcing the modal-shift trend.
Finland posts the region’s quickest 3.67% CAGR (2026-2031), buoyed by Baltic trade and a burgeoning tech-hardware export sector centered in Espoo. Port of Helsinki’s capacity expansion to 2.1 million TEUs integrates seamlessly with upgraded rail spurs, trimming hinterland transit by 12 hours. Customs digitalization and TEN-T investments align with Arctic-route opportunities, positioning Finland as a gateway for Asia–Europe flows.
Norway’s freight patterns remain defined by energy exports and mountainous geography. Offshore-wind and oil-platform project cargo sustains heavy-lift demand, while food exports drive reefer capacity. Outside the EU, Norway negotiates separate ETS alignment terms, creating dual compliance processes that complicate forwarder operations.
Competitive Landscape
The market is fragmented; however, DSV’s EUR 14.3 billion (USD 15.8 billion) acquisition of DB Schenker in April 2025 reshaped global forwarding rankings and cemented Nordic market leadership, with a workforce topping 146,000. Synergy roadmaps aim to double operating earnings by 2028, leveraging shared IT stacks and cross-selling opportunities. Mid-tier players such as PostNord and NTG counter with sector specialization—temperature-controlled e-commerce and Nordic–Baltic shuttle services—to retain share.
Sustainability emerges as a deal-clincher; CEVA’s FORPLANET sub-brand deploys 23 battery-electric trucks and publishes lane-level CO₂ dashboards, winning grocery-chain contracts demanding certified zero-emission delivery. DFDS positions its methanol-ready RoPax newbuilds for the Oslo–Copenhagen route, targeting 50% emission reductions. Financial institutions support decarbonization; SEB allocates SEK 51 billion (USD 5.05 billion) in shipping finance, tied to a 41% emissions-intensity cut pledge by 2030.
Digitization remains a competitive lever. Ongoing WMS integrates with DB Schenker Norway, offering SMEs API-driven inventory snapshots. AI-assisted pricing engines scour market indices to set spot rates, reducing quote turnarounds to under one hour. These features, paired with ESG transparency, differentiate providers in bid tenders increasingly weighted 30% on sustainability criteria.
Nordics Freight And Logistics Industry Leaders
DSV A/S (Including DB Schenker)
A.P. Moller - Maersk
DHL Group
PostNord Sverige AB
Kuehne+Nagel
- *Disclaimer: Major Players sorted in no particular order

Recent Industry Developments
- April 2025: DSV completed its EUR 14.3 billion (USD 15.8 billion) purchase of DB Schenker, creating the world’s largest freight forwarder.
- February 2025: CEVA Logistics deployed 23 new electric trucks across Europe under its FORPLANET banner, extending its Ferrari partnership to 2030.
- November 2024: Nurminen Logistics acquired Essinge Rail, expanding intermodal capacity between Finland and central Europe.
- July 2024: Maersk opened a 20,000 m² warehouse in Fredericia, Denmark, featuring automation and energy-efficient systems for regional e-commerce distribution.


Nordics Freight And Logistics Market Report Scope
Agriculture, Fishing, and Forestry, Construction, Manufacturing, Oil and Gas, Mining and Quarrying, Wholesale and Retail Trade, Others are covered as segments by End User Industry. Courier, Express, and Parcel (CEP), Freight Forwarding, Freight Transport, Warehousing and Storage are covered as segments by Logistics Function. Denmark, Finland, Iceland, Norway, Sweden are covered as segments by Country.| Agriculture, Fishing, and Forestry |
| Construction |
| Manufacturing |
| Oil and Gas, Mining and Quarrying |
| Wholesale and Retail Trade |
| Others |
| Courier, Express, and Parcel (CEP) | By Destination Type | Domestic |
| International | ||
| Freight Forwarding | By Mode of Transport | Air |
| Sea and Inland Waterways | ||
| Others | ||
| Freight Transport | By Mode of Transport | Air |
| Pipelines | ||
| Rail | ||
| Road | ||
| Sea and Inland Waterways | ||
| Warehousing and Storage | By Temperature Control | Non-Temperature Controlled |
| Temperature Controlled | ||
| Other Services | ||
| Denmark |
| Finland |
| Iceland |
| Norway |
| Sweden |
| End User Industry | Agriculture, Fishing, and Forestry | ||
| Construction | |||
| Manufacturing | |||
| Oil and Gas, Mining and Quarrying | |||
| Wholesale and Retail Trade | |||
| Others | |||
| Logistics Function | Courier, Express, and Parcel (CEP) | By Destination Type | Domestic |
| International | |||
| Freight Forwarding | By Mode of Transport | Air | |
| Sea and Inland Waterways | |||
| Others | |||
| Freight Transport | By Mode of Transport | Air | |
| Pipelines | |||
| Rail | |||
| Road | |||
| Sea and Inland Waterways | |||
| Warehousing and Storage | By Temperature Control | Non-Temperature Controlled | |
| Temperature Controlled | |||
| Other Services | |||
| Country | Denmark | ||
| Finland | |||
| Iceland | |||
| Norway | |||
| Sweden | |||


Market Definition
- Agriculture, Fishing, and Forestry (AFF) - This end user industry segment captures the external (outsourced) logistics expenditure incurred by the AFF industry players. The end user players considered are the establishments primarily engaged in growing crops, raising animals, harvesting timber, harvesting fish & other animals from their natural habitats and providing related support activities. Herein, Logistics Service Providers (LSPs) play a crucial role in acquisition, storage, handling, transportation, and distribution activities for the optimal & continuous flow of inputs (seeds, pesticides, fertilizers, equipment, and water) from manufacturers or suppliers to the producers and smooth flow of output (produce, agro-goods) to distributors/ consumers. This includes both termperature controlled and non-temperature controlled logistics, as and when required according to the shelf life of goods being transported or stored.
- Construction - This end user industry segment captures the external (outsourced) logistics expenditure incurred by the construction industry players. The end user players considered are the establishments primarily engaged in constructing, repairing and renovating residential & commercial buildings, infrastructure, engineering works, subdividing and developing land. Logistics Service Providers (LSPs) play a crucial role in increasing profitability of construction projects by maintaing the inventory of raw materials & equipment, time-critical supplies and by providing other value added services for effective project management.
- Courier, Express, and Parcel - The Courier, Express, and Parcel services, often called as CEP Market, refers to the logistics and postal service providers which specialize in moving small goods (parcels/packages). It captures the overall market size (USD) and market volume (number of parcels) of (1) the shipments/parcels/packages which are under 70kgs/ 154lbs weight, (2) Business Customer packages viz. Business-to-Business (B2B) & Business-to-Consumer (B2C) as well as private customer packages (C2C), (3) non-express parcel delivery services (Standard and Deferred) as well as express parcel delivery services (Day-Definite-Express and Time-Definite-Express), (4) domestic as well as international parcels.
- Demographics - To analyse total addressable market demand, population growth & forecasts have been studied and presented in this industry trend. It represents population distribution across categories like gender (male/female), development area (urban/rural), major cities among other key parameters like population density and final consumption expenditure (growth and share % of GDP). This data has been used for assessing the fluctations in demand & consumption expenditure, and the major hotspots (cities) of potential demand.
- Export Trends and Import Trends - Overall logistics performance of an economy is positively and significantly (statistically) correlated to its trade performance (exports and imports). Hence, in this industry trend, total value of trade, major commodities/ commodity groups and the major trade partners, for the studied geography (country or region as per the scope of report) have been analysed alongside the impact of major trade/logistics infrastructure investments & regulatory environment.
- Freight Forwarding - Freight forwarding which herein refers to the freight transportation arrangement (FTA) industry includes establishments primarily engaged in arranging & tracking transportation of freight between shippers and carriers. Logistics Service Providers (LSPs) considered are freight forwarders, NVOCCs, custom brokers and marine shipping agents. Others segment under Freight Forwarding captures the revenue earned through value added services of FTA like custom brokerage/clearance activities, preparation of freight related documentation, consolidation-deconsolidation of goods, cargo insurance & compliance, arrangement of warehousing & storage, liasing with shippers, and freight forwarding through other modes of transport viz. road and rail.
- Freight Pricing Trends - Freight pricing by mode of transport (USD/tonkm), over the review period, has been presented in this industry trend. The data has been used in assessing the inflationary environment, impact on trade, freight turnover (tonkm), freight and logistics market demand by mode of transport segments and hence the overall freight and logistics market size.
- Freight Tonnage Trends - Freight tonnage (weight of goods in tons) handled by mode of transport, over the review period, has been presented in this industry trend. The data has been used as one of the parameters apart from average distance per shipment (km), freight volume (tonkm), and freight pricing (USD/tonkm) to assess the freight transport market size.
- Freight Transport - Freight Transport refers to the hiring of a logistics service provider (outsourced logistics) for the transport of commodities (raw materials/final/intermediate/finished goods including both solids and fluids) from the origin to a destination within the country (domestic) or cross-border (international).
- Freight and Logistics - External expenditure on (or outsourced) facilitation of freight transport (freight transportation), arrangement of freight transport through an agent (freight forwarding), warehousing and storage (temperature controlled or non-temperature controlled), CEP (domestic or international courier, express and parcel) and other value-added logistics services involved in the transportation of commodities (raw materials or finished goods including both solids and fluids) from the origin to a destination within the country (domestic) or cross-border (international), through one or more modes of transportation viz. road, rail, sea, air and pipelines constitute freight and logistics market.
- Fuel Price - Fuel price spikes can cause delays and diruption for logistics service providers (LSPs), while drops in the same can result in higher short-term profitability and increased market rivalry to offer consumers with the best deals. Hence, the fuel price variations have been studied over the review period and presented along with the causes as well as market impacts.
- GDP Distribution by Economic Activity - Nominal Gross Domestic Product and distribution of the same, across major economic sectors in the geography studied (country or region as per scope of the report) have been studied and presented in this industry trend. As GDP is positively related to the profitability and growth of logistics industry, this data has been used in adjunction to the input-output tables/ supply-use tables for analyzing the potential major contributing sectors towards the logistics demand.
- GDP Growth by Economic Activity - Growth of Nominal Gross Domestic Product across major economic sectors, for the geography studied (country or region as per scope of the report) have been presented in this industry trend. This data has been utilized for assessing the growth of logistics demand from all the market end users (economic sectors considered here).
- Inflation - Variations in both Wholesale Price Inflation (YoY change in producer price index) and Consumer Price Inflation have been presented in this industry trend. This data has been used to assess the inflationary environment as it plays a vital role in smooth functioning of the supply chain, directly impacting the logistics operational cost components e.g., pricing of tyres, driver wages & benefits, energy/fuel prices, maintenace costs, toll charges, warehousing rents, custom brokerage, forwarding rates, courier rates etc. hence impacting the overall freight and logistics market.
- Infrastructure - As infrastructure plays a vital role in an economy's logistics performance, variables like length of roads, distribution of road length by surface category (paved v/s unpaved), distribution of road length by road classification (expressways v/s highways v/s other roads), rail length, volume of containers handled by major ports and tonnage handled by major airports have been analysed and presented in this industry trend.
- Key Industry Trends - The report section named "Key Industry Trends" include all the key variables/parameters studied to better analyze the market size estimates and forecasts. All the trends have been presented in the form of data points (time series or latest available data points) along with analysis of the paramter in the form of concise market relevant commentary, for the geography studied (country or region as per the scope of report).
- Key Strategic Moves - The action taken by a company to differentiate from its competitor or used as a general strategy is referred to as a key strategic move (KSM). This includes (1) Agreements (2) Expansions (3) Financial Restructuring (4) Mergers and Acquisitions (5) Partnerships, and (6) Product Innovations. Key players (Logistics Service Providers, LSPs) in the market have been shortlisted, their KSM have been studied and presented in this section.
- Liner Shipping Bilateral Connectivity Index - It indicates a country pair's integration level into global liner shipping networks and plays a crucial role in determining bilateral trade, which in turn potentially contributes toward the prosperity of a country and its surrounding region. Hence the major economies connected to the country/ region as per scope of the report, have been analyzed and presented in "Liner Shipping Connectivity" industry trend.
- Liner Shipping Connectivity - This industry trend analyses the state of connectivity to the global shipping networks based on the status of maritime transport sector. It includes the analysis of liner shipping connectivity, bilateral shipping connectivity, and port liner shipping connectivity indices for the geography (country/ region as per scope of the report) over the review period.
- Liner Shipping Connectivity Index - It indicates how well countries are connected to global shipping networks based on the status of their maritime transport sector. It is based on five components of the maritime transport sector: (1) The number of shipping lines servicing a country, (2) The size of the largest vessel used on these services (in TEUs), (3) The number of services connecting a country to the other countries, (4) The total number of vessels deployed in a country, (5) The total capacity of those vessels (in TEUs).
- Logistics Performance - Logistics Performance and Logistics Costs are the backbone of trade, and influences trade costs, making countries compete globally. Logistics performance is influenced by market wide adopted supply chain management strategies, government services, investments & policies, fuel/ energy costs, inflationary environment etc. Hence, in this industry trend, the logistics performance of the geography studied (country/ region as per the scope of report) has been analysed and presented over the review period.
- Major Truck Suppliers - Market share of truck brands is influenced by factors like geographical preferences, portfolio of truck types, truck prices, local production, truck repair & maintenance service peneteration, customer support, technological innovations (like electric vehicles, digitalization, autonomous trucks), fuel efficiency, financing options, annual maintenance costs, availability of substitutes, marketing startegies etc. Hence, the distribution (share % for base year of the study) of truck sales volume for leading truck brands and commentary on current market scenario & market anticipation over the forecast period have been presented in this industry trend.
- Manufacturing - This end user industry segment captures the external (outsourced) logistics expenditure incurred by the Manufacturing industry players. The end user players considered are the establishments primarily engaged in the chemical, mechanical or physical transformation of materials or substances into new products. Logistics Service Providers (LSPs) play a crucial role in maintaining a smooth flow of raw materials across the supply chain, enabling timely delivery of finished goods to distributors or end customers and storing & supplying the raw materials to clients for just-in-time manufacturing.
- Maritime Fleet Load Carrying Capacity - Maritime fleet load carrying capacity depicts the development state of an economy's maritime infrastructure & trade. It is influenced by factors like volume of production, international trade, major end user industries, maritime connectivity, environmental regulations, investments in port infrastructure development, port container cargo handling capacity etc. This industry trend represents the maritime fleet load carrying capacity by type of ship viz. container ships, oil tankers, bulk carriers, general cargo, among other types alongwith the influencing factors for the geography studied (country/ region as per scope of the report), over the review period.
- Modal Share - Freight Modal Share is influenced by factors like modal productivity, government regulations, containerization, distance of shipment, temperature control requirements, type of goods, international trade, terrain, speed of delivery, shipment weight, bulk shipments, etc. Also, modal share by tonnage (tons) and modal share by freight turnover (ton-km) differ as per average distance of shipments, weight of major commodity groups transported in the economy and number of trips. This industry trend represents the distribution of freight transported by mode of transport (tons as well as ton-km), for the study base year.
- Oil and Gas, Mining and Quarrying - This end user industry segment captures the external (outsourced) logistics expenditure incurred by the extraction industry players. The end user players considered are the establishments that extract naturally occurring mineral solids, such as coal and ores; liquid minerals, such as crude petroleum; and gases, such as natural gas. Logistics Service Providers (LSPs) covers entire phases from upstream to downstream and plays a crucial role in the transportation of machinery, drilling equipments, extracted minerals, crude oil & natural gas and refined/ processed products from one place to another.
- Other End Users - Other end user segment captures the external (outsourced) logistics expenditure incurred by the financial services (BFSI), real estate, educational services, healthcare, and professional services (administrative, waste management, legal, architectural, engineering, design, consulting, scientific R&D). Logistics Service Providers (LSPs) plays a crucial role in the reliable movement of supplies and documents to/from these industries such as transporting any equipment or resources required, shipping confidential documents and files, movement of medical goods & supplies (surgical supplies and instruments, including gloves, masks, syringes, equipment) to name a few.
- Other Services - Other Services segment captures revenue earned through (1) Value added services (VAS) for freight transportation by road, rail, air and sea & inland waterways, (2) VAS for marine cargo transportation (operation of terminal facilities such as harbours and piers, operation of waterway locks, navigation, pilotage and berthing activities, lighterage, salvage activities, lighthouse activities, among other miscellaneous support activities), (3) VAS for land freight transportation (operation of terminal facilities such as railway stations, stations for the handling of goods, operation of railroad infrastructure, switching and shunting, towing and road side assistance, liquefaction of gas for transportation purposes, among other miscellaneous support activities), (4) VAS for air cargo transportation (operation of terminal facilities such as airway terminals, airport and air-traffic-control activities, ground service activities on airfields, runway maintenance, inspection/ ferrying/ maintenance/ testing of aircrafts, aircraft fuelling services, among other miscellaneous support activities), (5) VAS for warehousing and storage service (operation of grain silos, general merchandise warehouses, refrigerated warehouses, storage tanks etc., storage of goods in foreign trade zones, blast freezing, crating goods for shipping, packing and preparing goods for shipping, labelling and/or imprinting the package, kit assembling and packaging services, among other miscellaneous support activities), and (6) VAS for courier, express and parcel service (pickup, sorting).
- Port Calls and Performance - The performance of ports is key to an economy's freight movement, trade, global connectivity, successful growth strategies, investment attractiveness for production & distribution systems, and thus affects GDP, employment, per capita income and industrial growth. Hence, the port perfomance parameters like median time spent by vessels in the ports; average age, size, cargo carrying capacity, container carrying capacity, of vessels entering the ports, port calls, and container port throughput have been analysed and presented in this industry trend.
- Port Liner Shipping Connectivity Index - It reflects a port's position in the global liner shipping network, wherein a higher value of index is associated with better connectivity. Efficient and well-connected ports (1) contribute towards minimizing transport costs, linking supply chains and supporting international trade, (2) pave the way for economies of scale and development of expertise by permitting producers to better exploit possibilities in domestic as well as foreign markets. Hence the major ports of strategic importance, in the country/ region as per scope of the report, have been analyzed and presented in "Liner Shipping Connectivity" industry trend.
- Port Throughput - It reflects the amount of cargo or number of vessels a port handles annually. It can be related to (1) cargo tonnage, (2) container TEU, and (3) vessel calls. Port throughput in terms of total containers handled (TEU's), has been presented in the "Port Calls and Performance" industry trend.
- Producer Price Inflation - It indicates inflation from viewpoint of the producers viz. the average selling price received for their output over a period of time. Annual change (YoY) of producer price index is reported as wholesale price inflation in the "Inflation" industry trend. As WPI captures dynamic price movements in most comprehensive way, it is widely used by governments, banks, industry, business circles and is deemed important in formulation of trade, fiscal and other economic policies. The data has been used in adjunction to consumer price inflation for better understanding the inflationary environment.
- Segmental Revenue - Segmental Revenue has been triangulated or computed and presented for all the major players in the market. It refers to the freight and logistics market specific revenue earned by the company, over the base year of study, in the geography studied (country or region as per the scope of report). It is computed through the study and analysis of major parameters like financials, service portfolio, employee strength, fleet size, investments, number of countries present in, major economies of concern, etc. that have been reported by the company in its annual reports, webpage. For companies having scarce financial disclosures, paid databases like D&B Hoovers, Dow Jones Factiva have been resorted to and verified through industry/expert interactions.
- Transport and Storage Sector GDP - Value and growth of Transport and Storage Sector GDP has a direct relation to the freight and logistics market size. Hence, this variable has been studied and presented over the review period, in value terms (USD) and as share % of total GDP, in this industry trend. The data has been supported by concise and relevant commentary around the investments, developments, and current market scenario.
- Trends in E-Commerce Industry - Enhanced internet connectivity and boom in smartphone penetration, coupled with increasing disposable incomes, has led to a phenomenal growth in the e-commerce market globally. Online shoppers require fast and efficient delivery of their orders leading to an increase in the demand for logistics services especially e-commerce fulfilment services. Hence, the Gross Merchandise Value (GMV), historial and projected growth, breakup of major commodity groups in e-commerce industry for the studied geography (country or region as per scope of the report) have been analysed and presented in this industry trend.
- Trends in Manufacturing Industry - Manufacturing industry involves the transformation of raw materials into finished products, while logistics industry ensures the efficient flow of raw materials to the factory, and the transport of manufactured products to the distributors & consumers. Demand-Supply of both industries are highly cross-linked and critical for a seamless supply chain. Hence, the Gross Value Added (GVA), breakup of GVA into major manufacturing sectors, and growth of manufacturing industry over the review period have been analysed and presented, in this industry trend.
- Trucking Fleet Size By Type - Market share of truck types is influenced by factors like geographical preferences, major end user industries, truck prices, local production, truck repair & maintenance service peneteration, customer support, technological disruptions (like electric vehicles, digitalization, autonomous trucks) etc. Hence, the distribution (share % for base year of study) of truck parc volume by type of truck, market disruptors, truck manufacturing investments, truck specifications, truck use & import regulations, and market anticipation over the forecast period have been presented in this industry trend.
- Trucking Operational Costs - The prime reasons for measuring/ benchmarking logistics performance of any trucking company are to reduce operational costs and increase profitability. On the other hand, measuring operational costs helps to identify whether and where to make operational changes to control expenses and identify areas for improved performance. Hence, in this industry trend, trucking operational costs and the variables involved viz. driver wages & benefits, fuel prices, repairs & maintenance costs, tyre costs etc. have been studied over the base year of study, and presented for the geography studied (country or region as per the scope of report).
- Warehousing and Storage - Warehousing and storage segment captures revenue earned through the operation of general merchandise, refrigerated and other types of warehousing & storage facilities. These establishments take responsibility for storing the goods and keeping them secure in lieu of charges. Value added services (VAS) they may provide are considered to be a part of the "other services" segment. Here VAS refer to a range of services, related to the distribution of a customer's goods and can include labelling, breaking bulk, inventory control & management, light assembly, order entry & fulfillment, packaging, pick & pack, price marking & ticketing and transportation arrangement.
- Wholesale and Retail Trade - This end user industry segment captures the external (outsourced) logistics expenditure incurred by the wholesalers and retailers. The end user players considered are the establishments primarily engaged in wholesaling or retailing merchandise, generally without transformation, and rendering services incidental to the sale of merchandise. Logistics Service Providers (LSPs) plays a crucial role in the reliable movement of supplies to and finished products from production houses to the distributors and finally to the end customer covering activites like material sourcing, transportation, order fulfillment, warehousing & storage, demand forecasting, inventory management etc.
| Keyword | Definition |
|---|---|
| Axle Load | The axle load of a wheeled vehicle is the total weight bearing on the roadway for all wheels connected to a given axle. |
| Back Haul | Backhaul is the return movement of a transport vehicle from its original destination to its original point of departure. |
| Bill of Lading | A bill of lading is a legal document issued by a carrier to a shipper that details the type, quantity, and destination of the goods being carried. |
| Bunkering | Bunkering is the process of supplying fuel and/or gasoil to be used to power the propulsion system of a ship (such fuel is referred to as bunker). It includes the logistics of loading and distributing the fuel among available shipboard tanks. A person dealing in trade of bunker (fuel) is called a bunker trader. |
| Bunkering Service | Bunkering service is the supply of a requested quality and quantity of bunkers to a ship. |
| C-commerce | C-commerce (Collaborative commerce) describes electronically enabled business interactions among an enterprise’s internal personnel, business partners and customers throughout a trading community. The trading community could be an industry, industry segment, supply chain or supply chain segment. |
| Cabotage | Transport by a vehicle registered in a country performed on the national territory of another country. |
| Cartage Agent | A ground transportation service that provides pickup and delivery of freight in locations not served directly by an air or ocean carrier. |
| Contract logistics | Contract logistics refers to the outsourcing of resource management tasks by one company to a third-party company specializing in logistical matters, such as transportation, warehousing, and order fulfillment. |
| Courier | A business that is used to send messages, packages, etc. Courier service refers to the fast or quick, door to door pickup and delivery service for goods or documents. It can be local or international. A company that provides such delivery services is called a courier company. A courier company hires people to provide their services. Such a person hired by the courier service company is called a courier. |
| Cross docking | Cross docking is a practice in logistics management that includes unloading incoming delivery vehicles and loading the materials directly into outbound delivery vehicles, omitting traditional warehouse logistical practices and saving time and money. |
| Cross Trade | International transport between two different countries performed by a vehicle registered in a third country. A third country is a country other than the country of loading/embarkation and than the country of unloading/disembarkation. |
| Customs Clearance | The procedures involved in getting cargo released by Customs through designated formalities such as presenting import license/permit, payment of import duties and other required documentations by the nature of the cargo such as FCC or FDA approval. |
| Customs seal | Customs seal means a seal, stamp or any other preventive means affixed by customs officials to ensure the inviolability of goods, commercial means of transport or warehouses. |
| Dangerous Goods | Dangerous goods (or hazardous materials or HAZMAT) include flammable liquids/solids, gases, compressed, liquified, dissolved under pressure, corrosives, oxidising substances, explosive substances and articles, substances, which on contact with water, emit flammable gasses, organic peroxides, toxic substances, infectious substances, radioactive materials, miscellaneous dangerous goods and articles. |
| Direct Shipment | Direct shipment is a method of delivering goods from the supplier or the product owner to the customer directly. In most cases, the customer orders the goods from the product owner. This delivery scheme reduces transportation and storage costs, but requires additional planning and administration. |
| Drayage | A drayage is a form of trucking service that connects the different modes of shipping (intermodal), such as ocean freight or air freight. It’s a short-haul trip that transports goods from one place to another, usually before or after its long-haul shipping process. Drayage trucks move cargo to and from various destinations, such as container ships, storage lots, order fulfillment warehouses, and rail yards. Typically, drayage only transports goods in short distances and operates only in one metropolitan area. It also requires only one trucker in a single shift. |
| Dry Docking | Dry docking is a term used for repairs or when a ship is taken to the service yard. During dry docking, the whole ship is brought to a dry land so that the submerged portions of the hull can be cleaned or inspected. |
| Dry van | A dry van is a type of semi-trailer that's fully enclosed to protect shipments from outside elements. Designed to carry palletized, boxed or loose freight, dry vans aren't temperature-controlled (unlike refrigerated “reefer” units) and can't carry oversized shipments (unlike flatbed trailers). |
| Feedering | Transport service whereby loaded or empty containers in a regional are transferred to a “mother ship” for a long-haul ocean voyage. |
| Final Demand | Final demand includes all types of commodities (goods as well as services) consumed as final use and might include personal consumption, or consumption by government, by businesses as capital investment, and as exports. includes all types of commodities (goods as well as services) consumed as final use and might include personal consumption, or consumption by government, by businesses as capital investment, and as exports. |
| First mile Delivery | First mile delivery refers to the first stage of the transportation. This is when the parcel leaves the seller’s warehouse and is taken by the courier pick up agent to process it or take it to the warehouse. Once the package reaches the post office or the courier’s hub, it is then sorted and transported further until it reaches the customer’s doorstep. |
| Fiscal storage services | It means a facility, clearly separated from other premises, where the excise goods are produced, processed, held, received or dispatched under a duty suspension arrangement by an authorized depositor, in the course of his business, under conditions laid down by the customs authorities. |
| Flat Bed | It has a back body that is flatly shaped for easy loading and unloading of goods. The flatbed truck is mostly used to transport heavy, oversized, wide and indelicate goods. |
| Flatbed Truck | A flatbed truck is a type of truck with rigid design. It has a back body that is flatly shaped for easy loading and unloading of goods. The flatbed truck is mostly used to transport heavy, oversized, wide and indelicate goods such as machinery, building supplies or equipment. Due to the truck open body, the goods transported with it must not be vulnerable to rain. By functionality, the flatbed truck is comparable to a flatbed trailer. |
| Freight Transit Time | Transit time is how long it takes for a shipment to be delivered to its final destination after being picked up from a designated pick up point. |
| Halal Logistics | It refers to the process of managing the logistics operations such as fleet management, storage/warehousing, and materials handling according to the principles of Shariah law in ensuring the integrity of the halal products at the point of consumption. |
| Haulage | The commercial transport of goods. |
| Inbound Logistics | Inbound logistics is the way materials and other goods are brought into a company. This process includes the steps to order, receive, store, transport and manage incoming supplies. Inbound logistics focuses on the supply part of the supply-demand equation. |
| Intermediate Demand | Intermediate demand includes goods, services, and maintenance and repair construction sold to businesses, excluding capital investment. |
| International Loaded | Place of loading of goods in reporting country (i.e., country in which the vehicle performing the transport is registered) and place of unloading in a different country. |
| International Unloaded | Place of unloading of goods in reporting country (i.e., country in which the vehicle performing the transport is registered) and place of loading in a different country. |
| Last Mile Delivery | Last mile delivery refers to the very last step of the delivery process when a parcel is moved from a transportation hub to its final destination—which, usually, is a personal residence or retail store. |
| Less than-Truck-Load (LTL) | Less-than-truckload, also known as less-than-load (LTL), is a shipping service for relatively small loads or quantities of freight. An LTL provider combines the loads and shipping requirements of several different companies on their trucks, using a hub-and-spoke system to get goods to their destinations. |
| Locomotives Haluage | The transport of coal, ore, workers, and materials underground by means of locomotive-hauled mine cars. The locomotive may be powered by battery, diesel, compressed air, trolley, or some combination such as battery-trolley or trolley-cable reel. |
| Milkrun | A Milk Run is a delivery method used to transport mixed loads from various suppliers to one customer. Instead of each supplier sending a truck every week to meet the needs of one customer, one truck (or vehicle) visits the suppliers to pick up the loads for that customer. This method of transport got its name from the dairy industry practice, where one tanker used to collect milk from several dairy farms for delivery to a milk processing company. |
| Multi country consolidation | Multi-Country Consolidation (MCC) is a cost-effective solution that consolidates ones cargo from different countries of origin to build Full Container Loads (FCL). MCC is most suitable for companies that import light volumes of goods from multiple countries but want to take advantage of the more economic FCL freight rates. |
| Multi-Modal Logistics | Multimodal transportation or multimodal shipping refers to logistics and freight processes that require multiple modes of transportation. |
| Omni Channel Logistics | Omnichannel distribution is a multichannel approach taken by companies to give customers a way to purchase and receive orders from several sales channels with one-touch seamless integration. Some of the ways include- 1. Buy online, then pick-up at the brick and mortar store; 2. Buy online, then have it delivered to the home or another location; 3.In store purchase, with the delivery either to the home or another location; 4. Drop ship from a warehouse or manufacturing center to store, home or other location; 5.Buy online, then return at store or online; 6. Buy online, then return online. |
| OOG cargo | Out of Gauge (OOG) cargo is any cargo that can not be loaded into six-sided shipping containers simply because it is too large. The term is a very loose classification of all cargo with dimensions beyond the maximum 40HC container dimensions. That is a length beyond 12.05 meters – a width beyond 2.33 meters – or a height beyond 2.59 meters. |
| Other ships | Other ships include: Liquefied petroleum gas carriers, liquefied natural gas carriers, parcel (chemical) tankers, specialized tankers, reefers, offshore supply vessels, tugboats, dredgers, cruise, ferries, other non-cargo ships |
| Other Specialised Cargo | Other specialised goods include pre-slung goods (Goods, one or more items, supplied with a sling or slings), mobile units (Mobile Self Propelled Units, Non Self Propelled Units, unrolled vehicles), oversized equipment load (light and heavy machinery that is often too big or too heavy), high value freight that needs extra protection like electronics, financial services road freight. |
| Outsourced Freight Transport | Transport for hire or reward; The carriage for remuneration of goods. |
| Pallets | Raised platform, intended to facilitate the lifting and stacking of goods. |
| Part load | A part load describes goods which only fills a truck partially. In essence, the quantity of the shipment is bigger than the Less Than Truckload (LTL) shipment. Also, the shipment cannot fully occupy a truck i.e. its capacity is much lower than a Full Truckload (FTL) shipment. |
| Paved Road | Road surfaced with crushed stone (macadam) with hydrocarbon binder or bituminized agents, with concrete or with cobblestone. |
| Q-commerce | Q-commerce, also referred to as quick commerce, is a type of e-commerce where emphasis is on quick deliveries, typically in less than an hour. |
| Quay | A stone or metal platform lying alongside or projecting into water for loading and unloading ships. |
| Recommerce | Recommerce is the selling of previously owned items through online marketplaces to buyers who reuse, recycle or resell them. |
| ReverseLogistics | Reverse logistics is a type of supply chain management that moves goods from customers back to the sellers or manufacturers. |
| Road Freight Transport Service | Hiring a trucking agency for transport of commodities (raw materials or manufactured goods including both solids and liquids) form the origin to a destination within the country (domestic) or cross-border (international) constitutes road freight transport market. The service might be Full-Truck-Load or Less than-Truck-Load, containerized or non-containerized, temperature controlled or non temperature controlled, short haul or long haul. |
| Roll-on/roll-off cargo | Roll-on/roll-off (RORO or ro-ro) ships are cargo ships designed to carry wheeled cargo, such as cars, motorcycles, trucks, semi-trailer trucks, buses, trailers, and railroad cars, that are driven on and off the ship on their own wheels or using a platform vehicle, such as a self-propelled modular transporter. |
| Swap bodies | A swap body, swop body, exchangeable container or interchangeable unit, is one of the types of standard freight containers for road and rail transport. |
| Tank Barge | A non-self-propelled vessel constructed or adapted primarily to carry liquid, solid or gaseous commodities or cargos in bulk in cargo spaces (or tanks) through rivers and inland waterways, and may occasionally carry commodities or cargos through oceans and seas when in transit from one inland waterway to another. The commodities or cargos transported are in direct contact with the tank interior. |
| Tautliner vehicle | Tautliner and curtainsider are used as generic names for curtain sided trucks/trailers. The curtains are permanently fixed to a runner at the top and detachable rails/poles at front and rear, allowing the curtains to be drawn open and forklifts used all along the sides for easy and efficient loading and unloading. When closed for travel, vertical load restraint straps are attached to a rope rail beneath the truck bed, connecting the truck bed and curtain along both sides. Winches at either end of the curtain tension it, hence the 'Tautliner' name. This stops the curtain from flapping or drumming in the wind and can also help retain light loads from slipping sideways. |
| Transloading | Transloading is a shipping term that refers to the transfer of goods from one mode of transportation to another en route to their ultimate destination. |
| Tsubo | A Japanese unit of area equal to 35.58 square feet. |
| Unpaved Road | Road with a stabilized base not surfaced with crushed stone, hydrocarbon binder or bituminized agents, concrete or cobblestone. |
| Vessel Husbandry Services | It includes ship maintenance, repairs, cleaning, upkeep of the hull and rigging and equipment. |


Research Methodology
Mordor Intelligence follows a four-step methodology in all our reports.
- Step-1: Identify Key Variables: In order to build a robust forecasting methodology, the variables and factors identified in Step-1 are tested against available historical market numbers. Through an iterative process, the variables required for market forecast are set and the model is built on the basis of these variables.
- Step-2: Build a Market Model: Market-size estimations for the forecast years are in nominal terms. Inflation is not a part of the pricing, and the average selling price (ASP) is kept constant throughout the forecast period for each country.
- Step-3: Validate and Finalize: In this important step, all market numbers, variables and analyst calls are validated through an extensive network of primary research experts from the market studied. The respondents are selected across levels and functions to generate a holistic picture of the market studied.
- Step-4: Research Outputs: Syndicated Reports, Custom Consulting Assignments, Databases & Subscription Platforms


