Market Overview
| Study Period | 2017 - 2029 |
|---|---|
| Forecast Data Period | 2025 - 2029 |
| Historical Data Period | 2017 - 2023 |
| Market Size (2025) | USD 1.19 Billion |
| Market Size (2029) | USD 1.62 Billion |
| Growth Rate (2025 - 2029) | 8.00% CAGR |
| Market Concentration | Low |
Major Players*Disclaimer: Major Players sorted in no particular order Image © Mordor Intelligence. Reuse requires attribution under CC BY 4.0. | |

Nordic E-bike Market Analysis by Mordor Intelligence
The Nordic E-bike Market size is estimated at 1.19 billion USD in 2025, and is expected to reach 1.62 billion USD by 2029, growing at a CAGR of 8.00% during the forecast period (2025-2029).
The Nordic e-bike industry is experiencing a fundamental transformation driven by evolving urban mobility patterns and infrastructure development. Government authorities across the region are making substantial investments in dedicated cycling infrastructure, with cities implementing comprehensive bicycle lane networks and secure parking facilities. This commitment to cycling infrastructure is reflected in ambitious urban planning goals, with major Nordic cities like Gothenburg targeting to achieve 12% of all trips by bicycle by 2025. The integration of electric bikes into urban transportation systems has become a cornerstone of sustainable transportation strategies, with municipalities increasingly incorporating e-bike sharing systems into their public transport networks.
Technological advancement in electric bike design and functionality is reshaping the market landscape. Manufacturers are introducing sophisticated features such as integrated GPS systems, smart connectivity options, and advanced battery management systems. In September 2022, Swedish mobility startup Vassla Pedal launched new electric bicycles equipped with an impressive 100 km range per single charge, demonstrating the industry's focus on extending range capabilities. The evolution of battery technology has been particularly significant, with newer models featuring improved charging efficiency and longer battery life, making e-bikes increasingly practical for daily commuting.
Consumer preferences in the Nordic region are shifting dramatically toward sustainable transportation solutions, particularly in urban areas. In Sweden, a remarkable 72.5% of people now commute to work by bicycle, highlighting the growing acceptance of cycling as a primary mode of transportation. This trend is further supported by urban planning statistics showing that 80% of urban car trips in Sweden are less than 4 kilometers, presenting a significant opportunity for e-bike adoption. The region's commitment to sustainable mobility is evident in its ambitious targets, with plans to have 25% of all travel distances covered by bicycle, foot, or public transportation by 2025.
The commercial sector is increasingly recognizing the potential of e-bikes for last-mile delivery and business operations. Logistics companies and retail businesses are integrating electric transportation solutions into their delivery fleets, particularly in urban areas where they offer advantages in terms of parking flexibility and traffic navigation. In March 2023, DB Schenker successfully implemented electric-powered bicycles for deliveries in Bergen, Norway, demonstrating 40% higher profitability compared to traditional delivery vehicles. This successful implementation has sparked interest across the industry, leading to increased adoption of micro mobility solutions for commercial purposes throughout the Nordic region.
Nordic E-bike Market Trends and Insights
The consistent growth in e-bike adoption across Nordic countries, led by Denmark and Norway, showcases a strong inclination towards sustainable and health-conscious transportation choices in the region.
- Nordic countries have witnessed significant growth in the demand for e-bikes over the past few years. The benefits of e-bikes over the old traditional bicycles have raised the former's demand across the region. Riding comfortably with minimal effort, zero carbon emission, time-saving during peak traffic hours, and cost-efficiency are some of the major factors contributing to the adoption of e-bikes over other vehicles for daily commuting to nearby places. As a result, the adoption rate for e-bikes increased by around 5% in 2019 over 2018 across the Nordic region.
- In 2020, the Nordic e-bike market was favorably impacted by the COVID-19 outbreak. The use of personal vehicles increased, and people started avoiding other modes of transportation, including public transportation and hired cabs, which greatly aided in the spread of e-bikes throughout the region. These factors encouraged many to buy e-bikes as a practical and affordable option for daily commuting to work and neighboring locations in various countries. As a result, the adoption rate of e-bikes in Sweden increased by around 6% in 2020 compared to 2019.
- In 2021, the easing of COVID-19 restrictions led to the restart of offices and business operations, thus, increasing the region's consumer demand for e-bikes. The introduction of new e-bikes with cutting-edge features like quick charging, a large range in kilometers, and fitness tracking has greatly influenced people to purchase e-bikes. As a result, all Nordic countries are anticipated to have an e-bike adoption rate of more than 50% by 2029.


A modest but steady increase in the population commuting 5-15 km, with Sweden and Norway showing consistent growth, reflecting a stable trend in regional commuting habits.
- The need for individual bikers rises each year as the number of Nordic nations using bicycles for transportation increases. The number of people who commute by bicycle 5 to 15 kilometers each day has increased due to the rising bicycle demand. In 2020, more than 10% of people in the area commuted daily between 5 and 15 kilometers to various destinations, including workplaces, businesses, and educational institutions.
- Millions of people rediscovered bicycles as a safe, socially isolated form of transportation due to the growing number of COVID-19 cases throughout the region, which prompted the closure of gyms and public transportation. During the pandemic, more people decided to commute within a range of 5 to 15 kilometers, thus increasing the number of commuters in 2021. Customers who commute 5 to 15 kilometers daily are also demanding e-bikes with cutting-edge battery packs that offer a greater range of up to 40-45 kilometers.
- People have become habitual in using bicycles for daily travel, further increasing the number of commuters between 5 and 15 kilometers, including traveling to their places of employment, businesses, and nearby markets. Various countries in the region have witnessed growth in the number of bicycle users. In 2022, Sweden witnessed 72.5% of people traveling to work daily on bicycles. Improvements to cycling infrastructure and the creation of bike lanes are expected to increase the demand for bicycles and commuters between 5 and 15 kilometers during the projection period in Sweden. Similar factors are projected to increase the demand for bicycles and commuters between 5 and 15 kilometers across the Nordic region.

OTHER KEY INDUSTRY TRENDS COVERED IN THE REPORT
- The Nordic region shows a strong, growing market for bicycles, reflecting a widespread and enduring interest in cycling.
- Inflation trends in the Nordic region reflect a balanced economic scenario with Sweden, Norway, and Denmark experiencing a gradual increase in prices, underlining the region's effective management of economic pressures.
- The consistent decline in Li-ion battery prices in the Nordic region underscores a strong shift towards electric mobility.
- Extensive bicycle lanes in the Nordic region enhance safety and encourage cycling as a primary mode of transportation.
- Advanced Battery Technology is Encouraging Consumers to Choose E-Bikes
- Development in industries and GDP Per Capita
- Demonstrates a steady and consistent growth in the bicycle rental market, with countries like Sweden and Finland contributing to the regional market value.
- The Nordic region is embracing e-bikes for hyperlocal deliveries, optimizing for speed and sustainability in urban areas.
- Trekking is growing in popularity, with Sweden, Norway, and Denmark showing consistent increases in the number of trekkers, indicating a robust outdoor activity culture.
- Norway and Sweden show a decreasing trend in traffic congestion, maintaining lower levels compared to Denmark, which has a slightly fluctuating but stable congestion rate.
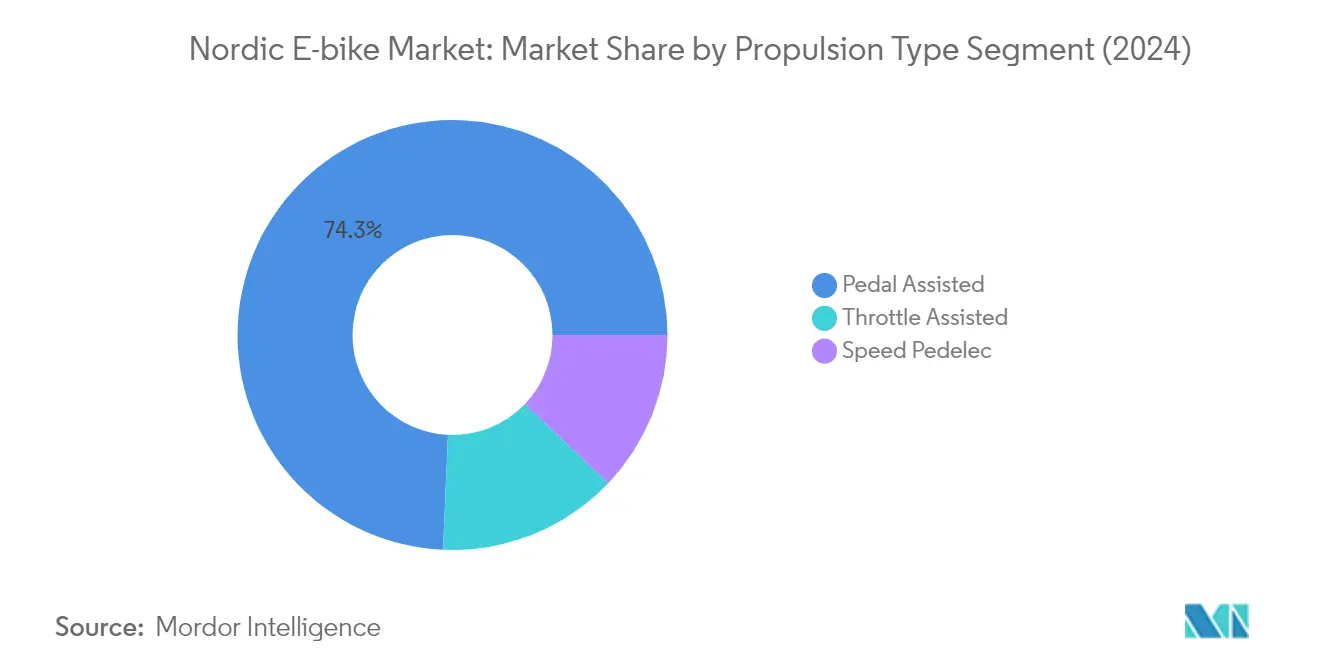
Segment Analysis: Propulsion Type
Pedal Assisted Segment in Nordic E-bike Market
The pedal assist bike segment dominates the Nordic e-bike market, commanding approximately 74% market share in 2024. This significant market position is driven by several factors, including the segment's appeal to a broad consumer base ranging from daily commuters to recreational cyclists. Pedal assist bikes are particularly popular in urban areas where they provide an ideal balance of exercise and motorized support for various riding conditions. The segment's success is further bolstered by favorable regulations across Nordic countries that classify these bikes as regular bicycles when their motor power doesn't exceed 250W and stops assisting at 25 km/h. This classification eliminates the need for special licenses or registrations, making them more accessible to the general public. Additionally, the segment benefits from continuous technological improvements in battery efficiency and motor systems, making pedal-assisted electric bikes increasingly reliable for longer commutes and varied terrain conditions.

Speed Pedelec Segment in Nordic E-bike Market
The pedelec segment is emerging as the fastest-growing category in the Nordic electric bike market, demonstrating robust growth potential from 2024 to 2029. This growth is primarily driven by increasing demand from long-distance commuters who require higher speeds for their daily travels. The segment's expansion is supported by improving infrastructure for high-speed bicycle lanes in major Nordic cities and growing acceptance of pedelecs as an alternative to motorized vehicles for longer commutes. Manufacturers are responding to this trend by introducing advanced models with enhanced safety features, improved battery range, and sophisticated power management systems. The segment is particularly gaining traction among urban professionals who seek faster alternatives to traditional e-bikes while still maintaining the benefits of eco-friendly transportation. Recent technological advancements in motor efficiency and battery capacity are further accelerating the adoption of speed pedelecs across the Nordic region.
Remaining Segments in Propulsion Type
The throttle-assisted segment represents a significant portion of the Nordic e-bike market, offering unique advantages for specific user groups. These electric bikes are particularly popular among users who prefer more direct power control without the need for constant pedaling, making them ideal for delivery services and users with physical limitations. The segment has established a strong presence in urban delivery applications where quick starts and stops are frequent. Manufacturers in this segment are focusing on developing advanced control systems and improving battery efficiency to enhance the riding experience. While regulations regarding throttle-assisted electric bikes are more stringent compared to pedal-assisted variants, the segment continues to maintain its market position through innovations in safety features and user-friendly designs.
Segment Analysis: Application Type
City/Urban Segment in Nordic E-bike Market
The City/Urban segment dominates the Nordic electric bike market, commanding approximately 80% market share in 2024. This significant market position is primarily driven by the segment's strong appeal among daily commuters, students, and urban professionals who use electric commuter bikes for regular transportation needs. The segment's dominance is further reinforced by the extensive network of dedicated bicycle lanes in Nordic cities, making it a practical choice for urban mobility. The growing emphasis on sustainable urban transportation solutions, coupled with government initiatives to reduce carbon emissions in city centers, has strengthened the position of city/urban electric bikes. These bikes are particularly popular in metropolitan areas where they offer an efficient solution to traffic congestion and parking challenges.
Trekking Segment in Nordic E-bike Market
The trekking segment is emerging as the fastest-growing category in the Nordic electric bike market, driven by increasing interest in outdoor recreation and adventure tourism. This growth is supported by the region's diverse terrain and extensive network of cycling trails that are perfect for trekking electric mountain bikes. The segment's expansion is further fueled by technological advancements in battery life and motor efficiency, making these bikes more suitable for long-distance rides and challenging terrains. Manufacturers are responding to this trend by introducing advanced features such as improved suspension systems and terrain-specific riding modes. The segment is also benefiting from the growing popularity of eco-tourism and the increasing number of organized trekking tours across Nordic countries.
Remaining Segments in Application Type
The Cargo/Utility segment, while smaller in market share, plays a crucial role in the Nordic e-bike ecosystem, particularly in urban logistics and last-mile delivery services. This segment is gaining traction among businesses looking for sustainable delivery solutions in city centers. The cargo e-bikes are increasingly being adopted by courier services, food delivery companies, and small businesses for their cost-effectiveness and ability to navigate through congested urban areas. The segment is also seeing innovation in design and capacity options, making these bikes more versatile for various commercial applications while maintaining their eco-friendly credentials.
Segment Analysis: Battery Type
Lithium-ion Battery Segment in Nordic E-bike Market
The lithium-ion battery segment dominates the Nordic electric bike market, commanding approximately 99% of the total market share in 2024, owing to its superior energy density and power capabilities. This segment has established itself as the most significant and practical energy storage medium for electric bikes, offering advantages like increased vehicle range while reducing battery pack size and weight. The segment's growth is driven by manufacturers' focus on producing lighter electric bikes and the continuous improvement in battery technology. Lithium-ion batteries are particularly favored for their reduced maintenance requirements, increased endurance, and eco-friendly characteristics, offering superior power-to-weight ratios compared to alternative battery types. The segment's dominance is further strengthened by the entry of numerous small and medium-sized companies utilizing cutting-edge technology and innovative methods to manufacture more durable batteries, intensifying competition in the market. The declining costs of lithium-ion batteries have also contributed to their widespread adoption, making electric bikes more accessible to a broader consumer base.
Remaining Segments in Battery Type
The lead acid battery segment represents a diminishing share of the Nordic electric bike market, primarily due to several limitations compared to lithium-ion alternatives. While lead acid batteries offer advantages such as lower initial costs and recyclability, they face significant drawbacks including shorter lifespan, longer charging times, and heavier weight typically weighing about three times more than lithium-ion batteries. These batteries, though reliable and cost-efficient in difficult conditions with minimal maintenance requirements, are gradually being phased out as manufacturers and consumers increasingly favor more advanced battery technologies. The market also includes other battery types, but their presence remains minimal as the industry continues to standardize around lithium-ion technology for its superior performance characteristics and improving cost efficiency.
Nordic E-bike Market Geography Segment Analysis
Nordic E-bike Market in Sweden
Sweden dominates the Nordic e-bike market, commanding approximately 35% of the total market value in 2024. The country's leadership position is driven by its extensive cycling infrastructure, with dedicated bike lanes in major cities and urban areas. The Swedish government's strong commitment to sustainable transportation has created a favorable environment for electric bike adoption, particularly in cities like Stockholm and Gothenburg. The country's focus on reducing carbon emissions has led to the implementation of various initiatives promoting e-bike usage, including the development of smart cycling infrastructure and integration with public transportation systems. Urban planning policies in Swedish cities increasingly prioritize cycling infrastructure, making electric bicycles an attractive option for daily commuting. The market is further strengthened by the presence of numerous e-bike retailers and service centers, ensuring easy access to sales and maintenance services. Swedish consumers' growing environmental consciousness and preference for active transportation solutions continue to drive the market's expansion, particularly in urban areas where e-bikes offer an efficient alternative to traditional vehicles.
Nordic E-bike Market in Finland
Finland represents the most dynamic growth market in the Nordic region, with projections indicating approximately 9% CAGR from 2024 to 2029. The country's rapid market expansion is fueled by innovative urban mobility solutions and strong government support for sustainable transportation alternatives. Finnish cities are increasingly adapting their infrastructure to accommodate electric bikes, with Helsinki leading the way in implementing smart mobility solutions. The country's commitment to reducing urban congestion and promoting sustainable transportation has resulted in the development of comprehensive cycling networks. Finnish consumers' growing interest in health-conscious lifestyle choices and environmental sustainability has created a strong demand for electric bikes. The market is characterized by a robust distribution network and increasing competition among both domestic and international brands. Local municipalities are actively promoting e-bike adoption through various initiatives, including the development of secure parking facilities and charging infrastructure. The integration of electric bikes with public transportation systems has made them an attractive option for last-mile connectivity.
Nordic E-bike Market in Denmark
Denmark's e-bike market benefits from the country's deeply ingrained cycling culture and world-class infrastructure. The nation's flat terrain and extensive network of dedicated cycling paths make it ideal for electric bike adoption. Copenhagen, in particular, serves as a model city for e-bike integration, with its innovative cycling infrastructure and user-friendly urban planning. Danish consumers increasingly view electric bikes as a practical alternative to traditional vehicles, particularly for daily commuting and short-distance travel. The market is characterized by a strong presence of both premium and mid-range e-bike segments, catering to diverse consumer preferences. Local retailers and service providers offer comprehensive support services, including maintenance and battery replacement. The integration of electric bikes with public transportation and the development of smart parking solutions have further enhanced their appeal. Danish cities continue to invest in cycling infrastructure improvements, including dedicated e-bike lanes and charging stations.
Nordic E-bike Market in Norway
Norway's e-bike market is characterized by its unique geographical challenges and strong environmental consciousness. The country's mountainous terrain has actually become a driving force for electric bike adoption, as electric assistance makes cycling feasible in challenging topography. Norwegian cities are actively developing infrastructure to accommodate e-bikes, with Oslo leading the way in implementing cycling-friendly policies. The market is particularly strong in urban areas where electric bikes offer an efficient alternative to traditional transportation methods. Norwegian consumers show a strong preference for high-quality, durable e-bikes that can withstand varied weather conditions. The country's focus on reducing urban traffic congestion has led to increased investment in cycling infrastructure and support facilities. Local authorities are implementing innovative solutions for e-bike integration, including heated bike paths for winter cycling and secure storage facilities.
Nordic E-bike Market in Other Countries
The broader Nordic e-bike market encompasses various other regions, each with unique characteristics and growth potential. These markets are experiencing varying levels of e-bike adoption, influenced by local infrastructure development, government policies, and consumer preferences. Urban areas across the Nordic region are particularly focused on developing cycling-friendly infrastructure, recognizing the role of electric bikes in sustainable urban mobility. The market in these regions benefits from the overall Nordic commitment to environmental sustainability and active lifestyle choices. Local authorities are increasingly implementing policies to promote e-bike adoption, including infrastructure development and integration with existing transportation systems. The presence of international e-bike manufacturers and distributors ensures a diverse product range, catering to different consumer segments. These markets also benefit from knowledge sharing and best practices across the Nordic region, contributing to the overall growth of the e-bike sector.

Competitive Landscape
Top Companies in Nordic E-bike Market
The Nordic e-bike market features established players like CUBE Bikes, Kalkhoff Werke GmbH, Giant Manufacturing, VanMoof BV, and Royal Dutch Gazelle leading the competitive landscape. These companies are actively pursuing product innovation through the development of advanced electric bike battery technologies, smart connectivity features, and improved electric bike motor systems tailored for Nordic conditions. Operational agility is demonstrated through flexible manufacturing capabilities and robust supply chain networks spanning multiple countries, enabling quick response to market demands. Strategic moves in the region focus on expanding distribution networks, strengthening after-sales service infrastructure, and developing partnerships with local retailers and service providers. Companies are also investing in expanding their production facilities, particularly in European locations, to better serve the Nordic market while reducing delivery times and transportation costs.
Market Structure Shows Balanced Competitive Dynamic
The Nordic electric bike market exhibits a balanced mix of global manufacturers and regional specialists, with international conglomerates like Pon Holdings (owner of multiple bike brands) competing alongside specialized e-bike manufacturers. The market structure is characterized by a moderate level of consolidation, with larger players leveraging their extensive research and development capabilities, established brand recognition, and comprehensive distribution networks to maintain their positions. The competitive landscape is further shaped by strategic acquisitions and partnerships, as demonstrated by recent moves such as KKR's acquisition of Accell Group and Pon Holdings' expansion through acquiring various bike brands.
The market demonstrates strong regional characteristics, with companies specifically designing products to meet Nordic requirements for durability, weather resistance, and range performance. Competition is intensifying as traditional bicycle manufacturers transition into the electric bike segment, while pure-play e-bike companies continue to innovate with specialized offerings. The presence of both established manufacturers and innovative startups creates a dynamic environment where companies compete through product differentiation, technological advancement, and service quality rather than purely on price.
Innovation and Localization Drive Future Success
Success in the Nordic e-bike market increasingly depends on companies' ability to combine technological innovation with a deep understanding of local market preferences and conditions. Incumbent players must focus on developing advanced battery technologies, implementing smart features, and creating products specifically designed for Nordic weather conditions and terrain. Companies need to establish a strong local presence through service networks, partnerships with dealers, and engagement with urban mobility initiatives. The ability to adapt to evolving regulations around electric bike specifications, speed limits, and urban mobility policies will be crucial for maintaining market position.
For contenders looking to gain market share, success factors include developing specialized products for specific user segments, establishing efficient distribution networks, and building strong after-sales service capabilities. Companies must address the growing demand for sustainable transportation solutions while meeting stringent quality and safety standards. The market presents opportunities for differentiation through innovative business models, such as electric bike sharing services and fleet solutions for corporate customers. Future success will also depend on the ability to navigate potential regulatory changes, particularly around battery disposal and recycling, while maintaining cost competitiveness through efficient production and supply chain management.
Nordic E-bike Industry Leaders
CUBE Bikes
Giant Manufacturing Co. Ltd.
Kalkhoff Werke GmbH
Royal Dutch Gazelle
VanMoof BV
- *Disclaimer: Major Players sorted in no particular order


Recent Industry Developments
- November 2022: Cannondale and Stella McCartney introduced the new Stella Shared 3x Cannondale customs bike collection.
- November 2022: Cannondale announced a new global unified organizational structure that may eliminate regional GMs and leverage Pon.Bike to enhance the company’s operations and growth.
- November 2022: Ecoride announced plans to continue its growth journey by relocating from Poland to its new factory in Gothenburg, Sweden.


Nordic E-bike Market Report Scope
Pedal Assisted, Speed Pedelec, Throttle Assisted are covered as segments by Propulsion Type. Cargo/Utility, City/Urban, Trekking are covered as segments by Application Type. Lead Acid Battery, Lithium-ion Battery, Others are covered as segments by Battery Type. Denmark, Finland, Norway, Sweden are covered as segments by Country.Propulsion Type
| Pedal Assisted |
| Speed Pedelec |
| Throttle Assisted |
Application Type
| Cargo/Utility |
| City/Urban |
| Trekking |
Battery Type
| Lead Acid Battery |
| Lithium-ion Battery |
| Others |
Country
| Denmark |
| Finland |
| Norway |
| Sweden |
| Propulsion Type | Pedal Assisted |
| Speed Pedelec | |
| Throttle Assisted | |
| Application Type | Cargo/Utility |
| City/Urban | |
| Trekking | |
| Battery Type | Lead Acid Battery |
| Lithium-ion Battery | |
| Others | |
| Country | Denmark |
| Finland | |
| Norway | |
| Sweden |


Market Definition
- By Application Type - E-bikes considered under this segment include city/urban, trekking, and cargo/utility e-bikes. The common types of e-bikes under these three categories include off-road/hybrid, kids, ladies/gents, cross, MTB, folding, fat tire, and sports e-bike.
- By Battery Type - This segment includes lithium-ion batteries, lead-acid batteries, and other battery types. The other battery type category includes nickel-metal hydroxide (NiMH), silicon, and lithium-polymer batteries.
- By Propulsion Type - E-bikes considered under this segment include pedal-assisted e-bikes, throttle-assisted e-bikes, and speed pedelec. While the speed limit of pedal and throttle-assisted e-bikes is usually 25 km/h, the speed limit of speed pedelec is generally 45 km/h (28 mph).
| Keyword | Definition |
|---|---|
| Pedal Assisted | Pedal-assist or pedelec category refers to the electric bikes that provide limited power assistance through torque-assist system and do not have throttle for varying the speed. The power from the motor gets activated upon pedaling in these bikes and reduces human efforts. |
| Throttle Assisted | Throttle-based e-bikes are equipped with the throttle assistance grip, installed on the handlebar, similarly to motorbikes. The speed can be controlled by twisting the throttle directly without the need to pedal. The throttle response directly provides power to the motor installed in the bicycles and speeds up the vehicle without paddling. |
| Speed Pedelec | Speed pedelec is e-bikes similar to pedal-assist e-bikes as they do not have throttle functionality. However, these e-bikes are integrated with an electric motor which delivers power of approximately 500 W and more. The speed limit of such e-bikes is generally 45 km/h (28 mph) in most of the countries. |
| City/Urban | The city or urban e-bikes are designed with daily commuting standards and functions to be operated within the city and urban areas. The bicycles include various features and specifications such as comfortable seats, sit upright riding posture, tires for easy grip and comfortable ride, etc. |
| Trekking | Trekking and mountain bikes are special types of e-bikes that are designed for special purposes considering the robust and rough usage of the vehicles. These bicycles include a strong frame, and wide tires for better and advanced grip and are also equipped with various gear mechanisms which can be used while riding in different terrains, rough grounded, and tough mountainous roads. |
| Cargo/Utility | The e-cargo or utility e-bikes are designed to carry various types of cargo and packages for shorter distances such as within urban areas. These bikes are usually owned by local businesses and delivery partners to deliver packages and parcels at very low operational costs. |
| Lithium-ion Battery | A Li-ion battery is a rechargeable battery, which uses lithium and carbon as its constituent materials. The Li-Ion batteries have a higher density and lesser weight than sealed lead acid batteries and provide the rider with more range per charge than other types of batteries. |
| Lead Acid Battery | A lead acid battery refers to sealed lead acid battery having a very low energy-to-weight and energy-to-volume ratio. The battery can produce high surge currents, owing to its relatively high power-to-weight ratio as compared to other rechargeable batteries. |
| Other Batteries | This includes electric bikes using nickel–metal hydroxide (NiMH), silicon, and lithium-polymer batteries. |
| Business-to-Business (B2B) | The sales of e-bikes to business customers such as urban fleet and logistics company, rental/sharing operators, last-mile fleet operators, and corporate fleet operators are considered under this category. |
| Business-to-Customers (B2C) | The sales of electric scooters and motorcycles to direct consumers is considered under this category. The consumers acquire these vehicles either directly from manufacturers or from other distributers and dealers through online and offline channel. |
| Unorganized Local OEMs | These players are small local manufacturers and assemblers of e-bikes. Most of these manufacturers import the components from China and Taiwan and assemble them locally. They offer the product at low cost in this price sensitive market which give them advantage over organized manufacturers. |
| Battery-as-a-Service | A business model in which the battery of an EV can be rented from a service provider or swapped with another battery when it runs out of charge |
| Dockless e-Bikes | Electric bikes that have self-locking mechanisms and a GPS tracking facility with an average top speed of around 15mph. These are mainly used by bike-sharing companies such as Bird, Lime, and Spin. |
| Electric Vehicle | A vehicle which uses one or more electric motors for propulsion. Includes cars, scooters, buses, trucks, motorcycles, and boats. This term includes all-electric vehicles and hybrid electric vehicles |
| Plug-in EV | An electric vehicle that can be externally charged and generally includes all-electric vehicles as well as plug-in hybrids. In this report we use the term for all-electric vehicles to differentiate them from plug-in hybrid electric vehicles. |
| Lithium-Sulphur Battery | A rechargeable battery that replaces the liquid or polymer electrolyte found in current lithium-ion batteries with sulfur. They have more capacity than Li-ion batteries. |
| Micromobility | Micromobility is one of the many modes of transport involving very-light-duty vehicles to travel short distances. These means of transportation include bikes, e-scooters, e-bikes, mopeds, and scooters. Such vehicles are used on a sharing basis for covering short distances, usually five miles or less. |
| Low Speed Electric Vehicls (LSEVs) | They are low speed (usually less than 25 kmph) light vehicles that do not have an internal combustion engine, and solely use electric energy for propulsion. |


Research Methodology
Mordor Intelligence follows a four-step methodology in all its reports.
- Step-1: Identify Key Variables: To build a robust forecasting methodology, the variables and factors identified in Step-1 are tested against available historical market numbers. Through an iterative process, the variables required for market forecast are set and the model is built based on these variables.
- Step-2: Build a Market Model: Market-size estimations for the historical and forecast years have been provided in revenue and volume terms. Market revenue is calculated by multiplying the volume demand with volume-weighted average battery pack price (per kWh). Battery pack price estimation and forecast takes into account various factors affecting ASP, such as inflation rates, market demand shifts, production costs, technological developments, and consumer preferences, providing estimations for both historical data and future trends.
- Step-3: Validate and Finalize: In this important step, all market numbers, variables, and analyst calls are validated through an extensive network of primary research experts from the market studied. The respondents are selected across levels and functions to generate a holistic picture of the market studied.
- Step-4: Research Outputs: Syndicated Reports, Custom Consulting Assignments, Databases & Subscription Platforms


