Sweden Data Center Market Size and Share
Market Overview
| Study Period | 2020 - 2031 |
|---|---|
| Forecast Data Period | 2026 - 2031 |
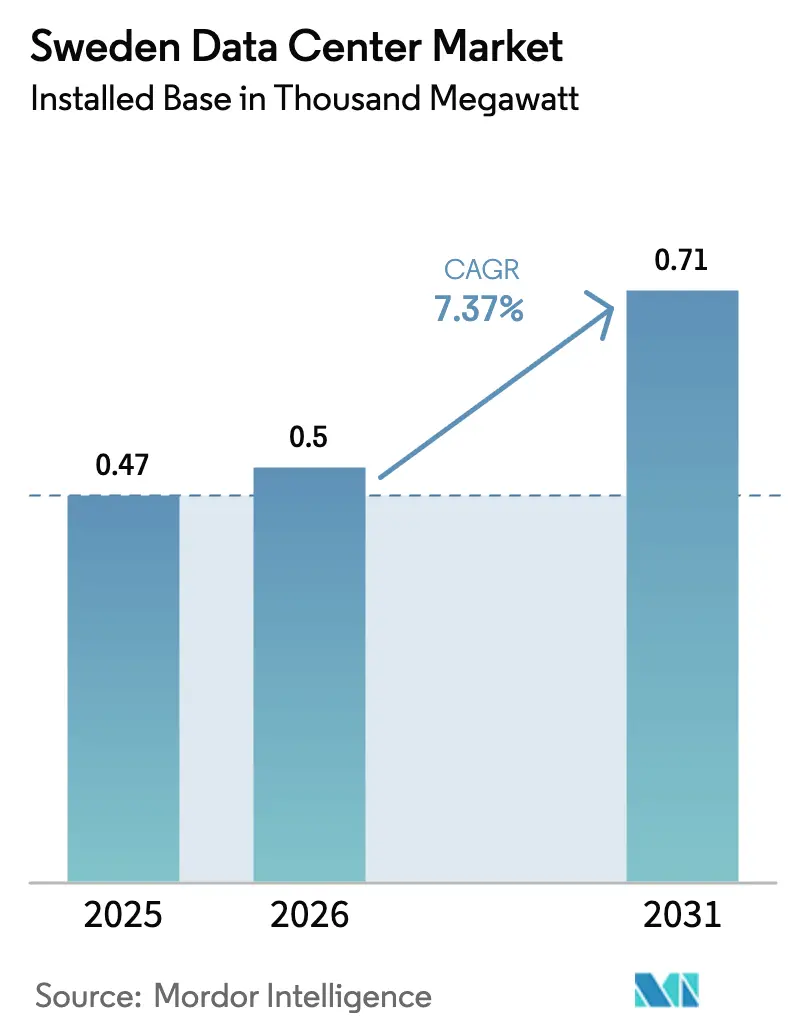
| Base Year Market Size (2025) | 0.47 Thousand megawatt |
| Market Volume (2026) | 0.5 Thousand megawatt |
| Market Volume (2031) | 0.71 Thousand megawatt |
| Growth Rate (2026 - 2031) | 7.37% CAGR |
| Market Concentration | Medium |
Major Players *Disclaimer: Major Players sorted in no particular order Image © Mordor Intelligence. Reuse requires attribution under CC BY 4.0. | |
Sweden Data Center Market Analysis by Mordor Intelligence
The Sweden data center market size in terms of installed base is expected to grow from 0.47 thousand megawatt in 2025 to 0.5 thousand megawatt in 2026 and is forecast to reach 0.71 thousand megawatt by 2031 at 7.37% CAGR over 2026-2031. Hyperscale operators are accelerating multi-hundred-megawatt build programs, capitalizing on low-cost renewable power, a 97% electricity tax rebate, and mature open-access fiber networks. Secure onshore compute for AI training and inference is reshaping demand, with sovereign cloud providers commanding premium pricing from European public-sector buyers. District-heating integration is progressing from pilot to commercial scale, adding ancillary revenue streams that lift project returns by up to 200 basis points. Power-transmission bottlenecks in southern zones and rising prime-land costs in Stockholm continue to elongate delivery schedules, steering new capacity toward hydropower-rich northern municipalities.
Key Report Takeaways
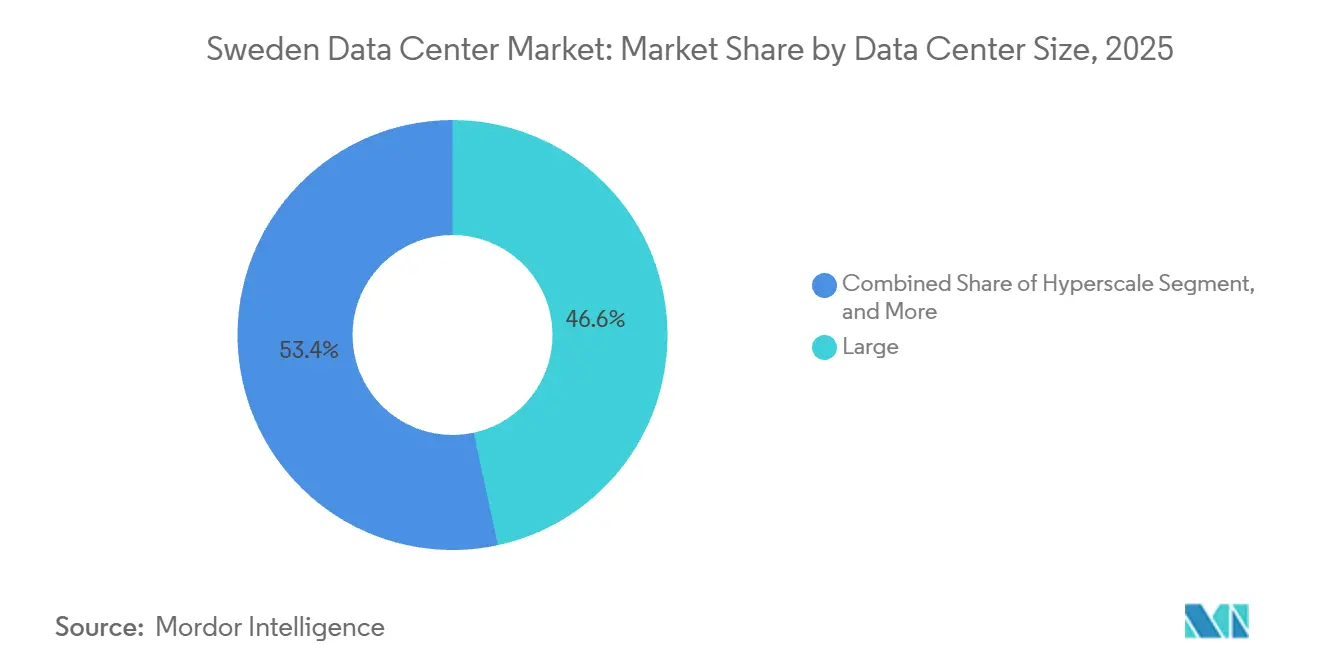
- By data center size, large facilities led the Sweden data center market with 46.61% of the market share in 2025; hyperscale builds are forecast to grow at an 8.23% CAGR through 2031.
- By tier, tier 3 configurations accounted for 61.32% of the Sweden data center market size in 2025, and tier 4 deployments are projected to expand at an 8.42% CAGR to 2031.
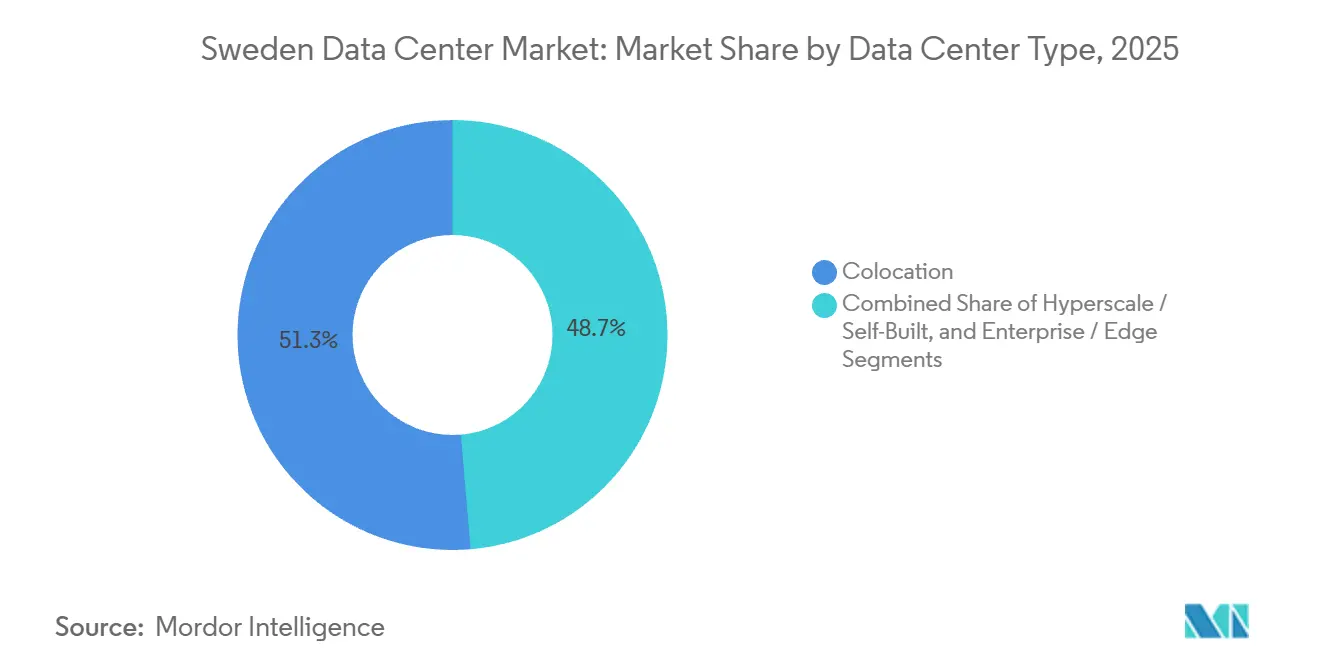
- By data-center type, colocation accounted for 51.35% of capacity in 2025, while self-built hyperscale sites are advancing at an 8.66% CAGR over the forecast period.
- By end user, IT and ITES captured 55.61% in 2025, and BFSI workloads are growing fastest at a 9.06% CAGR.
- By hotspot, Stockholm commanded 36.29% of national capacity in 2025, while the Rest of Sweden segment is advancing at an 8.18% CAGR through 2031.
Note: Market size and forecast figures in this report are generated using Mordor Intelligence’s proprietary estimation framework, updated with the latest available data and insights as of January 2026.
Sweden Data Center Market Trends and Insights
Drivers Impact Analysis*
| Driver | (~) % Impact on CAGR Forecast | Geographic Relevance | Impact Timeline |
|---|---|---|---|
| Abundant Renewable-Energy Supply and 97% Electricity-Tax Rebate | +1.8% | National, strongest in SE1 and SE2 price zones | Long term (≥ 4 years) |
| Hyperscale Capex Surge (Brookfield, AWS, Microsoft, Meta, Evroc) | +2.1% | Stockholm and Rest of Sweden (Strängnäs, Borlänge, Långsele) | Medium term (2-4 years) |
| Stockholm's Dense Open-Access Fibre Backbone (Stokab) | +0.9% | Stockholm metro area | Short term (≤ 2 years) |
| District-Heating Value-Capture Business Models | +0.7% | National, with early adoption in Falun, Borlänge, Stockholm | Medium term (2-4 years) |
| Emergence of Sovereign AI-Cloud Providers such as Evroc | +1.2% | National, with concentration in Stockholm (Arlandastad) | Medium term (2-4 years) |
| Battery-Storage Integration Unlocking Build-Ready Power | +0.8% | Rest of Sweden (Långsele, Marviken), spillover to SE3/SE4 zones | Medium term (2-4 years) |
| Source: Mordor Intelligence | |||


Abundant Renewable-Energy Supply and 97% Electricity-Tax Rebate
Sweden lowers the electricity tax for data-center loads by 97%, cutting levies to 0.6 öre per kilowatt-hour, giving operators a structural cost advantage over continental peers. The benefit compounds with a generation mix roughly split between 75% hydropower and 25% wind, delivering stable prices and low carbon intensity. Long-term power-purchase agreements allow hyperscalers to lock energy costs for 15 years, insulating them from gas-linked volatility in Germany or the Netherlands. Google used this framework when it launched the Europe-north2 region, pairing it with 700 megawatts of wind contracts. The fiscal incentive is embedded in national industrial policy, so developers can model 30-year cash flows with limited tax risk drag.[1]Google Cloud Press Team, “Introducing Europe-north2 Region,” menafn.com
Hyperscale Capex Surge Reshapes Capacity Pipeline
Brookfield plans to spend SEK 95 billion (USD 9.9 billion) on a 750-megawatt Strängnäs campus, while Microsoft has committed USD 3.2 billion to three GPU-rich facilities. These multi-year projects anchor a pipeline that dwarfs traditional colocation cycles and create local demand for batteries, liquid cooling, and prefabricated power modules. Large forward-purchase agreements with Swedish equipment vendors shorten lead times and keep more value inside the country. Construction draws follow-on investment from fiber carriers and modular-build specialists, reinforcing Sweden’s position as a continental AI compute hub. The capex wave carries the largest single uplift to forecast growth, adding an estimated 2.1 percentage points to the market CAGR.[2]Cameron Page, “Brookfield Plots Multi-Billion Euro Data Centre Expansion Project in Sweden,” telcotitans.com
Emergence of Sovereign AI-Cloud Providers
European regulators are pushing for jurisdictionally ring-fenced compute, prompting ventures such as Evroc to allocate EUR 600 million (USD 703 million) for an Arlandastad facility designed for defense and public-sector workloads. Sovereign tenants demand air-gapped networks and on-shore chip supply chains, allowing operators to charge colocation premiums of 20-30%. Sweden’s alignment with the GDPR, political stability, and a mature cyber-law framework make it an attractive host state. Because sovereign projects negotiate multiyear contracts, they improve revenue visibility and support debt-financing terms that are more favorable than those for traditional retail space. Analysts expect sovereign clouds to account for up to one-fifth of Swedish demand by 2030, boosting long-run utilization in new halls.
District-Heating Value-Capture Business Models
Operators now design campuses that export waste heat into municipal grids, generating an additional cash stream while helping cities decarbonize. EcoDataCenter’s Falun and Borlänge sites exemplify the approach, channeling enough thermal energy to warm 10,000 apartments. Heat sales improve project internal rates of return by up to 200 basis points, making Sweden a living laboratory for circular-economy data centers. Municipalities often co-invest in piping and exchanger infrastructure, which lowers initial capex for operators and speeds planning approvals. As energy prices remain volatile, heat-reuse contracts hedge revenue and further anchor clients who value environmental credentials.
Restraints Impact Analysis*
| Restraint | (~) % Impact on CAGR Forecast | Geographic Relevance | Impact Timeline |
|---|---|---|---|
| North-South Grid-Congestion and Power-Transmission Bottlenecks | -1.3% | SE3 and SE4 price zones (southern Sweden) | Short term (≤ 2 years) |
| Lengthy Grid-Connection and Environmental Permitting Cycles | -0.9% | National, most acute in Stockholm and Gothenburg | Medium term (2-4 years) |
| Rising Prime Land Costs in Stockholm Inflating CAPEX | -0.6% | Stockholm metro area | Short term (≤ 2 years) |
| Escalating Ransomware and Cyber-Attack Frequency on Operators | -0.4% | National, with elevated risk in Stockholm and Malmö | Short term (≤ 2 years) |
| Source: Mordor Intelligence | |||
North-South Grid-Congestion and Power-Transmission Bottlenecks
Svenska Kraftnät projects that SE3 and SE4 will remain structurally short of transmission capacity for several years, forcing new Stockholm builds into interconnection queues longer than 36 months. Developers must either pay for hefty grid upgrades or pivot toward northern price zones with headroom near hydropower plants. The congestion risk inflates carrying costs, delays rent commencement, and can breach hyperscale service-level timelines. Some operators mitigate the hurdle by colocating battery arrays that qualify as grid-stabilizing assets, but this adds complexity and capital expenditure. Until the North–South Link upgrade completes, grid scarcity is expected to clip 1.3 percentage points off the market’s compound growth rate.[3]International Energy Agency, “Sweden 2024 Energy Policy Review,” iea.org
Lengthy Grid-Connection and Environmental Permitting Cycles
New data-center builds navigate parallel approval tracks spanning municipal zoning, environmental review, and national grid studies, often stretching development cycles to 2 or even 3 years. EcoDataCenter’s Borlänge campus required council assent in late 2024 and still targets first power only in 2027, illustrating the lag. For hyperscalers aiming to align capacity go-live with hardware refresh cycles, schedule risk raises the cost of capital and can drive them to land-bank years in advance. Developers with local relationships gain an edge, but even experienced players must budget for extended community consultations. The permitting drag subtracts roughly 0.9 percentage points from forecast growth, making timeline discipline a key differentiator.
*Our forecasts treat driver/restraint impacts as directional, not additive. The impact forecasts reflect baseline growth, mix effects, and variable interactions.
Segment Analysis
By Data Center Size: Hyperscale Build Programs Dominate New Supply
Large facilities supplied 46.61% of 2025 capacity, yet hyperscale campuses are set to swing the balance as Brookfield, atNorth and Microsoft commission multi-hundred-megawatt sites. The Sweden data center market for hyperscale developments is forecast to grow at an 8.23% CAGR, outpacing medium- and small-format developments. Developers prefer mega-sites for cost leverage on power purchase contracts, liquid-cooling infrastructure, and district heating links.
Small and medium facilities will persist for edge, IoT, and disaster recovery use cases, but their relative footprint will shrink as tenants consolidate into fewer, denser halls. This scale migration also tightens competition for pre-secured grid capacity, prompting early-stage land banking in hydropower zones. Hyperscale readiness liquid-ready cooling loops, 1.2 PUE targets, and roof loads for direct-to-chip racks have become a baseline specification, compressing differentiation windows for legacy wholesale colocation.


By Tier Type: Regulated Workloads Propel Tier 4 Uptake
Tier 3 remained the workhorse at 61.32% in 2025, balancing redundancy and capital efficiency. However, the Sweden data center market share of Tier 4 is projected to expand fastest at an 8.42% CAGR as BFSI and government buyers demand 2N fault tolerance. Operators achieving Tier IV certification can charge 15–20% price premiums, cushioning margin compression elsewhere.
Stockholm leads adoption due to trading-venue adjacency, whereas edge deployments in manufacturing lean on Tier 2 for cost advantages. Tier 1 and Tier 2 will hold niche roles in content-delivery and caching nodes where localized redundancy mitigates lower facility-level uptime. Uptime Institute certifications remain a procurement staple, influencing insurer risk modeling and lease-rate spreads.
By Data Center Type: Self-Build Strategies Reorder Value Chains
Colocation captured 51.35% of capacity in 2025, yet hyperscale self-build programs are forecast to post an 8.66% CAGR, eroding colocation's share of the Sweden data center market. Owning sites allows cloud majors to negotiate direct 15-year hydropower contracts and retain heat-reuse upside. Retail colocation faces pricing pressure as utilization slips and hyperscalers vacuum up wholesale suites.
Still, retail space garners demand from SMEs, MSPs, and content platforms unwilling to finance stand-alone plants. Providers now differentiate on interconnection density, flexible lease terms, and sovereign-AI compliance. Non-utilized shell space in Stockholm offers tactical lease opportunities once grid upgrades are complete, presenting a timing arbitrage for enterprises with expandable footprints.
By End User: Financial Services Accelerate AI-Driven Adoption
IT and ITES accounted for 55.61% in 2025, but BFSI workloads show a steeper 9.06% CAGR, as real-time payments, algorithmic trading, and regulatory gatekeeping elevate compute intensity. Segment-specific zoning for air-gapped racks, hardware security modules, and mandatory EU-only routing attract banks to Tier 4 halls in metro Stockholm.
Manufacturing and e-commerce invest in edge nodes near production or fulfillment hubs, while government users pivot toward sovereign clouds to ring-fence sensitive datasets. Media and entertainment expand rendering farms for high-resolution streaming, pushing single-rack densities above 70 kW. Telcos integrate 5G core infrastructure into multi-tenant facilities, supporting network slicing with sub-10 ms latency targets.
Geography Analysis
Stockholm accounted for 36.29% of 2025 capacity, anchored by Stokab’s 2.03 million-kilometer open-access fiber grid that underpins sub-millisecond trades into Nasdaq Nordic. Prime rents touched USD 1,000 per sqm in Q4 2024, inflating capex and favoring retrofits or vertical builds. Grid constraints in SE3 and SE4 prolong energization, nudging pipelines northward. Yet the capital retains dense cross-connect demand, enabling operators to charge average monthly recurring revenue above USD 1,900 per cabinet.
Northern and central municipalities, including Strängnäs, Borlänge, and Långsele, benefit from surplus hydropower, land parcels exceeding 30 hectares, and municipal incentives such as expedited planning and co-financed substations. The Sweden data center market size contribution from these areas is on track for an 8.18% CAGR, led by Brookfield’s 750 MW project, EcoDataCenter’s 240 MW campus, and atNorth’s 200 MW battery-integrated site. Cooler ambient temperatures slash chiller loads, pushing PUE targets toward 1.15 and heightening sustainability credentials.
A two-speed topology emerges. Stockholm remains essential for latency-critical BFSI and content-exchange workloads, while bulk AI training, batch analytics and archival storage migrate north to exploit 100% renewable grids and district-heating partnerships. Operators hedge by pairing a metro presence with a northern mega-campus, optimizing both latency and cost. Google’s Europe-north2 launch exemplifies the pattern, combining metro fiber access with 700 MW wind agreements in rural counties.
Competitive Landscape
Market concentration is moderate. Global hyperscalers Microsoft, Google, and Meta are scaling self-built footprints, attenuating wholesale colocation absorption. International providers Equinix and Digital Realty defend their share by expanding renewable PPAs and deepening interconnection marketplaces. Regional specialists such as EcoDataCenter, atNorth, and Bahnhof compete through sustainability branding, heat-reuse monetization, and GDPR-compliant service catalogs.
Technology differentiation clusters around liquid-cooling readiness, on-site battery storage, and district-heating integration. EcoDataCenter’s campuses supply thermal output equivalent to heating 10,000 apartments, boosting project returns and satisfying municipal climate objectives. atNorth’s Långsele plant co-locates large battery arrays, unlocking grid-frequency revenues and faster interconnection approvals. EdgeMode explores small modular reactors for grid independence, although timelines remain provisional.
Capital markets favor operators with shovel-ready land and pre-approved power. CapMan Infra’s April 2025 acquisition of three EcoDataCenter sites signals private-equity appetite for Nordic digital infrastructure. Smaller players such as Conapto target retail segments with flexible contracts and 100% renewable sourcing but confront margin pressure as hyperscale self-builds siphon growth. Overall, competitive intensity is tightening yet still allows specialization, especially in sovereign-AI and edge deployments.
Sweden Data Center Industry Leaders
Microsoft Corporation
Amazon Web Services, Inc.
Meta Platforms, Inc.
Bahnhof AB
EcoDataCenter AB
- *Disclaimer: Major Players sorted in no particular order

Recent Industry Developments
- January 2026: atNorth announced a 30 MW metro data center (SWE02) near its existing SWE01 Stockholm site, designed for cluster deployments with heat-reuse integration.
- September 2025: EcoDataCenter broke ground on a 240 MW Borlänge mega campus, aiming to supply waste heat equivalent to 10,000 apartments and deliver first capacity in early 2027.
- September 2025: EcoDataCenter secured EUR 600 million (USD 703 million) in debt financing to expand Swedish facilities and complete the Falun extension.
- June 2025: Brookfield Asset Management outlined a SEK 95 billion (USD 9.9 billion) investment for a 750 MW Strängnäs campus with future chip-storage and on-site generation.


Sweden Data Center Market Report Scope
The data center market encompasses the infrastructure, services, and technologies that support the storage, management, and processing of data. This market includes various data center sizes, tier classifications, types, end-user industries, and hotspots, reflecting the diverse needs of businesses and organizations operating in the country.
The Sweden Data Center Market Report is Segmented by Data Center Size (Small, Medium, Large, and Hyperscale), Tier Type (Tier 1 and 2, Tier 3, and Tier 4), Data Center Type (Hyperscale/Self-Built, Enterprise/Edge, and Colocation), End User (BFSI, IT and ITES, E-Commerce, Government, Manufacturing, Media and Entertainment, Telecom, and Other End Users), and Hotspot ( Stockholm, and Rest of Sweden). The Market Forecasts are Provided in Terms of IT Load Capacity (Megawatt).
| Small |
| Medium |
| Large |
| Hyperscale |
| Tier 1 and 2 |
| Tier 3 |
| Tier 4 |
| Hyperscale / Self-Built | ||
| Enterprise / Edge | ||
| Colocation | Non-Utilized | |
| Utilized | Retail Colocation | |
| Wholesale Colocation | ||
| BFSI |
| IT and ITES |
| E-Commerce |
| Government |
| Manufacturing |
| Media and Entertainment |
| Telecom |
| Other End Users |
| Stockholm |
| Rest of Sweden |
| By Data Center Size | Small | ||
| Medium | |||
| Large | |||
| Hyperscale | |||
| By Tier Type | Tier 1 and 2 | ||
| Tier 3 | |||
| Tier 4 | |||
| By Data Center Type | Hyperscale / Self-Built | ||
| Enterprise / Edge | |||
| Colocation | Non-Utilized | ||
| Utilized | Retail Colocation | ||
| Wholesale Colocation | |||
| By End User | BFSI | ||
| IT and ITES | |||
| E-Commerce | |||
| Government | |||
| Manufacturing | |||
| Media and Entertainment | |||
| Telecom | |||
| Other End Users | |||
| By Hotspot | Stockholm | ||
| Rest of Sweden | |||


Market Definition
- IT LOAD CAPACITY - The IT load capacity or installed capacity, refers to the amount of energy consumed by servers and network equipments placed in a rack installed. It is measured in megawatt (MW).
- ABSORPTION RATE - It denotes the extend to which the data center capacity has been leased out. For instance, a 100 MW DC has leased out 75 MW, then absorption rate would be 75%. It is also referred as utilization rate and leased-out capacity.
- RAISED FLOOR SPACE - It is an elevated space build over the floor. This gap between the original floor and the elevated floor is used to accommodate wiring, cooling, and other data center equipment. This arrangement assist in having proper wiring and cooling infrastructure. It is measured in square feet (ft^2).
- DATA CENTER SIZE - Data Center Size is segmented based on the raised floor space allocated to the data center facilities. Mega DC - # of Racks must be more than 9000 or RFS (raised floor space) must be more than 225001 Sq. ft; Massive DC - # of Racks must be in between 9000 and 3001 or RFS must be in between 225000 Sq. ft and 75001 Sq. ft; Large DC - # of Racks must be in between 3000 and 801 or RFS must be in between 75000 Sq. ft and 20001 Sq. ft; Medium DC # of Racks must be in between 800 and 201 or RFS must be in between 20000 Sq. ft and 5001 Sq. ft; Small DC - # of Racks must be less than 200 or RFS must be less than 5000 Sq. ft.
- TIER TYPE - According to Uptime Institute the data centers are classified into four tiers based on the proficiencies of redundant equipment of the data center infrastructure. In this segment the data center are segmented as Tier 1,Tier 2, Tier 3 and Tier 4.
- COLOCATION TYPE - The segment is segregated into 3 categories namely Retail, Wholesale and Hyperscale Colocation service. The categorization is done based on the amount of IT load leased out to potential customers. Retail colocation service has leased capacity less than 250 kW; Wholesale colocation services has leased capacity between 251 kW and 4 MW and Hyperscale colocation services has leased capacity more than 4 MW.
- END CONSUMERS - The Data Center Market operates on a B2B basis. BFSI, Government, Cloud Operators, Media and Entertainment, E-Commerce, Telecom and Manufacturing are the major end-consumers in the market studied. The scope only includes colocation service operators catering to the increasing digitalization of the end-user industries.
| Keyword | Definition |
|---|---|
| Rack Unit | Generally referred as U or RU, it is the unit of measurement for the server unit housed in the racks in the data center. 1U is equal to 1.75 inches. |
| Rack Density | It defines the amount of power consumed by the equipment and server housed in a rack. It is measured in kilowatt (kW). This factor plays a critical role in data center design and, cooling and power planning. |
| IT Load Capacity | The IT load capacity or installed capacity, refers to the amount of energy consumed by servers and network equipment placed in a rack installed. It is measured in megawatt (MW). |
| Absorption Rate | It denotes how much of the data center capacity has been leased out. For instance, if a 100 MW DC has leased out 75 MW, then the absorption rate would be 75%. It is also referred to as utilization rate and leased-out capacity. |
| Raised Floor Space | It is an elevated space built over the floor. This gap between the original floor and the elevated floor is used to accommodate wiring, cooling, and other data center equipment. This arrangement assists in having proper wiring and cooling infrastructure. It is measured in square feet/meter. |
| Computer Room Air Conditioner (CRAC) | It is a device used to monitor and maintain the temperature, air circulation, and humidity inside the server room in the data center. |
| Aisle | It is the open space between the rows of racks. This open space is critical for maintaining the optimal temperature (20-25 °C) in the server room. There are primarily two aisles inside the server room, a hot aisle and a cold aisle. |
| Cold Aisle | It is the aisle wherein the front of the rack faces the aisle. Here, chilled air is directed into the aisle so that it can enter the front of the racks and maintain the temperature. |
| Hot Aisle | It is the aisle where the back of the racks faces the aisle. Here, the heat dissipated from the equipment’s in the rack is directed to the outlet vent of the CRAC. |
| Critical Load | It includes the servers and other computer equipment whose uptime is critical for data center operation. |
| Power Usage Effectiveness (PUE) | It is a metric which defines the efficiency of a data center. It is calculated by: (𝑇𝑜𝑡𝑎𝑙 𝐷𝑎𝑡𝑎 𝐶𝑒𝑛𝑡𝑒𝑟 𝐸𝑛𝑒𝑟𝑔𝑦 𝐶𝑜𝑛𝑠𝑢𝑚𝑝𝑡𝑖𝑜𝑛)/(𝑇𝑜𝑡𝑎𝑙 𝐼𝑇 𝐸𝑞𝑢𝑖𝑝𝑚𝑒𝑛𝑡 𝐸𝑛𝑒𝑟𝑔𝑦 𝐶𝑜𝑛𝑠𝑢𝑚𝑝𝑡𝑖𝑜𝑛). Further, a data center with a PUE of 1.2-1.5 is considered highly efficient, whereas, a data center with a PUE >2 is considered highly inefficient. |
| Redundancy | It is defined as a system design wherein additional component (UPS, generators, CRAC) is added so that in case of power outage, equipment failure, the IT equipment should not be affected. |
| Uninterruptible Power Supply (UPS) | It is a device that is connected in series with the utility power supply, storing energy in batteries such that the supply from UPS is continuous to IT equipment even during utility power is snapped. The UPS primarily supports the IT equipment only. |
| Generators | Just like UPS, generators are placed in the data center to ensure an uninterrupted power supply, avoiding downtime. Data center facilities have diesel generators and commonly, 48-hour diesel is stored in the facility to prevent disruption. |
| N | It denotes the tools and equipment required for a data center to function at full load. Only "N" indicates that there is no backup to the equipment in the event of any failure. |
| N+1 | Referred to as 'Need plus one', it denotes the additional equipment setup available to avoid downtime in case of failure. A data center is considered N+1 when there is one additional unit for every 4 components. For instance, if a data center has 4 UPS systems, then for to achieve N+1, an additional UPS system would be required. |
| 2N | It refers to fully redundant design wherein two independent power distribution system is deployed. Therefore, in the event of a complete failure of one distribution system, the other system will still supply power to the data center. |
| In-Row Cooling | It is the cooling design system installed between racks in a row where it draws warm air from the hot aisle and supplies cool air to the cold aisle, thereby maintaining the temperature. |
| Tier 1 | Tier classification determines the preparedness of a data center facility to sustain data center operation. A data center is classified as Tier 1 data center when it has a non-redundant (N) power component (UPS, generators), cooling components, and power distribution system (from utility power grids). The Tier 1 data center has an uptime of 99.67% and an annual downtime of <28.8 hours. |
| Tier 2 | A data center is classified as Tier 2 data center when it has a redundant power and cooling components (N+1) and a single non-redundant distribution system. Redundant components include extra generators, UPS, chillers, heat rejection equipment, and fuel tanks. The Tier 2 data center has an uptime of 99.74% and an annual downtime of <22 hours. |
| Tier 3 | A data center having redundant power and cooling components and multiple power distribution systems is referred to as a Tier 3 data center. The facility is resistant to planned (facility maintenance) and unplanned (power outage, cooling failure) disruption. The Tier 3 data center has an uptime of 99.98% and an annual downtime of <1.6 hours. |
| Tier 4 | It is the most tolerant type of data center. A Tier 4 data center has multiple, independent redundant power and cooling components and multiple power distribution paths. All IT equipment are dual powered, making them fault tolerant in case of any disruption, thereby ensuring interrupted operation. The Tier 4 data center has an uptime of 99.74% and an annual downtime of <26.3 minutes. |
| Small Data Center | Data center that has floor space area of ≤ 5,000 Sq. ft or the number of racks that can be installed is ≤ 200 is classified as a small data center. |
| Medium Data Center | Data center which has floor space area between 5,001-20,000 Sq. ft, or the number of racks that can be installed is between 201-800, is classified as a medium data center. |
| Large Data Center | Data center which has floor space area between 20,001-75,000 Sq. ft, or the number of racks that can be installed is between 801-3,000, is classified as a large data center. |
| Massive Data Center | Data center which has floor space area between 75,001-225,000 Sq. ft, or the number of racks that can be installed is between 3001-9,000, is classified as a massive data center. |
| Mega Data Center | Data center that has a floor space area of ≥ 225,001 Sq. ft or the number of racks that can be installed is ≥ 9001 is classified as a mega data center. |
| Retail Colocation | It refers to those customers who have a capacity requirement of 250 kW or less. These services are majorly opted by small and medium enterprises (SMEs). |
| Wholesale Colocation | It refers to those customers who have a capacity requirement between 250 kW to 4 MW. These services are majorly opted by medium to large enterprises. |
| Hyperscale Colocation | It refers to those customers who have a capacity requirement greater than 4 MW. The hyperscale demand primarily originates from large-scale cloud players, IT companies, BFSI, and OTT players (like Netflix, Hulu, and HBO+). |
| Mobile Data Speed | It is the mobile internet speed a user experiences via their smartphones. This speed is primarily dependent on the carrier technology being used in the smartphone. The carrier technologies available in the market are 2G, 3G, 4G, and 5G, where 2G provides the slowest speed while 5G is the fastest. |
| Fiber Connectivity Network | It is a network of optical fiber cables deployed across the country, connecting rural and urban regions with high-speed internet connection. It is measured in kilometer (km). |
| Data Traffic per Smartphone | It is a measure of average data consumption by a smartphone user in a month. It is measured in gigabyte (GB). |
| Broadband Data Speed | It is the internet speed that is supplied over the fixed cable connection. Commonly, copper cable and optic fiber cable are used in both residential and commercial use. Here, optic cable fiber provides faster internet speed than copper cable. |
| Submarine Cable | A submarine cable is a fiber optic cable laid down at two or more landing points. Through this cable, communication and internet connectivity between countries across the globe is established. These cables can transmit 100-200 terabits per second (Tbps) from one point to another. |
| Carbon Footprint | It is the measure of carbon dioxide generated during the regular operation of a data center. Since, coal, and oil & gas are the primary source of power generation, consumption of this power contributes to carbon emissions. Data center operators are incorporating renewable energy sources to curb the carbon footprint emerging in their facilities. |


Research Methodology
Mordor Intelligence follows a four-step methodology in all our reports.
- Step-1: Identify Key Variables: In order to build a robust forecasting methodology, the variables and factors identified in Step-1 are tested against available historical market numbers. Through an iterative process, the variables required for market forecast are set and the model is built on the basis of these variables.
- Step-2: Build a Market Model: Market-size estimations for the forecast years are in nominal terms. Inflation is not a part of the pricing, and the average selling price (ASP) is kept constant throughout the forecast period for each country.
- Step-3: Validate and Finalize: In this important step, all market numbers, variables and analyst calls are validated through an extensive network of primary research experts from the market studied. The respondents are selected across levels and functions to generate a holistic picture of the market studied.
- Step-4: Research Outputs: Syndicated Reports, Custom Consulting Assignments, Databases & Subscription Platforms


