
Neuroscience Market Size and Share
Market Overview
| Study Period | 2020 - 2031 |
|---|---|
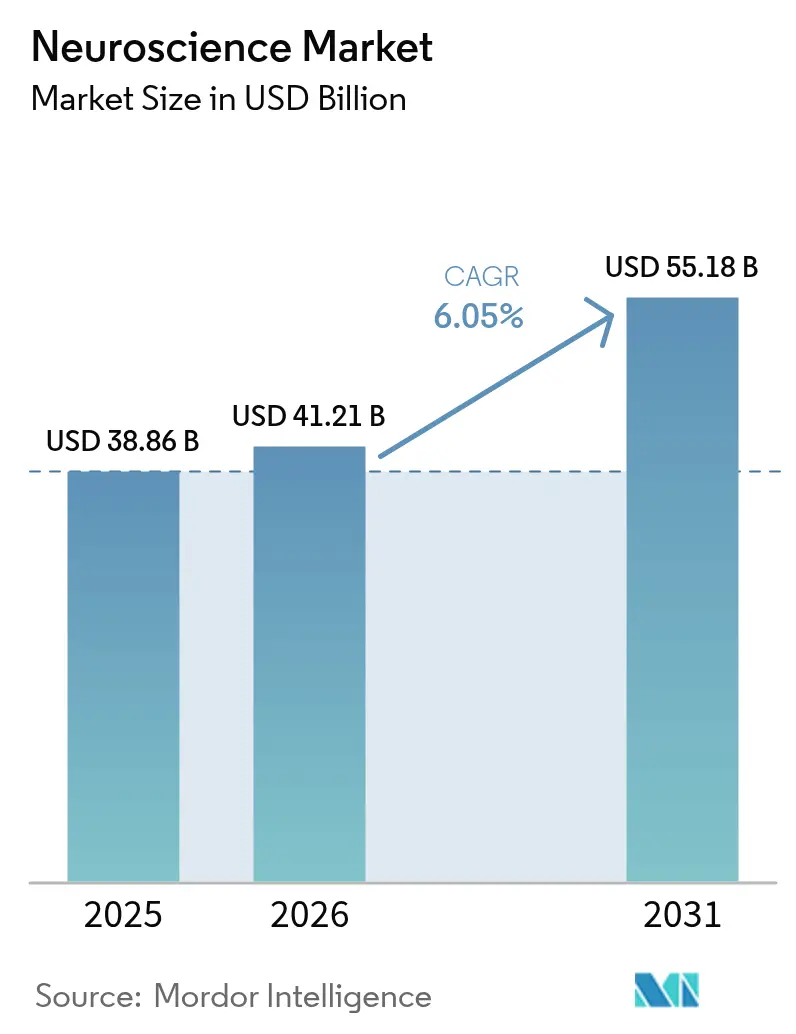
| Market Size (2026) | USD 41.21 Billion |
| Market Size (2031) | USD 55.18 Billion |
| Growth Rate (2026 - 2031) | 6.05 % |
| Fastest Growing Market | Asia Pacific |
| Largest Market | North America |
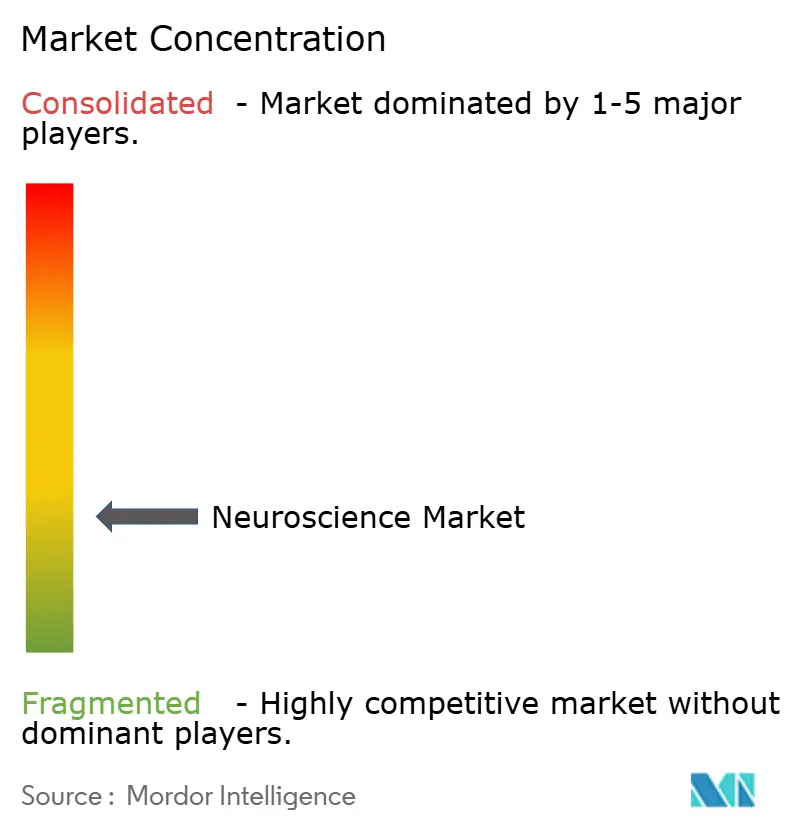
| Market Concentration | Low |
Major Players *Disclaimer: Major Players sorted in no particular order Image © Mordor Intelligence. Reuse requires attribution under CC BY 4.0. | |
Neuroscience Market Analysis by Mordor Intelligence
Neuroscience market size in 2026 is estimated at USD 41.21 billion, growing from 2025 value of USD 38.86 billion with 2031 projections showing USD 55.18 billion, growing at 6.05% CAGR over 2026-2031. The current neuroscience market size underscores substantial momentum as neurological disorders account for 3.4 billion cases worldwide, the highest disease burden across all therapeutic areas[1]Source: World Health Organization, “Over 1 in 3 People Affected by Neurological Conditions, the Leading Cause of Illness and Disability Worldwide,” who.int. Aging demographics, rapid adoption of 7 T and above imaging systems that now yield 0.19 mm resolution, and continuous breakthroughs in adaptive brain-computer interfaces collectively propel demand. Real-time AI decision-support tools, multimodal data fusion platforms, and miniaturized neuro-electronics broaden clinical reach while reducing monitoring costs. However, high upfront equipment costs and evolving ethical frameworks around invasive neurotechnologies temper the growth trajectory and compel market participants to innovate financing and regulatory strategies.
Key Report Takeaways
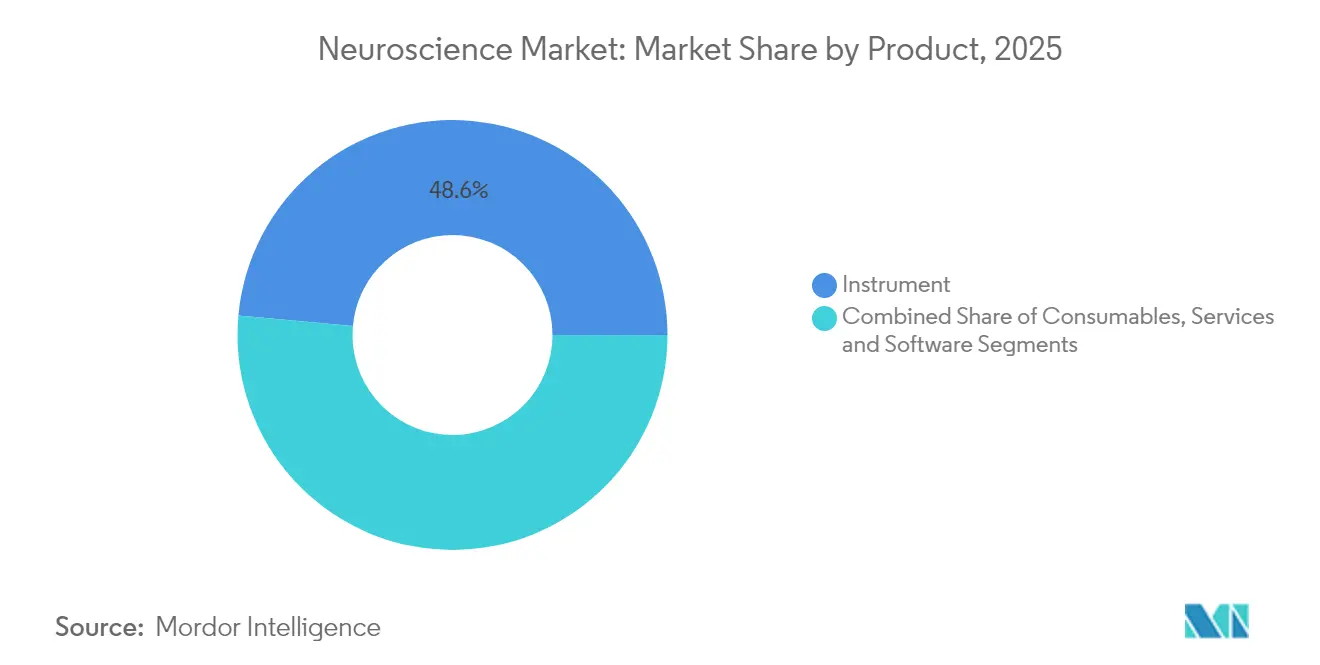
- By product, instruments captured 48.55% of neuroscience market share in 2025; software and services are projected to expand at a 6.11% CAGR through 2031.
- By technology, neuroimaging commanded 41.82% of the neuroscience market size in 2025, while neurostimulation is set to grow at 6.33% CAGR to 2031.
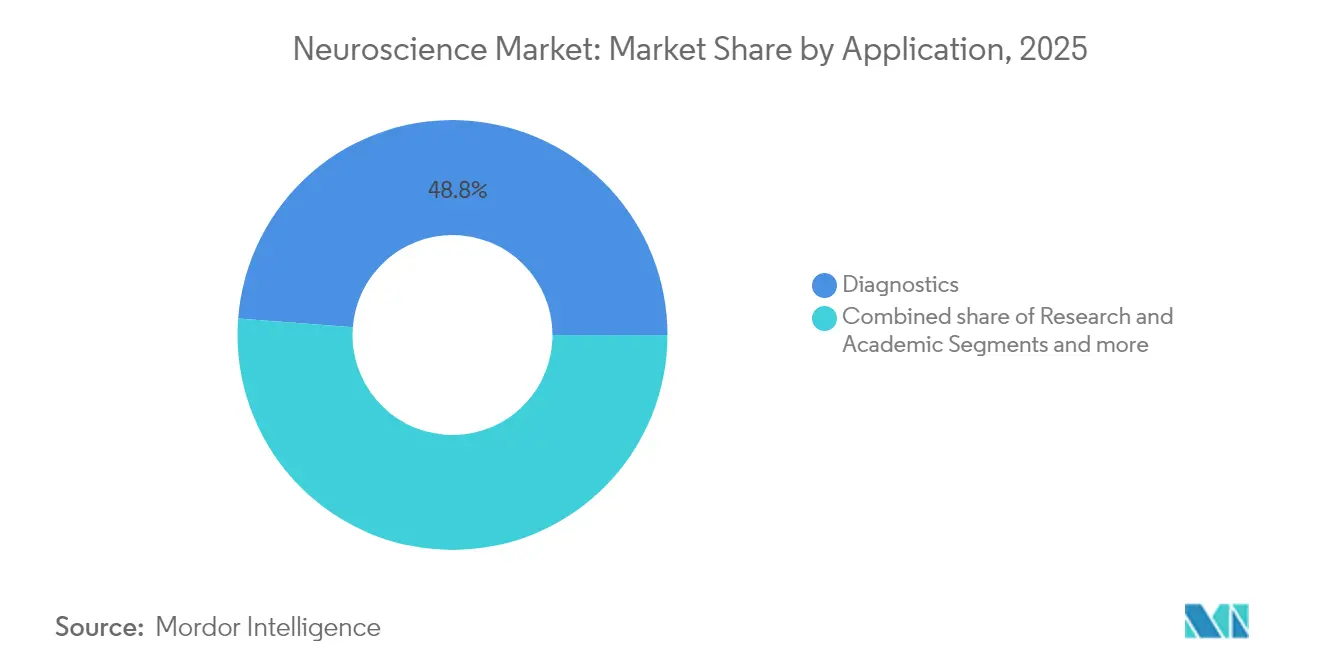
- By application, diagnostics led with 48.78% revenue share in 2025; therapeutics monitoring will advance at a 6.55% CAGR to 2031.
- By end-user, hospitals and clinics held 47.30% share of the neuroscience market size in 2025, whereas diagnostic laboratories record the highest projected CAGR at 6.78% through 2031.
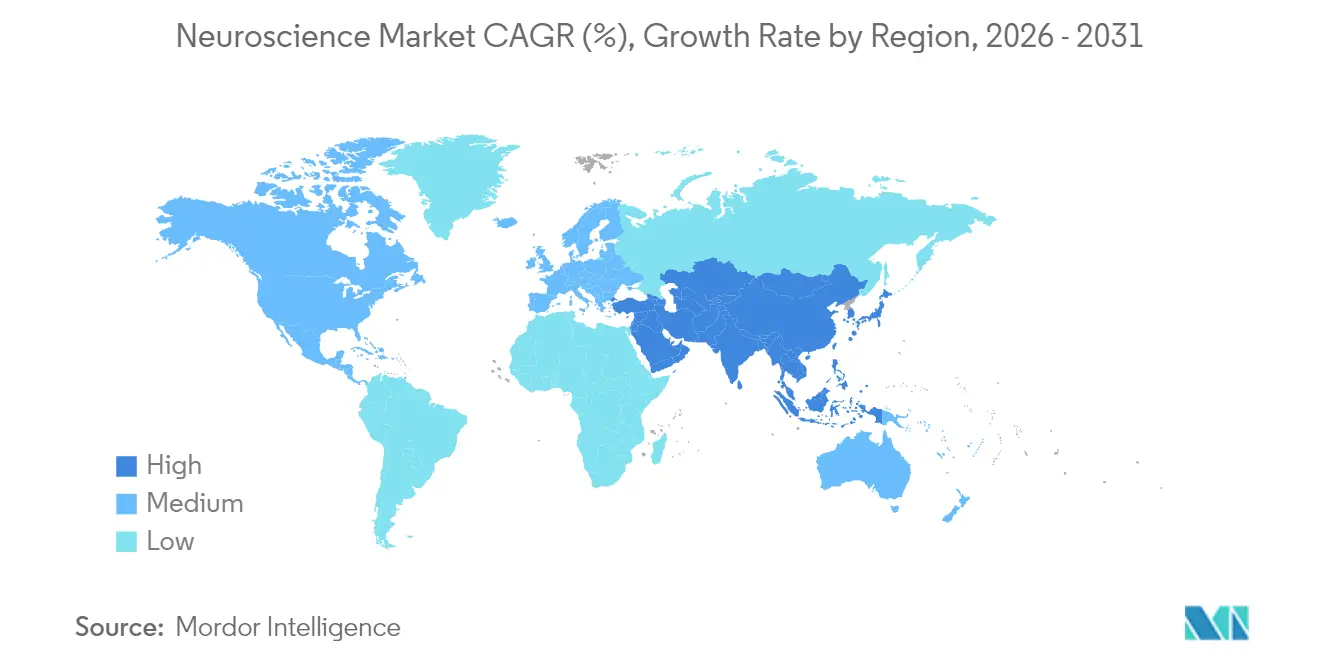
- By geography, North America held 41.90% share of the neuroscience market size in 2025, whereas Asia-Pacific record the highest projected CAGR at 6.97% through 2031.
Note: Market size and forecast figures in this report are generated using Mordor Intelligence’s proprietary estimation framework, updated with the latest available data and insights as of 2026.
Market Trends and Insights
Drivers Impact Analysis of Neuroscience Market*
| Driver | (~) % Impact on CAGR Forecast | Geographic Relevance | Impact Timeline |
|---|---|---|---|
| Rising prevalence of neurodegenerative disorders | +1.8% | Global—greatest in North America, Europe, East Asia | Long term (≥ 4 years) |
| Technological leaps in high-field neuroimaging (7 T +) | +1.2% | North America, EU lead; APAC follows | Medium term (2-4 years) |
| AI-powered multimodal data integration platforms | +1.0% | Global; early adoption in developed markets | Medium term (2-4 years) |
| Miniaturization of neuro-electronics for home monitoring | +0.8% | Global; consumer uptake first in North America, EU | Medium term (2-4 years) |
| Brain-computer interface commercialization wave | +0.7% | North America leads; China and EU accelerate | Long term (≥ 4 years) |
| Growing public & private R&D grants in neuroscience | +0.6% | Concentrated in United States, China, EU | Long term (≥ 4 years) |
| Source: Mordor Intelligence | |||
Rising Prevalence of Neurodegenerative Disorders
Neurological conditions affected 3.4 billion people in 2024, a figure equal to 43.1% of the global population and responsible for 443 million disability-adjusted life years. Disease prevalence climbed 18.2% from 1990 to 2024 and is projected to grow 22% by 2050, with Parkinson’s cases alone expected to hit 25.2 million. AI-enhanced systems now reach 96% diagnostic accuracy for Parkinson’s, illustrating how advanced tools can lower long-term care costs while improving outcomes. Demographic aging in East Asia and Europe intensifies demand for early-stage diagnostics and individualized care pathways. Health-system planners increasingly prioritize preventive neurology programs, supporting sustained procurement of imaging and stimulation equipment across public and private facilities.
Technological Leaps in High-Field Neuroimaging (7 T +)
Ultra-high field MRI unlocks microstructural insights unattainable at lower strengths, enabling clinicians to locate epileptogenic foci and micro-vascular lesions earlier. FDA-cleared 7 T platforms now operate throughout North America and Europe, while the Iseult 11.7 T system demonstrates 0.19 mm resolution for frontier research[2]Source: Neurocritical Care Society, “The Magnetic Power of the Future: The Iseult CEA 11.7 T MRI,” currents.neurocriticalcare.org . Cost curves are beginning to decline as vendors refine magnet design and site requirements. New imaging contrasts and functional modes—including sodium and diffusion kurtosis mapping—enhance differential diagnosis across stroke, multiple sclerosis, and neuro-oncology. Regulators have issued specific safety guidelines, improving clinician confidence and accelerating hospital procurement cycles.
AI-Powered Multimodal Data Integration Platforms
Purpose-built algorithms fuse EEG, fMRI, genomic, and clinical records to present cohesive neural portraits, a capability exemplified by the NeuroBind framework that boosts task performance through unified representations. Large language models trained on neurology cases now outperform seasoned practitioners during blinded evaluations. Intra-operative tools such as FastGlioma classify malignant tissue in 10 seconds with 92% accuracy, shortening surgery times. AI platforms also supply reverse-flow benefits, with neuroscientific insights shaping next-generation machine-learning architectures. Cloud-enabled analytics extend advanced decision support to mid-sized centers, democratizing access to sophisticated interpretation once restricted to academic hospitals.
Miniaturization of neuro-electronics for home monitoring
In-ear EEG and eyeglass-clip systems deliver clinical-grade recordings without bulky rigs, empowering continuous tracking of sleep-based Alzheimer’s biomarkers. Users with epilepsy gain day-to-day seizure probability forecasts through ultra-long-term wearable EEG that meets signal quality benchmarks. Advances in flexible substrates and scalp-agnostic electrodes improve inclusivity across diverse populations. Regulatory agencies now maintain dedicated review teams for neurological wearables, smoothing commercialization. As production volumes rise, unit costs drop, opening retail and telehealth channels that expand the overall neuroscience market.
Restraints Impact Analysis of Neuroscience Market*
| Restraint | (~) % Impact on CAGR Forecast | Geographic Relevance | Impact Timeline |
|---|---|---|---|
| High capital cost of advanced imaging & stimulation systems | -1.4% | Global, with highest impact in emerging markets and smaller healthcare facilities | Medium term (2-4 years) |
| Ethical & regulatory hurdles around invasive neurotech | -0.9% | Global, with varying regulatory frameworks across regions | Long term (≥ 4 years) |
| Data-privacy concerns in cloud-based neuroanalytics | -0.6% | Global, with strongest impact in EU under GDPR and similar privacy-focused regions | Medium term (2-4 years) |
| Shortage of trained neuro-specialists in emerging markets | -0.5% | Emerging markets in APAC, Africa, and Latin America, with spillover effects globally | Long term (≥ 4 years) |
| Source: Mordor Intelligence | |||
High Capital Cost of Advanced Imaging & Stimulation Systems
A state-of-the-art 3 T MRI carries acquisition cost near USD 3.2 million, while 7 T platforms exceed that figure substantially, challenging budget-constrained hospitals. Hourly scanner use fees run USD 480-835, reflecting maintenance, helium, and service contracts. Portable 64-mT MRI priced around USD 200,000 addresses only limited clinical indications. Deep brain stimulation implantation remains cost prohibitive for low-income patients despite reimbursement policies, and neurosurgeon shortages aggravate wait times. Innovative procurement models such as pay-per-scan agreements and public-private leasing ventures are emerging to diffuse ownership risk and accelerate adoption.
Ethical & Regulatory Hurdles Around Invasive Neurotech
Existing device codes did not anticipate neural data streams, leading regulators to craft new rules on mental privacy and long-term patient support. The EU AI Act introduces mandatory risk classification and post-market surveillance for neurodevices, potentially lengthening time-to-market. GDPR further complicates multinational trials by restricting cross-border transfer of raw brain data. Past instances where device makers shuttered operations and left implanted users unsupported spotlight the criticality of continuity-of-care safeguards. Employment-based neuro-monitoring proposals trigger debates on cognitive liberty, prompting additional oversight. Regulators are responding through breakthrough device pathways and conditional approvals tied to post-market evidence collection.
*Our forecasts treat driver/restraint impacts as directional, not additive. The impact forecasts reflect baseline growth, mix effects, and variable interactions.
Neuroscience Market Segment Analysis
By Product:
Instruments Drive the Innovation WaveIn 2025 instruments generated almost half of overall revenue by securing 48.55% of neuroscience market share. Capital-intensive platforms such as 7 T MRI, adaptive deep brain stimulators, and high-density EEG dominate procurement budgets and underpin the neuroscience market size expansion trajectory. Software and services rise fastest at 6.11% CAGR as cloud analytics, real-time visualization dashboards, and algorithm-as-a-service offerings unlock incremental value from installed hardware. Consumables sustain steady demand tied to the volume of molecular assays and electrophysiology tests.
A shift toward outcome-based contracts incentivizes vendors to bundle software capabilities with hardware maintenance, smoothing annual spending for providers. Medtronic’s BrainSense system, cleared in 2025, illustrates a hardware-plus-algorithm model whereby implanted leads stream continuous neural data to adaptive control software for Parkinson’s care. Regulatory agencies now publish dedicated classifications for brain-stimulation programming applications, encouraging specialized independent software vendors. As hospitals prioritize integrated workflows, demand shifts from standalone instruments toward modular ecosystems uniting acquisition, processing, and remote follow-up.



By Technology:
Neuroimaging Retains Command but Stimulation AcceleratesNeuroimaging captured 41.82% of 2025 revenue, cementing its position as the backbone modality within the broader neuroscience market. Growth stems from expanded clinical indications for 7 T scanners, integration of fMRI-fNIRS combos, and availability of specialized gradient systems achieving 500 mT/m strength for connectomics. Neurostimulation, however, is advancing fastest at 6.33% CAGR, buoyed by approvals for adaptive DBS in movement disorders and expanding transcranial magnetic stimulation coverage for depression.
Electrophysiology benefits from wireless sensor miniaturization, making long-term monitoring practical outside tertiary centers. Molecular and cellular assays track underlying disease mechanisms, supporting precision-medicine trials that rely on concurrent imaging- and stimulation-derived biomarkers. Standard-setting bodies continue to refine IEC safety norms, giving health-system administrators clearer guidelines and accelerating capital-planning decisions.
By Application:
Diagnostics Lead While Therapeutic Monitoring Gains PaceDiagnostics functions accounted for 48.78% of 2025 revenue as early detection remains the linchpin for cost-effective neurological care. AI-augmented reporting streamlines radiologist workflow and raises diagnostic yield, reinforcing dominant share. Therapeutic monitoring posts a 6.55% CAGR through 2031 and increasingly relies on closed-loop systems that automatically adjust stimulation intensity based on ongoing neural feedback, illustrating convergence of diagnostics and therapy in one workflow.
Academic and translational research receive stable backing from multi-billion-dollar grant schemes worldwide, underpinning the neuroscience market size for high-precision instruments. Pharmaceutical and biotech pipelines lean on multimodal readouts to validate drug efficacy, creating cross-selling opportunities for integrated imaging-plus-biofluid assay kits. Digital biomarkers derived from wearables further bridge clinic and home environments, enabling 24-hour efficacy assessments.
By End-User:
Hospital Dominance Faces Laboratory MomentumHospitals and clinics controlled 47.30% of sector revenue in 2025 as they deploy complex neuro-imaging suites and surgical neurostimulation theaters. Diagnostic laboratories now log the fastest CAGR at 6.78% as payers endorse centralized higher-volume testing for cost efficiency. Academic centers grow in strategic importance thanks to grant-funded program expansions such as Stanford’s NeuroTech Training that cultivate next-gen talent.
Pharmaceutical sponsors outsource biomarker measurement to specialty labs, driving demand for high-throughput EEG analytics and radioligand assay services. Tele-neurology services extend hospital influence beyond physical walls, while portable devices permit community clinics to offer baseline neuro-screening, thereby enlarging the overall neuroscience market footprint.
Geography Analysis
North America Neuroscience Market
North America led the sector with 41.90% revenue share in 2025 as robust reimbursement policies and early FDA clearances foster rapid technology uptake. Continuous NIH BRAIN Initiative funding of USD 400 million each year sustains a vibrant innovation pipeline. Provider networks increasingly integrate adaptive DBS and wearable EEG into standard care pathways, reinforcing regional leadership.
APAC Neuroscience Market
Asia-Pacific progresses at a 6.97% CAGR thanks to ambitious national programs and a sizeable aging population. China’s policy blueprint for brain-computer interfaces underpins accelerated clinical trials and expanding capital inflows. Japanese manufacturers apply robotics and imaging expertise to next-generation magnet design, whereas India channels health-infrastructure allocations to tertiary care hospitals, broadening market access across socioeconomic tiers.
EMEA Neuroscience Market
Europe maintains balanced growth supported by the EU AI Act that codifies safety and performance obligations, enhancing investor certainty. EMA approvals for novel therapeutics, such as pridopidine for Huntington’s, stimulate complementary diagnostic demand. Middle-East and African markets remain nascent but earn international development support to mitigate neurosurgeon shortages, which currently stand at 0.12 per 100,000 residents in low-income countries versus 2.44 in high-income ones.

Regulatory Landscape
Neuroscience instruments, neurostimulation systems, and neuroanalytics software are regulated primarily as medical devices, with approval pathways varying by risk class and by region. In the United States, neurological devices are regulated under FDA medical device authorities, with neurological device classifications under 21 CFR Part 882. Manufacturers must also align quality systems to FDA requirements, including the Quality Management System Regulation (QMSR) that became effective on February 2, 2026. The update tightened documentation and lifecycle compliance expectations for complex systems such as implantables and connected neuromodulation platforms.
In Europe, Regulation (EU) 2017/745 (MDR) remains the core framework for neurodevices, with an updated version effective from January 1, 2026. It influences clinical evidence requirements, post-market surveillance, and technical documentation for both implantable and non-invasive neuromodulation products. Commission Delegated Regulation (EU) 2026/1359 (adopted March 20, 2026) amends MDR details related to the list of certain Class IIb implantable devices and associated technical documentation assessment exemptions, reflecting ongoing EU efforts to refine administrative load while maintaining safety requirements for higher-risk implants used in neurology.
Value Chain Analysis
The neuroscience value chain spans upstream components, midstream manufacturing and quality compliance, and downstream distribution through clinical channels. Upstream inputs include high-field magnets and gradients for MRI, detectors and radiotracer workflows for PET, electrodes and hermetic packaging for implantables, and medical-grade electronics such as analog front-end chips. Midstream work centers on manufacturing and quality compliance, including ISO 13485 processes for implantable and clinical-grade wearable systems, while downstream activity runs through hospital capital equipment channels, neurosurgery programs, neurology clinics, and specialized diagnostic laboratories.
In invasive BCI and next-generation neuromodulation, the chain is increasingly modular. Clinical-stage developers rely on specialized suppliers and contract development and manufacturing organizations (CDMOs) for electrode arrays, microfabrication, and assembly rather than building full-stack manufacturing in-house. Build timelines can lengthen when access to certified cleanroom capacity, qualified medical-grade chip supply, and high-precision electrode production are constrained. CorTec (implantable neurotechnology CDMO) and Precision BioMEMS (microelectrode array manufacturing capability) reflect this specialized manufacturing layer that helps device firms move from feasibility studies to broader clinical deployment. On the commercialization side, 2026 regulatory milestones for condition-specific and adaptive systems, including FDA approval of Neurovalens Modius Spero for PTSD and CE marking activity for adaptive DBS platforms, also elevate the role of post-market infrastructure, service networks, and software update governance as part of the total value chain.
Competitive Landscape
The neuroscience market shows moderate concentration, with top vendors differentiating via proprietary algorithms, multi-modal capability, and regulatory speed. Medtronic’s adaptive DBS marks the first large-scale deployment of closed-loop neurostimulation, serving more than 40,000 patients worldwide. GE HealthCare and Siemens Healthineers refine helium-light magnets and rapid acquisition sequences that lower total scan time and operational expense. Bruker and Zeiss target pre-clinical imaging and microscopy niches, broadening revenue diversity.
Strategic mergers continue: Boston Scientific purchased pelvic-health neuromodulation specialist Axonics for expanded indication coverage; Globus Medical acquired Nevro to integrate spinal and cranial stimulation platforms. Company press releases confirm expected sales synergies and cross-channel distribution plans. Start-ups like Precision Neuroscience and Neuralink chase minimally invasive BCI form factors with accelerated regulatory timelines thanks to U.S. breakthrough-device pathways.
Competitive dynamics now emphasize AI partnerships, cloud-native infrastructure, and lifecycle service contracts rather than hardware alone. Vendors offering interoperable ecosystems with outcome guarantees gain traction among cost-conscious hospital systems. Meanwhile, open-source tools and global code repositories lower entry barriers for smaller firms, intensifying rivalry in analytics and application-layer software.
Neuroscience Industry Leaders
GE Healthcare
Siemens Helthineers
Medtronic PLC
Abbott Laboratories
Boston Scientific Corporation
- *Disclaimer: Major Players sorted in no particular order
Neuroscience Market Companies Covered in this Report
- Medtronic
- GE HealthCare Technologies Inc.
- Abbott Laboratories
- Boston Scientific
- Siemens Healthineers
- Koninklijke Philips
- Thermo Fisher Scientific
- Nihon Kohden
- Hitachi
- FUJIFILM
- Bruker
- Carl Zeiss
- Bio-Rad Laboratories
- Revvity
- Compumedics
- Alpha Omega Engineering Ltd.
- Axion BioSystems Inc.
- Blackrock Neurotech

Market Opportunities and Future Outlook
Opportunities are concentrated in closed-loop neuromodulation and software-defined clinical workflows that combine sensing, analytics, and therapy into one care pathway. The market already has specific proof points across epilepsy, depression, and PTSD: NeuroPace received FDA approval for its ECoG Assistant (May 2026) to advance AI-driven epilepsy care, Neurolief received FDA PMA for an at-home neuromodulation therapy for major depressive disorder (January 2026), and Neurovalens received FDA approval for Modius Spero for PTSD (July 2026). Together, these approvals point to whitespace for integrated platforms that connect neuromodulation hardware with clinician-facing decision support and longitudinal patient data management, where therapy personalization and monitoring can reduce clinic burden.
A second opportunity area is expansion of translational and clinical research infrastructure that feeds new product pipelines in imaging, stimulation, and BCI. The NIH BRAIN Initiative FY 2026 budget of USD 429 million supports tool development and validation work that can translate into procurement of advanced neuroimaging, electrophysiology, and data-integration platforms in academic medical centers and affiliated hospitals. At the same time, partner-based manufacturing and component sourcing in invasive BCI, including commercial silicon supply agreements, create additional room for qualified suppliers, CDMOs, and software vendors to meet medical-grade requirements while helping device developers scale beyond pilot production and single-center deployments.
Recent Industry Developments in Neuroscience Market
- June 2026: Medtronic launched the GAiTEWAY software platform to connect AI-driven surgical planning, insights, and analytics across its AiBLE ecosystem. The release reinforces the market shift toward integrated digital platforms that extend beyond standalone neurosurgical hardware by linking planning, intraoperative workflow, and post-operative data.
- February 2025: Medtronic earned U.S. FDA approval for BrainSense Adaptive DBS for people with Parkinsons disease. The approval strengthened the commercialization pathway for sensing-enabled, closed-loop therapy models that combine implanted hardware with algorithmic programming and ongoing monitoring.
- October 2024: ADx NeuroSciences partnered with Alamar Biosciences to develop customized biomarker assay solutions using the NULISA platform and ARGO HT System. The collaboration supports higher-sensitivity neuro-biomarker workflows that can accelerate therapeutic development and expand demand for advanced molecular and cellular assay capabilities in neurology-focused labs.


Neuroscience Market Report Scope and Research Methodology
Market Definition and Coverage
For this methodology, the neuroscience market is treated as the revenue generated from tools, consumables, and supporting software and services that are used to study, image, monitor, and diagnose the brain and nervous system in research and clinical settings.
Scope exclusions: We exclude general hospital infrastructure, non-neuroscience lab equipment used for broad biology work, and pure psychiatry care that is not linked to neuroscience technologies or testing.
Segments Covered in This Report
- By Product
- Instruments
- Consumables (reagents, antibodies, assay kits)
- Software & Services
- By Technology
- Neuroimaging (MRI, PET, CT, MEG)
- Neurostimulation / Neuromodulation
- Electrophysiology (EEG, ECoG, EMG)
- Molecular & Cellular Assays
- By Application
- Research & Academic
- Diagnostics
- Therapeutics Monitoring
- By End-User
- Hospitals & Clinics
- Diagnostic Laboratories
- Pharmaceutical & Biotech Companies
- Academic & Research Institutes
- By Geography
- North America
- United States
- Canada
- Mexico
- Europe
- Germany
- United Kingdom
- France
- Italy
- Rest of Europe
- Asia-Pacific
- China
- India
- Japan
- South Korea
- Australia
- Rest of Asia-Pacific
- South America
- Brazil
- Argentina
- Rest of South America
- Middle East and Africa
- GCC
- South Africa
- Rest of Middle East and Africa
- North America
Data Sources, Market Sizing, and Validation
Desk Research
To build the basic market map, we start with public, non-paywalled sources that help confirm demand signals and the operating context. Inputs come from sources such as the World Health Organization for neurological disease burden, the US CDC for epidemiology markers, the NIH for funded research direction, and the OECD for health system indicators that influence testing and adoption.
We also review sources such as US FDA public databases for device clearances, clinical trial registries for pipeline direction, and customs and trade statistics for major equipment and consumables movement where it is relevant. Company annual reports, investor decks, peer-reviewed journals, and reputable press releases are used to track product cycles and pricing patterns. In a few places, paid subscriptions for company financials and patent databases are used to speed up cross-checks, although the model is not dependent on any single paid source. This list is not exhaustive, and many other public references were also used for data collection, validation, and clarification.
Primary Interviews and Surveys
Primary work is used to pressure-test the model assumptions that desk research cannot fully answer, especially on adoption pace, purchasing behavior, and how budgets get allocated across instruments, consumables, and software. We speak with a mix of manufacturers, distributors, hospital and lab stakeholders, and research users across APAC, EMEA, and the Americas so the model reflects real buying and usage patterns.
Distribution of primary research fieldwork respondents
| Company type | Respondent position | Region |
|---|---|---|
| Top tier: 28% | CXOs: 12% | APAC: 40% |
| Mid tier: 54% | Functional/Unit leaders: 31% | EMEA: 36% |
| Smaller Players: 18% | Managers: 57% | Americas: 24% |
Market-Sizing & Forecasting
Sizing begins with a top-down build that reconstructs the demand pool from technology adoption and clinical and research activity, which is then translated into spend across the tools and consumables used in neuroscience workflows. In practice, the model is guided by variables such as neurological disease prevalence indicators, neuroimaging and electrophysiology procedure volumes, research funding direction, installed base replacement cycles for key instruments, and typical consumables pull-through per active system.
Once totals are formed, they are checked using selective bottom-up approximations, such as sampled average selling prices multiplied by estimated shipment or install volumes, and channel checks on consumables run rates. Where coverage is uneven by country, gaps are handled by using proxy indicators like healthcare spend intensity, number of relevant labs and hospitals, and peer market adoption curves, before assumptions are reviewed with interview feedback. Forecasting uses scenario analysis supported by trend lines from the historical base, and then the scenarios are adjusted using expert consensus on funding cycles, purchasing lead times, and technology upgrades.
Data Validation & Update Cycle
Validation is done through multiple passes, starting with internal consistency checks and then cross-checking outputs against independent signals like procedure growth, funding direction, and import patterns for key equipment categories. If a region or technology line shows an unusual jump, the drivers are re-reviewed and, when needed, assumptions are re-tested through follow-up expert outreach.
Before publication, the model and its assumptions go through a structured analyst review so arithmetic, unit logic, and currency timing are consistent across the full time series. The report is refreshed annually, and interim updates are made when material events occur that can shift demand or pricing. Right before delivery, a final pass is completed so clients receive the latest updated view.
Mordor Intelligence's Neuroscience Market Size Compared With Other Published Estimates
Different published neuroscience market values can look far apart because the term neuroscience gets applied to different product sets, and because firms may anchor their math on different base years and pricing assumptions. We also see differences when one study uses broader technology definitions, or when currency conversion timing and inflation treatment are not aligned.
Some estimates appear to bundle adjacent areas like broad neurology therapeutics or wider life science research tooling into the same number, and that naturally pushes the total higher. In Mordor Intelligence, the count is limited to neuroscience technologies and their linked consumables, software, and services, and drug revenues and general lab spend that is not neuroscience-specific are kept outside the total.
Benchmark comparison
| Source | Market Size | Gaps in Research Methodology |
|---|---|---|
| Mordor Intelligence | USD 41.21 B (2026) | |
| Global Consultancy A | USD 44.65 B (2023) | Uses a different base year and may capture a wider revenue pool by treating the market as broader neuroscience spend across earlier-year pricing, which can lift totals when compared to a later-year, technology-linked count. |
| Industry Publisher B | USD 37.12 B (2024) | Leans on a narrower component view and a different forecast window, and parts of software and services can be under-counted if they are tied to systems already installed rather than booked as separate line items. |
Seen together, the spread is mainly explained by what gets counted and the year the pricing and volumes are anchored to. Our approach stays traceable because the totals are built from clear demand indicators (procedure activity, installed base behavior, and research direction) and then checked with practical price and adoption inputs from interviews, which makes the end number easier to reproduce and update.


Key Questions Answered in the Report
How large is the neuroscience market in 2026 and what growth is expected?
The neuroscience market size stands at USD 41.21 billion in 2026 and is projected to reach USD 55.18 billion by 2031, reflecting a 6.05% CAGR.
Which segment grows fastest within the product category?
Software and services, powered by AI analytics and cloud integration, grow at a 6.11% CAGR through 2031.
Why is Asia-Pacific the quickest expanding region?
Government investment, China's BCI roadmap, and expanding healthcare infrastructure drive a 6.97% CAGR in Asia-Pacific.
What technology shows the greatest future upside?
Neurostimulation advances at 6.33% CAGR due to adaptive deep brain stimulation approvals and broader pain and psychiatric indications.
What key barrier restricts adoption of advanced imaging?
Capital expenditure remains a hurdle, with 7 T MRI systems costing well above USD 3 million, though leasing and pay-per-scan models are mitigating the burden.
How are ethical concerns around brain data being addressed?
New provisions in the EU AI Act and post-market surveillance requirements demand risk evaluations, while agencies like the FDA grant conditional clearances under breakthrough pathways.
Page last updated on:


 Your data is secure and never sold or shared.


