Market Overview
| Study Period | 2020 - 2031 |
|---|---|
| Forecast Data Period | 2026 - 2031 |
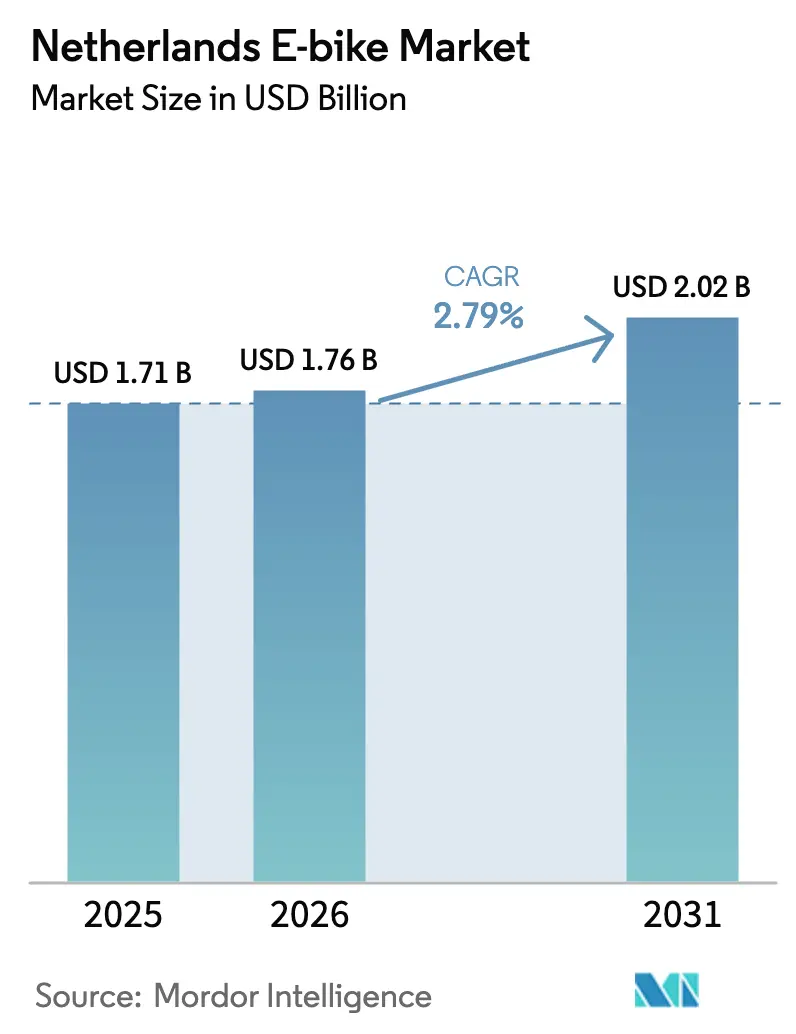
| Base Year Market Size (2025) | USD 1.71 Billion |
| Market Size (2026) | USD 1.76 Billion |
| Market Size (2031) | USD 2.02 Billion |
| Growth Rate (2026 - 2031) | 2.79% CAGR |
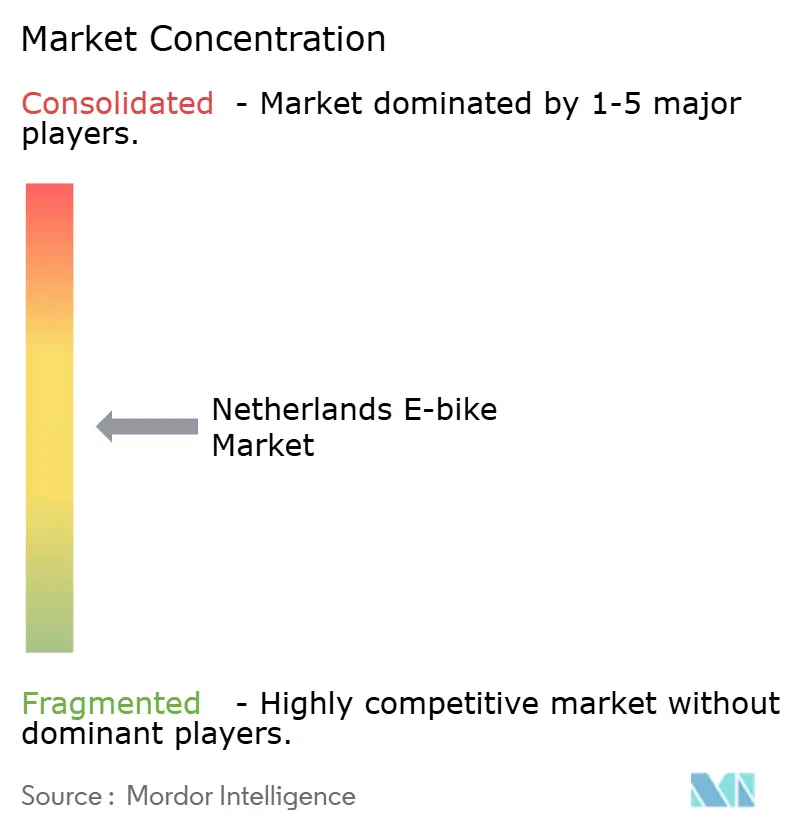
| Market Concentration | Medium |
Major Players*Disclaimer: Major Players sorted in no particular order Image © Mordor Intelligence. Reuse requires attribution under CC BY 4.0. |
|
Netherlands E-bike Market Analysis by Mordor Intelligence
The Netherlands e-bike market size is expected to grow from USD 1.71 billion in 2025 to USD 1.76 billion in 2026 and is forecast to reach USD 2.02 billion by 2031 at 2.79% CAGR over 2026-2031. Demand stabilizes at a high base because e-bikes already captured a significnat chunk of total bicycle unit sales in 2024. Fiscal incentives under the MIA/Vamil schemes, continual expansion of the protected-lane network, and fast-growing corporate mobility budgets sustain incremental volume. Speed pedelecs outpace the broader market, while cargo bikes anchor last-mile delivery strategies in congested inner cities. Competitive pressures revolve around supply-chain resilience, technology integration, and subscription-based business models that lower upfront costs for consumers and fleets.
Key Report Takeaways
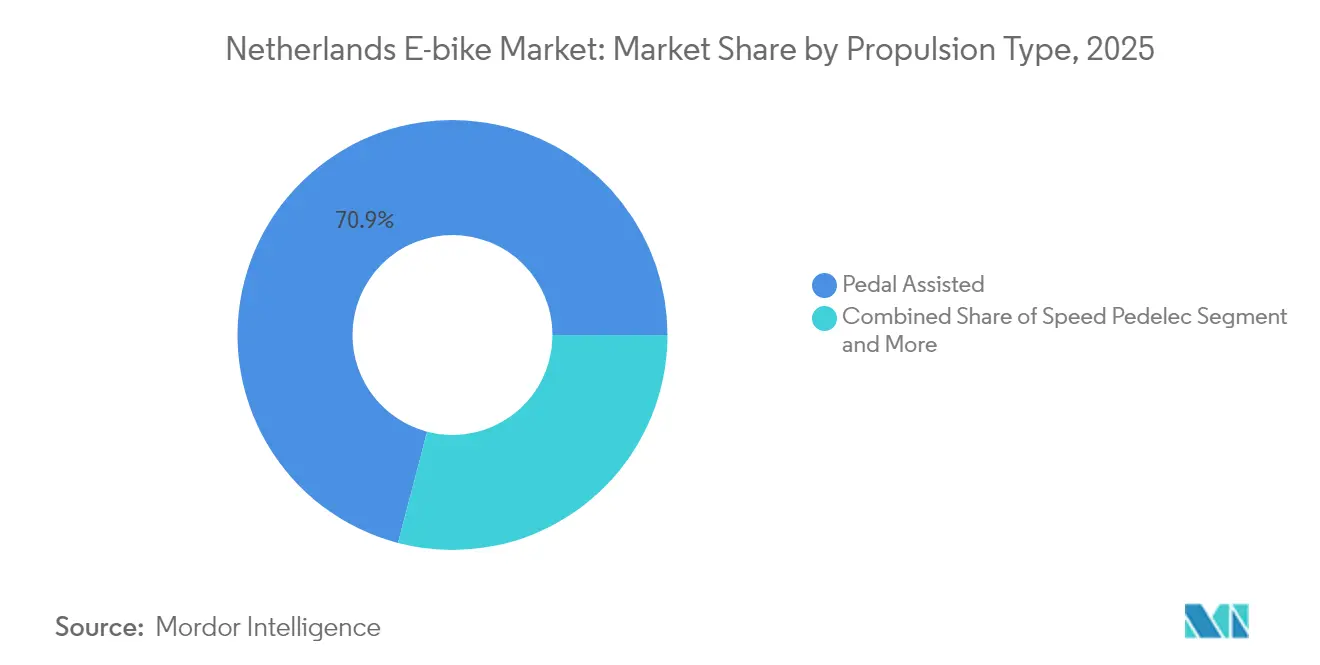
- By propulsion type, pedal-assisted models held 70.92% of the Netherlands e-bike market share in 2025, while speed pedelecs are forecast to expand at an 11.55% CAGR through 2031.
- By application type, city and urban riding accounted for 45.87% of the Netherlands e-bike market size in 2025, whereas cargo and utility bikes are advancing at a 13.98% CAGR through 2031.
- By battery type, lithium-ion systems dominated with a 94.05% revenue share in 2025 and are growing at an 8.53% CAGR through 2031.
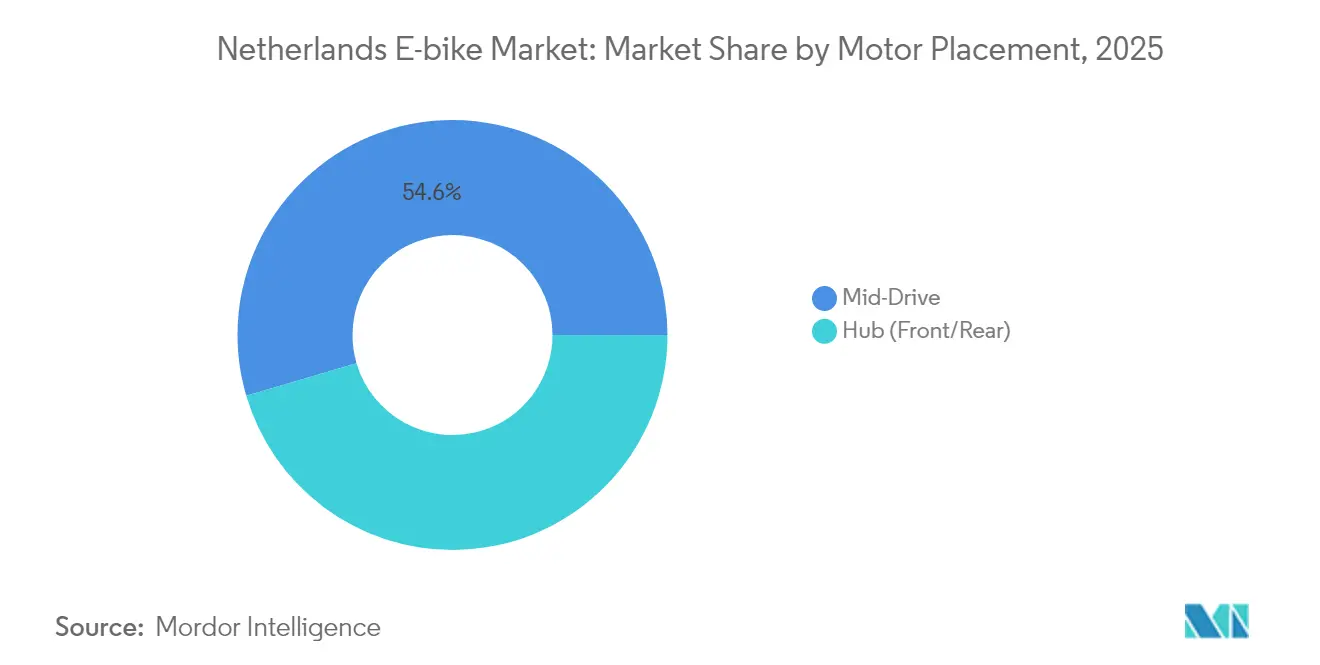
- By motor placement, mid-drive units led with 54.55% share in 2025 and show a 11.88% CAGR outlook through 2031.
- By drive system, chain drives captured 81.72% of 2025 shipments, while belt drives recorded the fastest 10.78% CAGR through 2031.
- By motor power, sub-250 W assemblies held 60.98% share in 2025, whereas 351-500 W units are expanding at a 13.18% CAGR to 2031.
- By price band, models priced USD 1,500 to 2,499 commanded 37.32% of 2025 revenue, while the USD 3,500 to 5,999 tier is growing at a 9.62% CAGR through 2031.
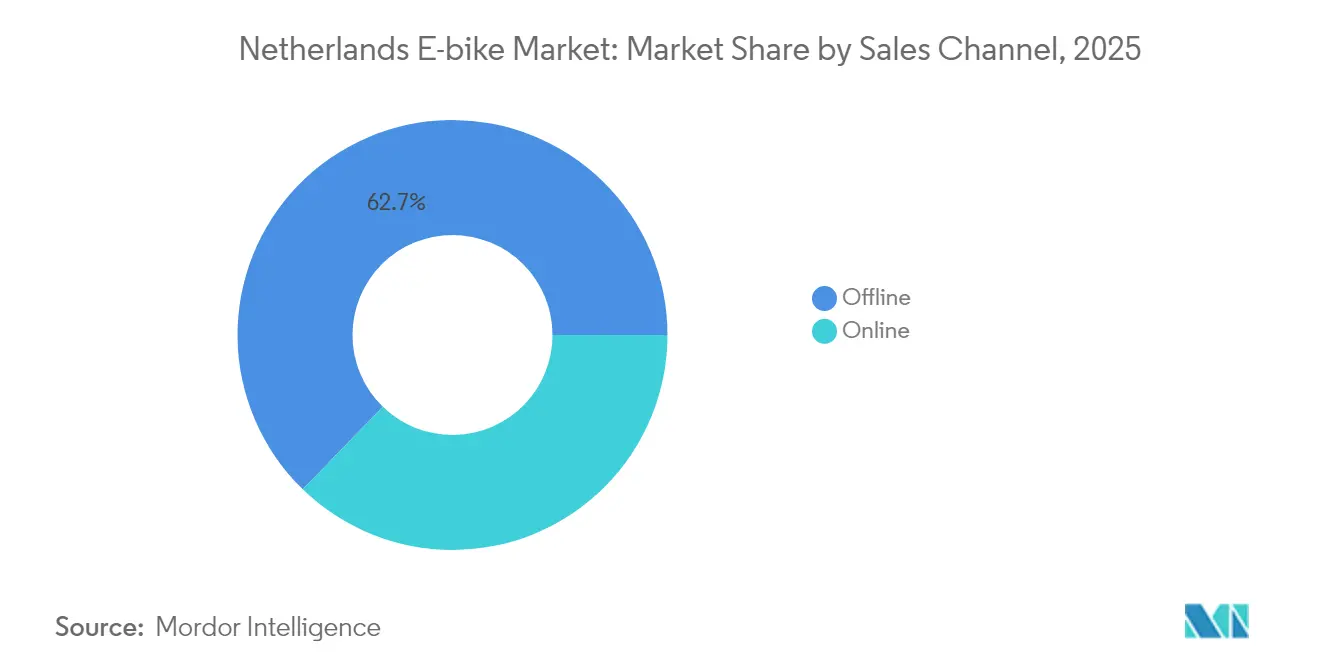
- By sales channel, offline retail retained 62.74% share in 2025, whereas online sales are progressing at a 15.01% CAGR to 2031.
- By end use, personal and family riding held 55.02% of 2025 volume, while commercial delivery exhibits the strongest 16.24% CAGR through 2031.
Note: Market size and forecast figures in this report are generated using Mordor Intelligence’s proprietary estimation framework, updated with the latest available data and insights as of 2026.
Netherlands E-bike Market Trends and Insights
Drivers Impact Analysis*
| Driver | (~) % Impact on CAGR Forecast | Geographic Relevance | Impact Timeline |
|---|---|---|---|
| Government Purchase Subsidies and Tax Incentives | +0.8% | National, with early gains in Amsterdam, Utrecht, Rotterdam | Medium Term (2-4 years) |
| Expansion of Protected-Lane Network | +0.6% | Urban centers, expanding to suburban corridors | Long Term (≥ 4 years) |
| Corporate Mobility-Budget Adoption | +0.5% | Randstad core, spill-over to secondary cities | Short Term (≤ 2 years) |
| Growth of Last-Mile E-Cargo Delivery | +0.4% | Dense urban areas, commercial districts | Medium Term (2-4 years) |
| Urban Congestion-Charge Zones | +0.3% | Amsterdam, Utrecht pilot programs | Long Term (≥ 4 years) |
| Battery-Leasing and Subscription Models | +0.2% | National, concentrated in urban markets | Short Term (≤ 2 years) |
| Source: Mordor Intelligence | |||


Government Purchase Subsidies and Tax Incentives
The Netherlands' MIA (Environmental Investment Allowance) and Vamil (Arbitrary Depreciation of Environmental Investments) schemes enable businesses to deduct e-bike investments from taxable profits. At the same time, the WKR (Working Costs Regulation) exemption makes employer-provided e-bikes tax-neutral for employees. Corporate adoption accelerated to large employers offering bicycle incentives in 2023, up from 2020, with lease providers like Pon's lease a bike managing over 200,000 employee bikes across more than 20,000 companies[1]"E-bike lease with Lease a Bike," Fietsenwinkel.nl, lease.fietsenwinkel.nl. This fiscal architecture transforms e-bikes from personal purchases into strategic mobility assets, enabling companies to reduce parking costs while meeting sustainability targets.
Expansion of Protected-Lane Network
Speed pedelec-specific infrastructure development addresses regulatory ambiguity, with dedicated lanes allowing 45 km/h operation while maintaining separation from conventional traffic. The network expansion particularly benefits longer-distance commuters, as e-bike trip distances average 5.6 km compared to 3.3 km for conventional bicycles. This enables substitution of car trips in the critical 5-15 km range where public transport competitiveness weakens.
Corporate Mobility-Budget Adoption
Corporate mobility budgets evolved from niche sustainability initiatives to mainstream employee benefits, with 5large employers offering financial cycling incentives in 2023. Lease a Bike processes over EUR 70 million in annual social benefits through tax-advantaged employee leasing, while companies report 25-80% cost savings compared to direct purchase programs[2]" International earning potential of the Dutch bicycle sector," Netherlands Enterprise Agency, www.rvo.nl. Professional adoption patterns show e-bikes replacing car commutes for distances between 5-15 kilometers, where electric assistance maintains competitive journey times while avoiding parking costs and congestion delays. Corporate programs increasingly include maintenance packages, theft insurance, and roadside assistance, reducing the total cost of ownership barriers that historically limited e-bike adoption among cost-conscious professional demographics.
Urban Congestion-Charge Zones
Amsterdam's planned congestion charging implementation for 2025-2026 targets the historic city center, while Utrecht advances car-free initiatives and Rotterdam expands low-emission zones affecting delivery vehicles. These policies create economic incentives favoring e-bikes over private vehicles, particularly for trips under 10 km, where cycling time-competitiveness increases. The charging zones complement existing parking restrictions and higher urban parking fees, with e-bike infrastructure receiving priority in space allocation and traffic signal optimization.
Restraints Impact Analysis*
| Restraint | (~) % Impact on CAGR Forecast | Geographic Relevance | Impact Timeline |
|---|---|---|---|
| Supply-Chain Volatility in Li-Ion Cells | -0.5% | Global impact on Netherlands imports | Short Term (≤ 2 years) |
| Rising E-Bike Theft and Insurance Premiums | -0.3% | Urban centers, high-density areas | Medium Term (2-4 years) |
| Competition from E-Mopeds and Microcars | -0.2% | Urban and suburban commuting corridors | Medium Term (2-4 years) |
| Speed-Pedelec Regulatory Ambiguity | -0.1% | National, concentrated in metropolitan regions | Long Term (≥ 4 years) |
| Source: Mordor Intelligence | |||
Supply-Chain Volatility in Li-ion Cells
EU-wide e-bike imports declined 2024[3]"EU e-bike imports drop below 'pre-covid' level in 2024," Bike Europe, bike-eu.com following supply-chain disruptions and inventory corrections post-pandemic, with Taiwan dominating import value while Chinese suppliers face ongoing trade tensions. Battery cost volatility affects mid-range segments most severely, as premium manufacturers can absorb price fluctuations while budget models face margin compression. The Netherlands' position as a re-export hub compounds exposure, with Dutch-origin products falling of export value between 2015 and 2022 as the market increasingly relies on Asian component sourcing.
Rising E-Bike Theft and Insurance Premiums
E-bike thefts are prompting insurers to mandate GPS tracking for expensive e-bike models from April 2024, with KIWA-SCM approving four tracking systems plus ongoing data subscriptions. Insurance premiums escalate as theft claims concentrate in urban areas, while two ART-2 certified locks become mandatory for leasing programs, adding Euro100-200 to purchase costs. Subscription services like Swapfiets build theft replacement into monthly fees but impose surcharges for inadequate locking, creating consumer education challenges around security protocols.
*Our forecasts treat driver/restraint impacts as directional, not additive. The impact forecasts reflect baseline growth, mix effects, and variable interactions.
Segment Analysis
By Propulsion Type: Speed Pedelecs Drive Premium Growth
Pedal-assisted e-bikes maintained 70.92% market share in 2025, anchored by their regulatory simplicity and broad consumer acceptance, while speed pedelecs captured the fastest growth trajectory at 11.55% CAGR through 2031 despite representing a smaller absolute volume. Speed pedelecs benefit from dedicated infrastructure development and appeal to longer-distance commuters seeking car substitution, with average trip distances exceeding 8 km compared to 5.6 km for standard e-bikes. Throttle-assisted models remain niche due to regulatory restrictions limiting their appeal to mobility-impaired users and specific commercial applications.


By Application Type: Cargo Solutions Transform Urban Mobility
City/urban applications commanded 45.87% market share in 2025, reflecting the Netherlands' dense urban geography and cycling culture, while cargo/utility segments demonstrated 13.98% CAGR as commercial operators embrace electric solutions for last-mile delivery. Urban Arrow and Babboe lead cargo innovation with models supporting more than 200 kg payloads and 150 km ranges, targeting both commercial fleets and family transportation needs. Trekking/mountain segments remain smaller but benefit from tourism recovery and recreational cycling growth, particularly in border regions with Germany and Belgium.
The cargo segment's rapid expansion reflects structural shifts in urban logistics, with delivery companies like PostNL and food platforms including Deliveroo adopting electric cargo bikes to navigate congestion zones and meet zero-emission mandates. Family cargo bikes gained traction during COVID-19 as alternatives to second cars, supported by subsidies and improved battery technology enabling longer trips with children and groceries.
By Battery Type: Lithium-Ion Dominance Solidifies
Lithium-ion batteries captured 94.05% market share in 2025, with 8.53% CAGR reflecting steady replacement of legacy lead-acid systems and capacity improvements in existing installations. Battery costs declined while energy density increased, enabling manufacturers to offer more than 500 Wh capacities with more than 100 km ranges in standard configurations. Lead-acid batteries persist in budget segments and specialized applications requiring lower upfront costs, while emerging chemistries, including LFP (Lithium Iron Phosphate), gain adoption for commercial fleets prioritizing cycle life over energy density.
By Motor Placement: Mid-Drive Systems Gain Traction
Mid-drive motors achieved 54.55% market share in 2025 with 11.88% CAGR, benefiting from superior weight distribution, natural pedaling dynamics, and compatibility with existing drivetrain components. Hub motors remain significant in budget segments and urban applications where simplicity and lower maintenance requirements outweigh performance considerations. Bosch's Performance Line SX, launched in late 2023, exemplifies the trend toward lighter, more efficient mid-drive systems weighing approximately 2 kg while delivering enhanced power delivery.
The shift toward mid-drive systems reflects consumer sophistication and willingness to pay premiums for improved riding experience, particularly among commuters and recreational users tackling varied terrain. Hub motors maintain advantages in cargo applications and urban delivery, where robustness and weather resistance outweigh weight considerations, while front-hub systems serve niche applications requiring specific weight distribution.
By Drive System: Belt Drive Innovation Accelerates
Chain drive systems maintained 81.72% market share in 2025, leveraging cost advantages and universal compatibility with existing components, while belt drive systems demonstrated 10.78% CAGR as manufacturers address maintenance and longevity concerns. Belt systems offer quieter operation, reduced maintenance requirements, and longer service intervals, appealing to urban commuters and premium segments, though higher initial costs and limited gear ratio options constrain broader adoption. Gates Carbon Drive and similar systems gain traction in high-end models and corporate fleets where total cost of ownership calculations favor reduced maintenance over upfront savings.
The historical comparison shows belt drive adoption accelerating from negligible levels in 2020 to meaningful market presence by 2024, supported by automatic transmission integration and improved tensioning systems. Cargo bike manufacturers increasingly specify belt drives for commercial applications where reliability and reduced maintenance downtime justify premium pricing.
By Motor Power: Mid-Range Performance Gains Momentum
Motors under 250W dominated with 60.98% market share in 2025, reflecting regulatory limits for standard e-bike classification and broad consumer acceptance of adequate performance for urban applications. The 351 to 500W segment demonstrated the fastest growth at 13.18% CAGR, appealing to users seeking enhanced hill-climbing capability and cargo-carrying performance while remaining within speed pedelec regulations. Higher power categories serve specialized applications, including cargo delivery and off-road recreation, while sub-250W systems benefit from simplified regulations and broader infrastructure access.
Power density improvements enable manufacturers to deliver enhanced performance within regulatory constraints, with Bosch and Shimano systems offering multiple assistance modes and smart power management. The trend toward higher power reflects consumer willingness to pay for improved performance, particularly among commuters facing longer distances and varied terrain.
By Price Band: Premium Segments Drive Value Growth
The USD 1,500 to 2,499 segment commanded 37.32% market share in 2025, representing the sweet spot for quality urban e-bikes with reliable components and adequate range. The USD 3,500 to 5,999 premium segment demonstrated the fastest growth at 9.62% CAGR, driven by corporate leasing adoption, advanced features including connectivity and smart systems, and consumer willingness to invest in long-term transportation solutions. Budget segments below USD 1,500 face margin pressure from supply-chain costs and regulatory compliance requirements, while ultra-premium models above USD 6,000 serve niche applications and early adopters.
By Sales Channel: Digital Transformation Accelerates
Offline channels maintained 62.74% market share in 2025, leveraging specialized bike shops' expertise, test ride capabilities, and service networks essential for complex e-bike purchases. Online channels demonstrated a rapid 15.01% CAGR as direct-to-consumer brands like VanMoof and subscription services, including Swapfiets, bypass traditional retail. At the same time, established retailers develop omnichannel strategies combining online ordering with local delivery and service. The COVID-19 pandemic accelerated digital adoption, though complex products requiring fitting and service maintain offline advantages.
By End Use: Commercial Delivery Segment Surges
Personal and family use dominated with 55.02% market share in 2025, encompassing commuting, recreation, and utility trips that form the foundation of Dutch cycling culture. Commercial delivery applications demonstrated a 16.24% CAGR as last-mile operators embrace electric solutions, with cargo bikes proliferating among food delivery platforms, postal services, and urban logistics providers. Service providers, including maintenance, rental, and sharing services, represent growing segments as mobility-as-a-service models gain acceptance.
The commercial delivery surge reflects structural changes in urban logistics, with companies like CYCLE managing over 14,000 bikes across six countries and partnerships spanning major delivery platforms. Institutional adoption by municipalities, universities, and large employers creates additional growth vectors, while the "others" category encompasses emerging applications, including tourism, healthcare, and specialized services.
Competitive Landscape
Market concentration reflects a hybrid structure combining established Dutch manufacturers with international players and emerging mobility-as-a-service providers. Traditional manufacturers including Royal Dutch Gazelle, Accell Group companies, and Pon Holdings leverage extensive dealer networks and brand heritage, while subscription services like Swapfiets and leasing platforms including Lease a Bike reshape distribution models.
VanMoof's successful restart under McLaren Applied ownership demonstrates resilience in premium direct-to-consumer segments, while cargo specialists Urban Arrow and Babboe command international leadership in commercial applications. Competition intensifies around technology integration, with manufacturers incorporating GPS tracking, smart connectivity, and predictive maintenance capabilities to differentiate offerings and justify premium pricing.
Strategic moves emphasize vertical integration and service expansion, as companies seek to capture value beyond hardware sales through subscription models, insurance products, and fleet management services. Supply-chain consolidation pressures smaller players while benefiting scale operators capable of managing component sourcing volatility and regulatory compliance costs. White-space opportunities emerge in specialized segments including speed pedelecs for longer commutes, commercial cargo solutions for urban logistics, and circular economy models exemplified by Roetz Life's modular, upgradeable designs. Technology deployment focuses on connectivity, theft prevention, and battery optimization, with insurers mandating GPS tracking for high-value models and manufacturers integrating smart systems for fleet optimization and user engagement.
Netherlands E-bike Industry Leaders
-
Accell Group
-
CUBE Bikes
-
Giant Manufacturing Co. Ltd.
-
Pon Holdings B.V.
-
Trek Bicycle Corporation
- *Disclaimer: Major Players sorted in no particular order

Recent Industry Developments
- March 2025: Enyring, a subsidiary of Yamaha, is set to debut an e-bike series in Amsterdam, introducing a unique battery subscription service for e-bikes.
- February 2025: Accell Group completed debt restructuring and operational optimization following financial challenges, focusing on core European markets and premium e-bike segments while divesting non-strategic assets.


Netherlands E-bike Market Report Scope
Pedal Assisted, Speed Pedelec, Throttle Assisted are covered as segments by Propulsion Type. Cargo/Utility, City/Urban, Trekking are covered as segments by Application Type. Lead Acid Battery, Lithium-ion Battery, Others are covered as segments by Battery Type.
By Propulsion Type
| Pedal Assisted |
| Speed Pedelec |
| Throttle Assisted |
By Application Type
| Cargo/Utility |
| City/Urban |
| Trekking/Mountain |
By Battery Type
| Lead-Acid Battery |
| Lithium-ion Battery |
| Others |
By Motor Placement
| Hub (Front/Rear) |
| Mid-Drive |
By Drive Systems
| Chain Drive |
| Belt Drive |
By Motor Power
| Less than 250 W |
| 251 to 350 W |
| 351 to 500 W |
| 501 to 600 W |
| More than 600 W |
By Price Band (USD)
| Up to 1,000 |
| 1,000 to 1,499 |
| 1,500 to 2,499 |
| 2,500 to 3,499 |
| 3,500 to 5,999 |
| Above 6,000 |
By Sales Channel
| Online |
| Offline |
By End Use
| Commercial Delivery | Retail and Goods Delivery |
| Food and Beverage Delivery | |
| Service Providers | |
| Personal and Family Use | |
| Institutional | |
| Others |
| By Propulsion Type | Pedal Assisted | |
| Speed Pedelec | ||
| Throttle Assisted | ||
| By Application Type | Cargo/Utility | |
| City/Urban | ||
| Trekking/Mountain | ||
| By Battery Type | Lead-Acid Battery | |
| Lithium-ion Battery | ||
| Others | ||
| By Motor Placement | Hub (Front/Rear) | |
| Mid-Drive | ||
| By Drive Systems | Chain Drive | |
| Belt Drive | ||
| By Motor Power | Less than 250 W | |
| 251 to 350 W | ||
| 351 to 500 W | ||
| 501 to 600 W | ||
| More than 600 W | ||
| By Price Band (USD) | Up to 1,000 | |
| 1,000 to 1,499 | ||
| 1,500 to 2,499 | ||
| 2,500 to 3,499 | ||
| 3,500 to 5,999 | ||
| Above 6,000 | ||
| By Sales Channel | Online | |
| Offline | ||
| By End Use | Commercial Delivery | Retail and Goods Delivery |
| Food and Beverage Delivery | ||
| Service Providers | ||
| Personal and Family Use | ||
| Institutional | ||
| Others | ||


Market Definition
- By Application Type - E-bikes considered under this segment include city/urban, trekking, and cargo/utility e-bikes. The common types of e-bikes under these three categories include off-road/hybrid, kids, ladies/gents, cross, MTB, folding, fat tire, and sports e-bike.
- By Battery Type - This segment includes lithium-ion batteries, lead-acid batteries, and other battery types. The other battery type category includes nickel-metal hydroxide (NiMH), silicon, and lithium-polymer batteries.
- By Propulsion Type - E-bikes considered under this segment include pedal-assisted e-bikes, throttle-assisted e-bikes, and speed pedelec. While the speed limit of pedal and throttle-assisted e-bikes is usually 25 km/h, the speed limit of speed pedelec is generally 45 km/h (28 mph).
| Keyword | Definition |
|---|---|
| Pedal Assisted | Pedal-assist or pedelec category refers to the electric bikes that provide limited power assistance through torque-assist system and do not have throttle for varying the speed. The power from the motor gets activated upon pedaling in these bikes and reduces human efforts. |
| Throttle Assisted | Throttle-based e-bikes are equipped with the throttle assistance grip, installed on the handlebar, similarly to motorbikes. The speed can be controlled by twisting the throttle directly without the need to pedal. The throttle response directly provides power to the motor installed in the bicycles and speeds up the vehicle without paddling. |
| Speed Pedelec | Speed pedelec is e-bikes similar to pedal-assist e-bikes as they do not have throttle functionality. However, these e-bikes are integrated with an electric motor which delivers power of approximately 500 W and more. The speed limit of such e-bikes is generally 45 km/h (28 mph) in most of the countries. |
| City/Urban | The city or urban e-bikes are designed with daily commuting standards and functions to be operated within the city and urban areas. The bicycles include various features and specifications such as comfortable seats, sit upright riding posture, tires for easy grip and comfortable ride, etc. |
| Trekking | Trekking and mountain bikes are special types of e-bikes that are designed for special purposes considering the robust and rough usage of the vehicles. These bicycles include a strong frame, and wide tires for better and advanced grip and are also equipped with various gear mechanisms which can be used while riding in different terrains, rough grounded, and tough mountainous roads. |
| Cargo/Utility | The e-cargo or utility e-bikes are designed to carry various types of cargo and packages for shorter distances such as within urban areas. These bikes are usually owned by local businesses and delivery partners to deliver packages and parcels at very low operational costs. |
| Lithium-ion Battery | A Li-ion battery is a rechargeable battery, which uses lithium and carbon as its constituent materials. The Li-Ion batteries have a higher density and lesser weight than sealed lead acid batteries and provide the rider with more range per charge than other types of batteries. |
| Lead Acid Battery | A lead acid battery refers to sealed lead acid battery having a very low energy-to-weight and energy-to-volume ratio. The battery can produce high surge currents, owing to its relatively high power-to-weight ratio as compared to other rechargeable batteries. |
| Other Batteries | This includes electric bikes using nickel–metal hydroxide (NiMH), silicon, and lithium-polymer batteries. |
| Business-to-Business (B2B) | The sales of e-bikes to business customers such as urban fleet and logistics company, rental/sharing operators, last-mile fleet operators, and corporate fleet operators are considered under this category. |
| Business-to-Customers (B2C) | The sales of electric scooters and motorcycles to direct consumers is considered under this category. The consumers acquire these vehicles either directly from manufacturers or from other distributers and dealers through online and offline channel. |
| Unorganized Local OEMs | These players are small local manufacturers and assemblers of e-bikes. Most of these manufacturers import the components from China and Taiwan and assemble them locally. They offer the product at low cost in this price sensitive market which give them advantage over organized manufacturers. |
| Battery-as-a-Service | A business model in which the battery of an EV can be rented from a service provider or swapped with another battery when it runs out of charge |
| Dockless e-Bikes | Electric bikes that have self-locking mechanisms and a GPS tracking facility with an average top speed of around 15mph. These are mainly used by bike-sharing companies such as Bird, Lime, and Spin. |
| Electric Vehicle | A vehicle which uses one or more electric motors for propulsion. Includes cars, scooters, buses, trucks, motorcycles, and boats. This term includes all-electric vehicles and hybrid electric vehicles |
| Plug-in EV | An electric vehicle that can be externally charged and generally includes all-electric vehicles as well as plug-in hybrids. In this report we use the term for all-electric vehicles to differentiate them from plug-in hybrid electric vehicles. |
| Lithium-Sulphur Battery | A rechargeable battery that replaces the liquid or polymer electrolyte found in current lithium-ion batteries with sulfur. They have more capacity than Li-ion batteries. |
| Micromobility | Micromobility is one of the many modes of transport involving very-light-duty vehicles to travel short distances. These means of transportation include bikes, e-scooters, e-bikes, mopeds, and scooters. Such vehicles are used on a sharing basis for covering short distances, usually five miles or less. |
| Low Speed Electric Vehicls (LSEVs) | They are low speed (usually less than 25 kmph) light vehicles that do not have an internal combustion engine, and solely use electric energy for propulsion. |


Research Methodology
Mordor Intelligence follows a four-step methodology in all its reports.
- Step-1: Identify Key Variables: To build a robust forecasting methodology, the variables and factors identified in Step-1 are tested against available historical market numbers. Through an iterative process, the variables required for market forecast are set and the model is built based on these variables.
- Step-2: Build a Market Model: Market-size estimations for the historical and forecast years have been provided in revenue and volume terms. Market revenue is calculated by multiplying the volume demand with volume-weighted average battery pack price (per kWh). Battery pack price estimation and forecast takes into account various factors affecting ASP, such as inflation rates, market demand shifts, production costs, technological developments, and consumer preferences, providing estimations for both historical data and future trends.
- Step-3: Validate and Finalize: In this important step, all market numbers, variables, and analyst calls are validated through an extensive network of primary research experts from the market studied. The respondents are selected across levels and functions to generate a holistic picture of the market studied.
- Step-4: Research Outputs: Syndicated Reports, Custom Consulting Assignments, Databases & Subscription Platforms


