
Net-Zero Energy Buildings Market Size and Share
Market Overview
| Study Period | 2020 - 2031 |
|---|---|
| Market Size (2026) | USD 37.40 Billion |
| Market Size (2031) | USD 74.20 Billion |
| Growth Rate (2026 - 2031) | 14.68 % |
| Fastest Growing Market | Asia-Pacific |
| Largest Market | Asia-Pacific |
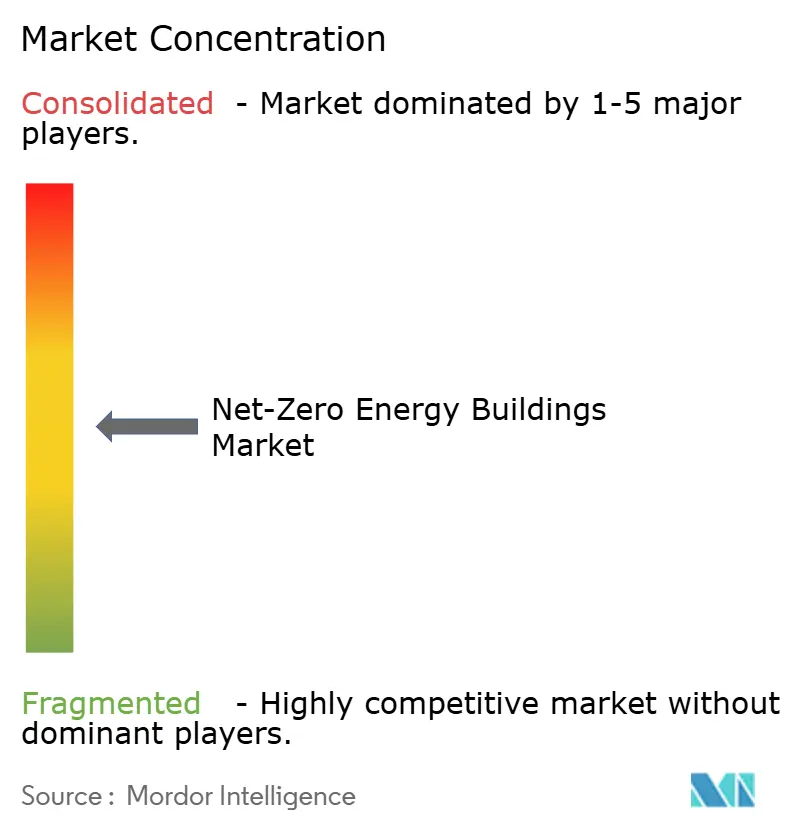
| Market Concentration | Medium |
Major Players *Disclaimer: Major Players sorted in no particular order Image © Mordor Intelligence. Reuse requires attribution under CC BY 4.0. | |
Net-Zero Energy Buildings Market Analysis by Mordor Intelligence
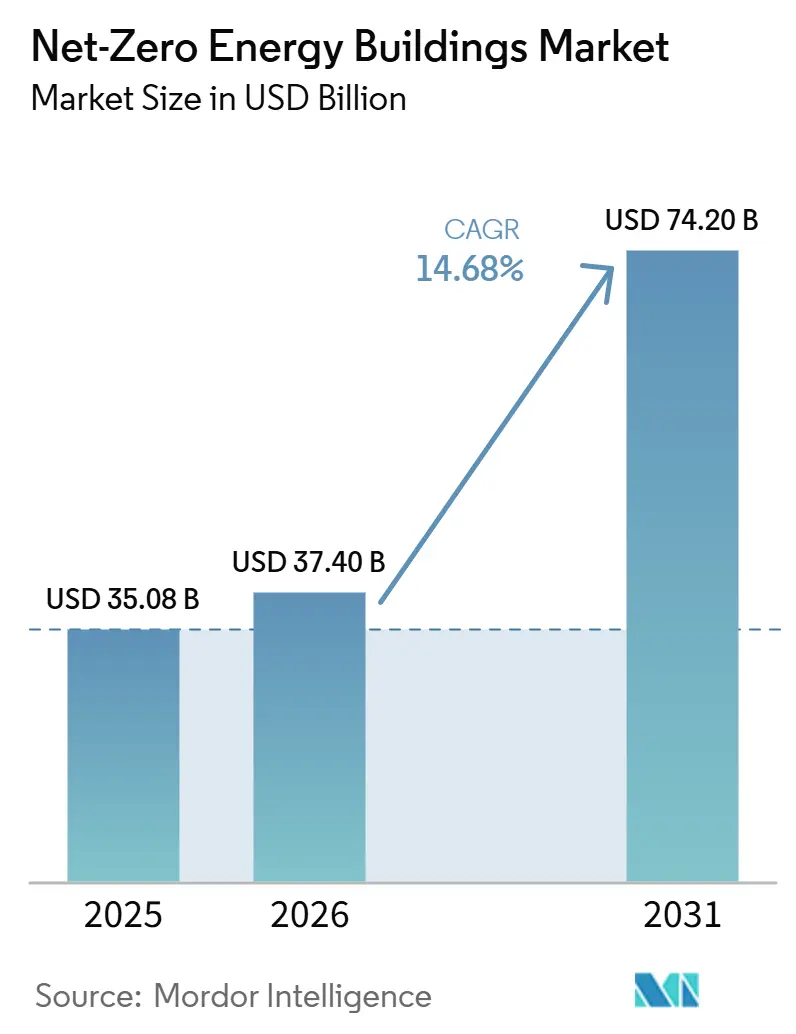
The Net-Zero Energy Buildings Market size was valued at USD 35.08 billion in 2025 and is estimated to grow from USD 37.40 billion in 2026 to reach USD 74.20 billion by 2031, at a CAGR of 14.68% during the forecast period (2026-2031).
The market is shaped by tighter building-performance rules, corporate decarbonization commitments, and lower-cost renewable energy systems. Buildings remain responsible for 34% of global energy-related CO2 emissions, underscoring the need to keep building efficiency central to national climate plans. The revised EU Energy Performance of Buildings Directive requires zero-emission standards for new public buildings from 2028 and all new buildings from 2030. These requirements shorten development planning cycles and make energy performance part of early project design. The net-zero energy buildings market is also moving toward continuous performance management because solar generation, storage, controls, and commissioning must work together over a building’s operating life.
Key Report Takeaways
- By building type, commercial buildings accounted for 43.8% of the net-zero energy market share in 2025, while institutional buildings recorded the highest projected CAGR at 15.6% through 2031.
- By offerings, solutions accounted for 68.4% of revenue in 2025, while services recorded the highest projected CAGR at 15.9% through 2031.
- By construction type, new construction accounted for 71.2% of the net-zero energy buildings market size in 2025, while renovation recorded the highest projected CAGR at 16.2% through 2031.
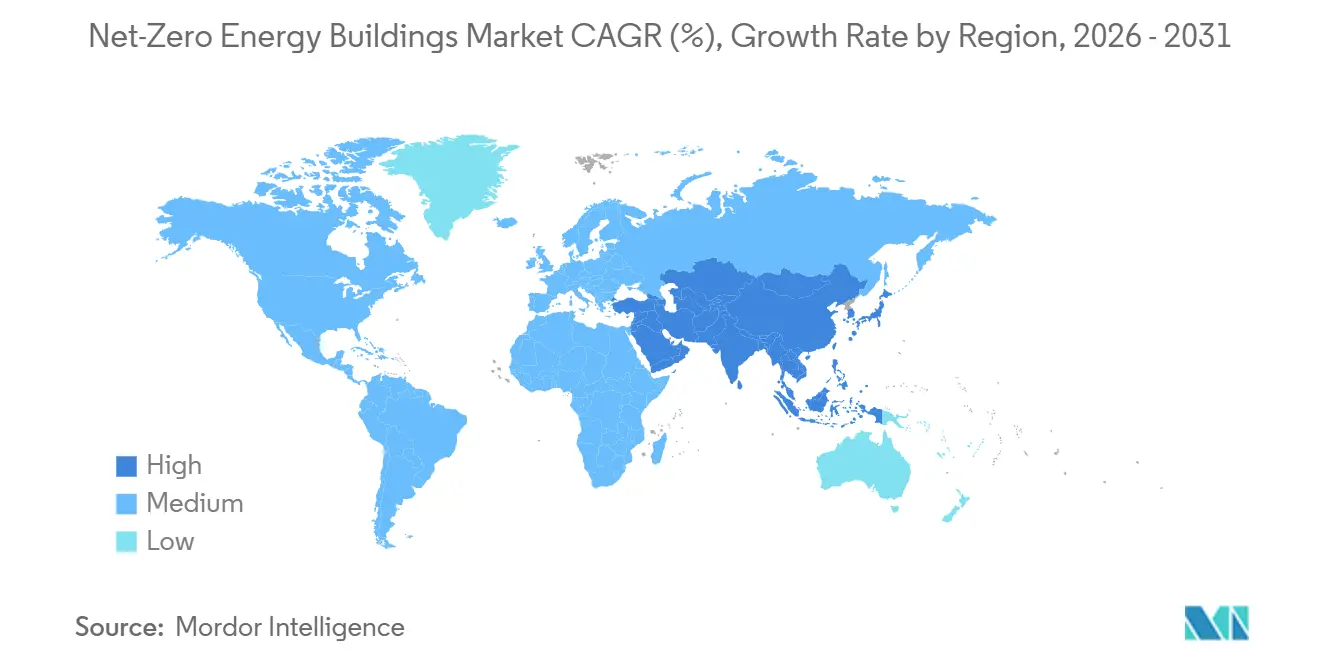
- By geography, Asia-Pacific held 37.1% of revenue in 2025 and recorded the highest projected CAGR at 16.8% through 2031.
Note: Market size and forecast figures in this report are generated using Mordor Intelligence’s proprietary estimation framework, updated with the latest available data and insights as of January 2026.
Market Trends and Insights
Drivers Impact Analysis of Net-Zero Energy Buildings Market*
| Drivers | (~) % Impact on CAGR Forecast | Geographic Relevance | Impact Timeline |
|---|---|---|---|
| Regulatory Mandates and Building Standards | +4.0% | Global, concentrated in Europe, North America, China, and Australia | Short term (≤ 2 years) |
| Renewable Integration and Smart Technologies | +3.5% | Global, with Asia-Pacific as a core region | Medium term (2-4 years) |
| Deep Energy Retrofits and Electrification Programs | +2.5% | North America and Europe, with spillover to Asia-Pacific | Medium term (2-4 years) |
| Energy Cost Volatility and Building Energy Resilience | +2.0% | Global, concentrated in Europe and the Middle East and Africa | Short term (≤ 2 years) |
| Grid-Interactive Building Solutions | +1.5% | North America, Europe, and advanced Asia-Pacific markets | Medium term (2-4 years) |
| Performance-Based Delivery | +1.2% | North America and Europe | Long term (≥ 4 years) |
| Source: Mordor Intelligence | |||
Regulatory Mandates and Building Standards
Building codes increasingly drive project demand rather than merely set minimum standards. The EU’s recast Energy Performance of Buildings Directive, in force since May 2024, requires all new buildings owned by public bodies to be zero-emission from January 2028. The requirement will extend to all other new buildings from January 2030. Member states must transpose the directive into national law by May 29, 2026. The text also notes that the European Commission confirmed that all 27 member states missed this deadline and opened infringement procedures against them in July 2026.
The UK’s Future Homes and Buildings Standards will take effect on March 24, 2027. They will introduce a legal requirement for on-site renewable electricity generation, effectively rooftop solar, in new dwellings, along with mandatory low-carbon heating.
Mandates are also tightening outside Europe. California’s 2025 Title 24 Building Energy Efficiency Standards will extend photovoltaic and battery storage requirements to nonresidential and high-rise multifamily buildings. These standards build on the state’s existing residential solar mandate and support the market’s progress toward California’s broader net-zero-by-2045 target.
Renewable Integration and Smart Technologies
Operational controls determine whether a building maintains net-zero performance after construction. Trane Technologies and Amazon reported nearly 15% reductions in energy use across 3 fulfillment-center pilots using BrainBox AI. The companies announced deployment across more than 30 Amazon Grocery fulfillment centers in 2026. Smart controls can coordinate HVAC equipment, distributed generation, storage, and occupancy conditions. As codes shift toward measured performance, monitoring and optimization become more important to compliance. This creates recurring demand for digital building-management tools in the net-zero energy buildings market.
Deep Energy Retrofits and Electrification Programs
Public programs are establishing repeatable routes for deep-retrofit procurement and financing. Massachusetts awarded USD 20.5 million in its fourth Climate Ready Housing funding round for affordable housing retrofits targeting at least 50% energy savings per project. New York authorized a USD 5.4 billion energy-efficiency and building-electrification portfolio for 2026 through 2030. Nearly 30% of that investment is allocated to low- to moderate-income households. Canada’s Deep Retrofit Accelerator Initiative supports market transformation in commercial, institutional, and mid- to high-rise residential buildings. These programs reduce transaction barriers through standardized delivery approaches, thereby widening the net-zero energy buildings market beyond isolated demonstration projects.
Energy Cost Volatility and Building Energy Resilience
Energy price instability is changing how owners assess net-zero investment decisions. On-site generation, storage, and responsive controls can reduce exposure to uncertain energy costs. The World Economic Forum reported that building decarbonization projects often need stronger risk-reduction mechanisms to attract private capital. Financing structures, therefore, remain important to wider deployment. Energy resilience can become a financial planning consideration for commercial operators when long-term energy budgets are difficult to predict. This relationship supports demand for systems that manage both consumption and onsite energy resources across the net-zero energy buildings market.
Restraints Impact Analysis of Net-Zero Energy Buildings Market*
| Restraints | (~) % Impact on CAGR Forecast | Geographic Relevance | Impact Timeline |
|---|---|---|---|
| High Upfront Capital Requirements | -2.5% | Global, most acute in emerging markets and the Middle East and Africa | Medium term (2-4 years) |
| Shortage of Skilled Decarbonization Professionals | -2.0% | Europe and North America, increasingly Asia-Pacific | Medium term (2-4 years) |
| Complex Building System Integration | -1.5% | Global | Short term (≤ 2 years) |
| Interoperability and Cybersecurity Risks | -1.2% | Global, concentrated in North America and Europe | Short term (≤ 2 years) |
| Source: Mordor Intelligence | |||
High Upfront Capital Requirements
Net-zero energy buildings typically cost 5-15% more to construct than conventional buildings. This premium stems from enhanced insulation, high-performance windows and airtight envelopes, efficient HVAC and heat pump systems, and on-site renewable generation, such as solar PV. For a typical residential project, the additional upfront cost ranges from approximately USD 15,000 to USD 50,000, while commercial projects incur proportionally higher costs depending on size and system complexity.
Energy savings offset these costs over time. Payback periods typically range from 8 to 15 years for residential buildings and 10 to 20 years for commercial buildings, with energy bills eliminated or sharply reduced. However, the gap between upfront capital expenditure and the realization of savings creates a persistent affordability barrier. This challenge is particularly acute for developers and buyers who face capital constraints during construction or do not expect to hold the asset long enough to capture the full payback.
Shortage of Skilled Decarbonization Professionals
Labor availability can delay projects even when finance and technology are available. The draft identifies shortages among energy auditors, commissioning agents, HVAC technicians, and heat-pump specialists. These roles support certification, diagnostics, installation, and system integration. General construction capacity alone cannot meet this specialized need. The constraint is most severe in renovation projects, where existing systems require a detailed, site-specific assessment. It can slow delivery across the net-zero energy buildings market when project demand rises faster than specialist training capacity can keep pace.
*Our forecasts treat driver/restraint impacts as directional, not additive. The impact forecasts reflect baseline growth, mix effects, and variable interactions.
Net-Zero Energy Buildings Market Segment Analysis
By Building Type:
Institutional Demand Supports the Fastest GrowthInstitutional buildings are forecast to grow at a 15.6% CAGR through 2031, the highest rate within the building-type category. Hospitals, schools, and public facilities face defined public-sector emissions requirements. The NHS aims to reduce emissions by 80% by 2028 to 2032 and reach net-zero by 2040. The Countess of Chester Hospital was confirmed as England’s first verified NHS net-zero building in September 2025. These public commitments make institutional projects less dependent on discretionary investment cycles.
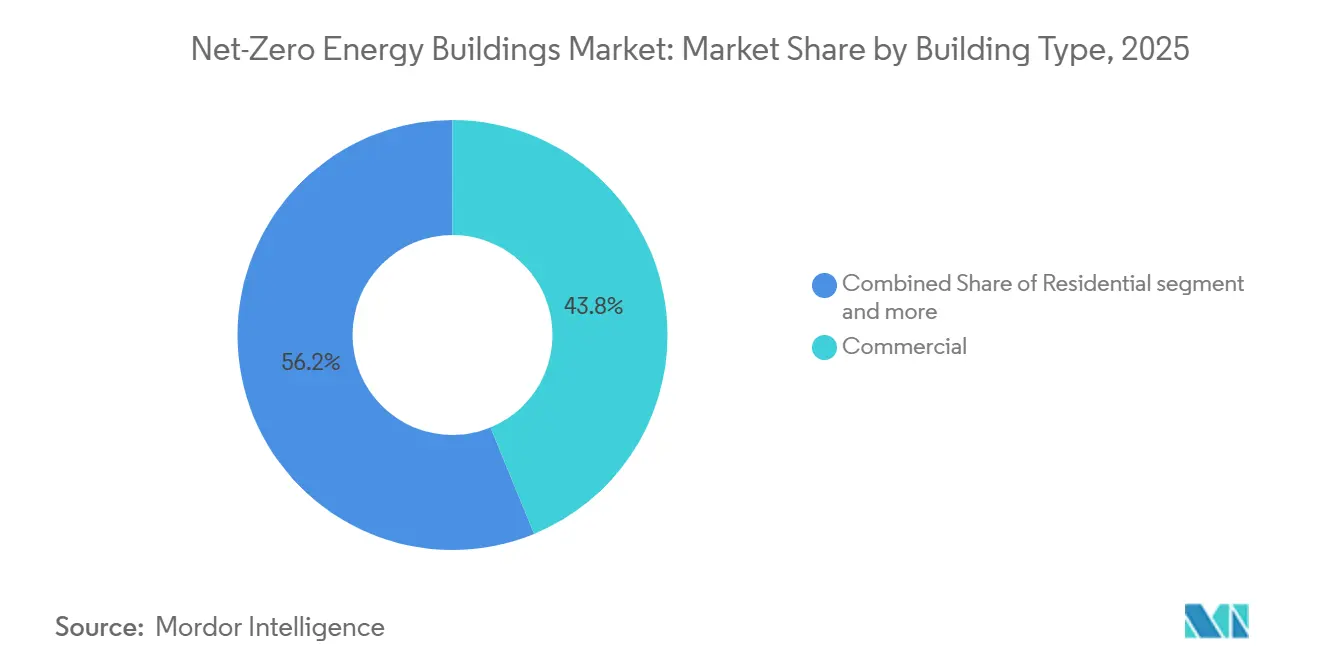
Commercial buildings accounted for 43.8% of the net-zero energy market share in 2025. Corporate reporting requirements, tenant demand for certified space, and measurable energy savings supported this position. Investors can assess operating-cost outcomes more easily in large commercial assets. Residential and industrial projects had smaller shares but were supported by new code requirements and corporate facility-decarbonization programs. The net-zero energy buildings industry, therefore, has demand across several building uses, while commercial assets remain the largest current source of revenue.



By Offerings:
Services Gain Importance as Performance Needs ContinueSolutions accounted for 68.4% of revenue in 2025, making it the largest offering category. This share reflects the high value of development, retrofit delivery, integrated design, and building platforms. Solutions bring together physical systems and the planning work required to meet net-zero specifications. They also include the controls that link equipment performance with operational targets. Their revenue position reflects the capital intensity of project-level activity.
Services are projected to grow at a 15.9% CAGR through 2031, the highest rate in the offerings category. The net-zero energy buildings market size for services is supported by design, construction support, commissioning, certification, and consulting requirements. Energy performance certificates and audit requirements under the EU directive increase the need for ongoing professional support. As the installed base grows, performance verification becomes an operating requirement rather than a one-time task. This supports recurring service demand alongside capital spending on solutions.
By Construction Type:
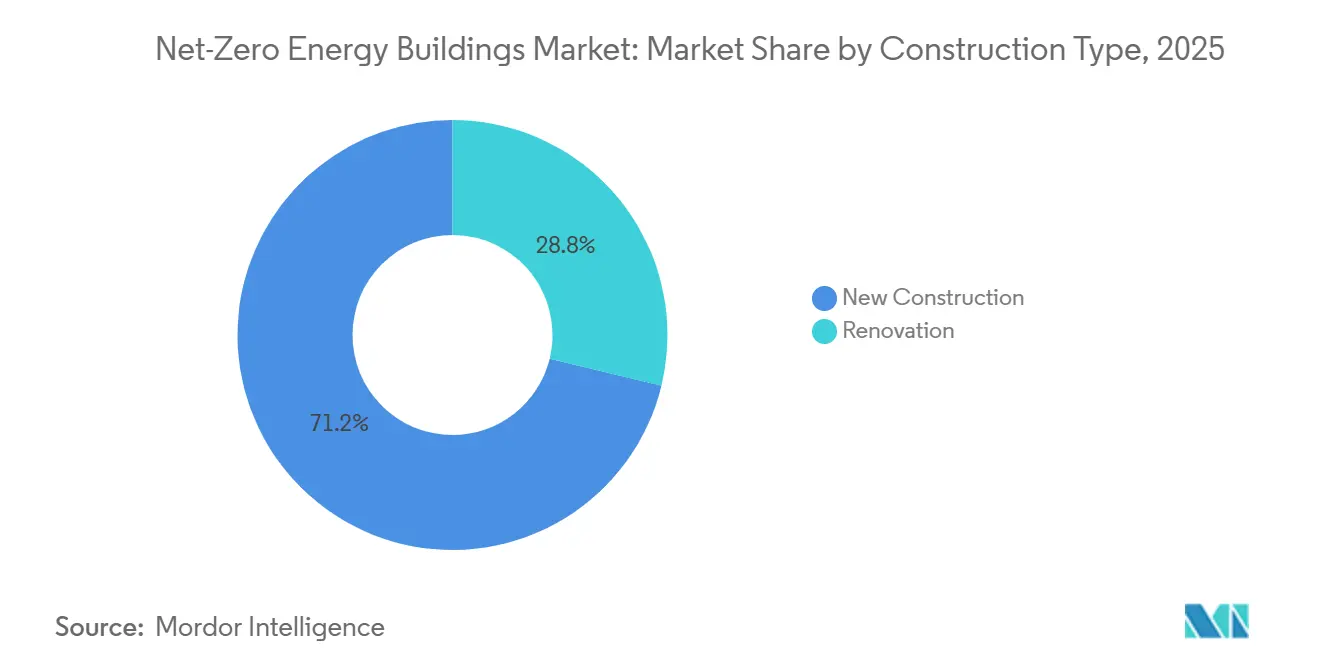
Renovation Expands Faster While New Construction LeadsNew construction accounted for 71.2% of the net-zero energy buildings market size in 2025. Greenfield projects can integrate the envelope, electrified systems, solar generation, and controls at the design stage. This reduces the difficulty of connecting legacy equipment with current code requirements. New projects also allow owners to align specifications with future performance standards from the outset. These factors kept new construction as the leading construction type.
Renovation is forecast to grow at a 16.2% CAGR through 2031, the fastest rate in this category. The IEA reported that 75% of Europe’s existing building stock is energy-inefficient[1]International Energy Agency, “Building, Breakthrough Agenda Report 2025,” International Energy Agency, iea.org.. Minimum Energy Performance Standards under the EU framework support a long-term renovation pipeline. Renovation also responds to the larger stock of existing buildings relative to the annual new-build pipeline. The net-zero energy buildings market has a structural opportunity in upgrades that address energy use, carbon, and building-system performance together.
Geography Analysis
APAC Net-Zero Energy Buildings Market
Asia-Pacific held 37.1% of the net-zero energy buildings market share in 2025 and is projected to grow at a 16.8% CAGR through 2031. China’s manufacturing scale in solar photovoltaics, heat pumps, and insulation supports regional adoption. India’s sustainability frameworks and green-finance measures direct capital toward commercial and institutional assets. Japan continues to tighten energy benchmarks through the Top Runner program. South Korea, Singapore, and Australia are also advancing zero-emission building activity in new construction and public-sector renovation.
North America Net-Zero Energy Buildings Market
North America was the second-largest regional contributor. California’s 2025 Title 24 Part 6 Energy Code took effect on January 1, 2026, and expands photovoltaic and battery-storage requirements for nonresidential and high-rise multifamily buildings. New York’s USD 5.4 billion program for 2026 through 2030 adds a large pool of demand for efficiency and electrification work[2]Northeast Energy Efficiency Partnerships, “Efficiency First and Other Changes to New York’s Efficiency and Electrification Portfolio,” Northeast Energy Efficiency Partnerships, neep.org.. Canada’s Deep Retrofit Accelerator Initiative also supports commercial, institutional, and residential retrofit activity. These policies support both new construction and renovation across the net-zero energy buildings market.
EMEA and South America Net-Zero Energy Buildings Market
Europe has the most developed regulatory architecture among the regions discussed. EU member states reached the May 2026 transposition deadline for the revised Energy Performance of Buildings Directive. The directive aligns compliance timelines for new public and private buildings across the region. South America and the Middle East and Africa remain earlier-stage areas where adoption is concentrated in commercial and sovereign-owned projects. Their pipeline depends on national rating programs and development-finance support.

Competitive Landscape
The net-zero energy buildings market is moderately concentrated in integrated building platforms and fragmented in components and services. Siemens, Schneider Electric, Johnson Controls, Honeywell, and Trane Technologies compete in building-management technology. Kingspan, ROCKWOOL, and Saint-Gobain compete through envelope materials, insulation performance, and embodied-carbon credentials. Large commercial and institutional projects can support integrated platforms because their operating scale justifies more advanced controls. Smaller commercial and residential projects remain more fragmented.
Competitive strategy increasingly emphasizes ongoing building performance rather than isolated equipment sales. Trane Technologies and Amazon expanded the BrainBox AI deployment after the fulfillment-center pilots reported nearly 15% reductions in energy use. Johnson Controls stated in its 2026 sustainability report that its technologies helped customers cut more than USD 9.5 billion in energy costs. It also stated that 77% of its 2025 new-product research and development supported sustainability and climate innovation[3]Johnson Controls, “Johnson Controls’ 2026 Sustainability Report Highlights Energy Efficiency Returns in Mission-Critical Industries,” Johnson Controls, johnsoncontrols.com.. These actions show why the net-zero energy buildings market increasingly includes recurring monitoring, optimization, and service work.
Suppliers are also adding capacity to address renovation demand. ROCKWOOL broke ground on a stone-wool manufacturing facility in Wallula, Washington, in April 2026, and commercial production is expected in 2028. Kingspan completed a 29,000 sq ft retrofit expansion at its DeLand, Florida headquarters in 2026. Kingspan reported a 60% reduction in embodied carbon through structural retention at the project. These examples show competition across materials, retrofit delivery, and building operations.
Net-Zero Energy Buildings Industry Leaders
Siemens AG
Schneider Electric SE
Johnson Controls International plc
Honeywell International Inc.
Daikin Industries, Ltd.
- *Disclaimer: Major Players sorted in no particular order
Net-Zero Energy Buildings Market Companies Covered in this Report
- Siemens AG
- Schneider Electric SE
- Johnson Controls International plc
- Honeywell International Inc.
- Daikin Industries, Ltd.
- Carrier Global Corporation
- Trane Technologies plc
- ABB Ltd.
- Mitsubishi Electric Corporation
- Panasonic Holdings Corporation
- Saint-Gobain S.A.
- Kingspan Group plc
- ROCKWOOL A/S
- Lutron Electronics Co., Inc.
- Legrand SA
- Emerson Electric Co.
- Canadian Solar Inc.
- Sika AG
- SageGlass
- Integrated Environmental Solutions Limited
- Skanska AB
- Lendlease Group
- Velux Group
- Bouygues Construction

Recent Industry Developments in Net-Zero Energy Buildings Market
- April 2026: ROCKWOOL North America commenced construction of a new state-of-the-art stone wool plant in Walla Walla County, expected to begin commercial production in 2028, responding to accelerating North American demand for building insulation driven by tightening energy codes.
- April 2026: Kingspan Insulated Panels North America completed the 29,000 sq ft retrofit expansion of its DeLand facility, reducing embodied carbon by 60% through structural retention, and is targeting both LEED v4 BD+C Gold and ILFI Net Zero Carbon + Energy Certification.
- January 2026: Skanska and Entra committed USD 184 million to the Christian Krohgs gate 2 office development in Oslo, which targeted energy class A, fossil-free construction, and BREEAM-NOR v6.0 Very Good certification.


Global Net-Zero Energy Buildings Market Report Scope
| Residential |
| Commercial |
| Institutional |
| Industrial |
| Solutions (New Net-Zero Energy Building Development, Net-Zero Building Retrofit, Integrated Design & Delivery and Smart Net-Zero Building Solutions) |
| Services (Architectural & Engineering Design, Construction Services, Commissioning & Certification Services and Consulting Services) |
| New Construction |
| Renovation |
| North America | United States |
| Canada | |
| Mexico | |
| Europe | United Kingdom |
| Germany | |
| France | |
| Italy | |
| Spain | |
| Russia | |
| Rest of Europe | |
| Asia-Pacific | China |
| India | |
| Japan | |
| Australia | |
| South Korea | |
| SouthEast Asia (Singapore, Malaysia, Thailand, Indonesia, Vietnam, and Philippines) | |
| Rest of Asia-Pacific | |
| South America | Brazil |
| Argentina | |
| Rest of South America | |
| Middle East and Africa | Saudi Arabia |
| United Arab Emirates | |
| Turkey | |
| South Africa | |
| Nigeria | |
| Rest of Middle East and Africa |
| By Building Type | Residential | |
| Commercial | ||
| Institutional | ||
| Industrial | ||
| By Offerings | Solutions (New Net-Zero Energy Building Development, Net-Zero Building Retrofit, Integrated Design & Delivery and Smart Net-Zero Building Solutions) | |
| Services (Architectural & Engineering Design, Construction Services, Commissioning & Certification Services and Consulting Services) | ||
| By Construction Type | New Construction | |
| Renovation | ||
| By Geography | North America | United States |
| Canada | ||
| Mexico | ||
| Europe | United Kingdom | |
| Germany | ||
| France | ||
| Italy | ||
| Spain | ||
| Russia | ||
| Rest of Europe | ||
| Asia-Pacific | China | |
| India | ||
| Japan | ||
| Australia | ||
| South Korea | ||
| SouthEast Asia (Singapore, Malaysia, Thailand, Indonesia, Vietnam, and Philippines) | ||
| Rest of Asia-Pacific | ||
| South America | Brazil | |
| Argentina | ||
| Rest of South America | ||
| Middle East and Africa | Saudi Arabia | |
| United Arab Emirates | ||
| Turkey | ||
| South Africa | ||
| Nigeria | ||
| Rest of Middle East and Africa | ||


Key Questions Answered in the Report
What is the projected value of net-zero energy buildings by 2031?
The net-zero energy buildings market is projected to reach USD 74.2 billion by 2031, expanding at a 14.7% CAGR from 2026. The forecast reflects demand for higher-performance design, renovation delivery, and operational controls.
Which building type is growing fastest through 2031?
Institutional buildings are forecast to record the highest CAGR at 15.6% through 2031. The net-zero energy buildings market gains support from public emissions commitments covering hospitals, schools, and government facilities.
Which construction type has the strongest projected growth?
Renovation is forecast to grow at a 16.2% CAGR through 2031. The net-zero energy buildings market is supported by the large stock of inefficient buildings and energy-performance requirements.
What is driving demand for net-zero building projects?
Performance rules, retrofit and electrification programs, energy resilience needs, and smart building controls are key factors. These forces shape specifications and operations across the net-zero energy buildings market.
Page last updated on:





