
Market Overview
| Study Period | 2020 - 2031 |
|---|---|
| Market Size (2026) | USD 16.91 Billion |
| Market Size (2031) | USD 21.25 Billion |
| Growth Rate (2026 - 2031) | 4.69 % |
| Fastest Growing Market | Asia Pacific |
| Largest Market | Asia Pacific |
| Market Concentration | Medium |
Major Players *Disclaimer: Major Players sorted in no particular order Image © Mordor Intelligence. Reuse requires attribution under CC BY 4.0. | |
Amines Market Analysis by Mordor Intelligence
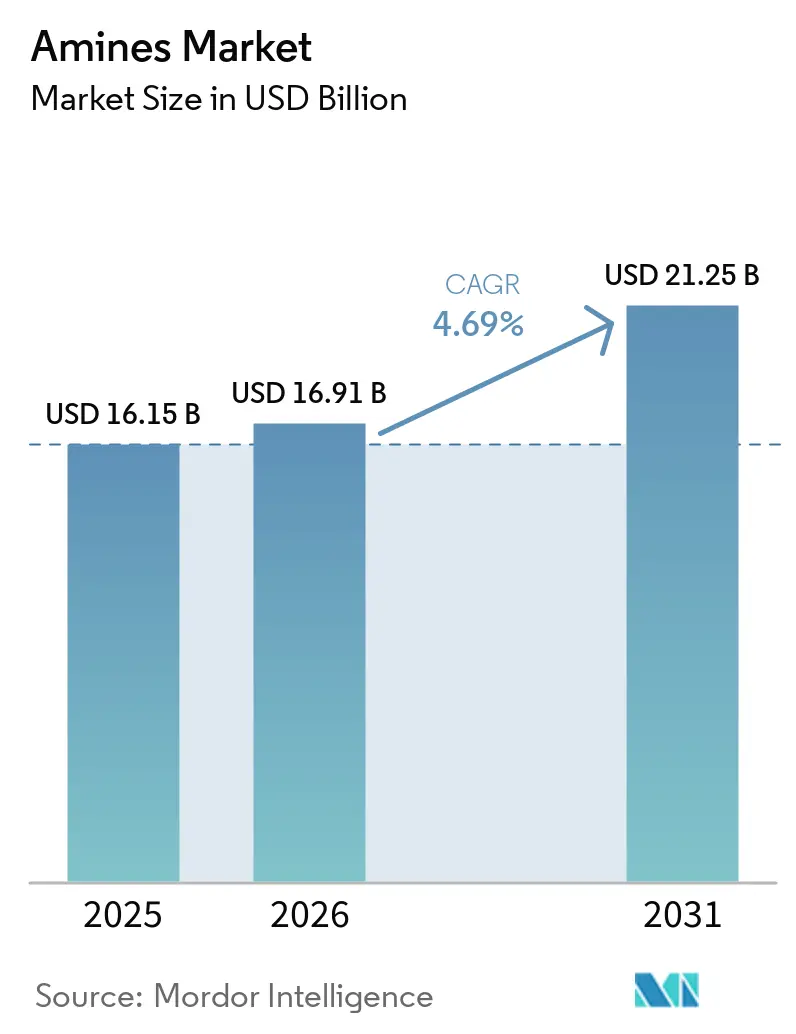
Amines market size in 2026 is estimated at USD 16.91 billion, growing from 2025 value of USD 16.15 billion with 2031 projections showing USD 21.25 billion, growing at 4.69% CAGR over 2026-2031. This sustained expansion is supported by resilient industrial demand, stricter environmental regulations that favor cleaner chemistries and a growing pipeline of high-value applications such as carbon-capture solvents. Rising investments in semiconductor fabrication, large-scale agricultural modernization and widespread adoption of bio-based personal-care surfactants are expanding both volume and value opportunities in the amines market. Producers are improving energy efficiency and integrating renewable feedstocks to manage volatile ammonia and ethylene prices while complying with emerging volatile organic compound limits across major economies. Leading suppliers are also channeling capital toward ultra-pure electronics-grade capacities to meet the stringent metal specifications required by next-generation chips, highlighting a visible shift from commodity production toward specialized solutions that offer superior margin potential.
Key Report Takeaways
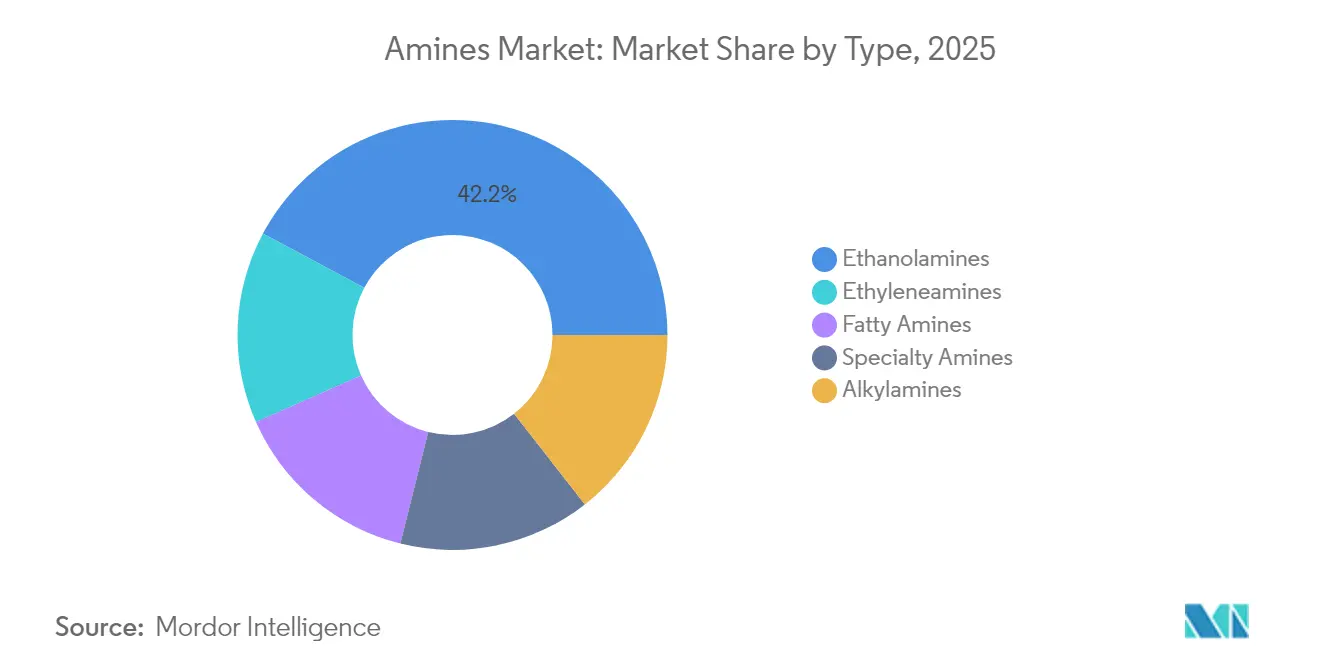
- By type, ethanolamines led with 42.18% amines market share in 2025, whereas specialty amines are projected to post the fastest 4.84% CAGR through 2031.
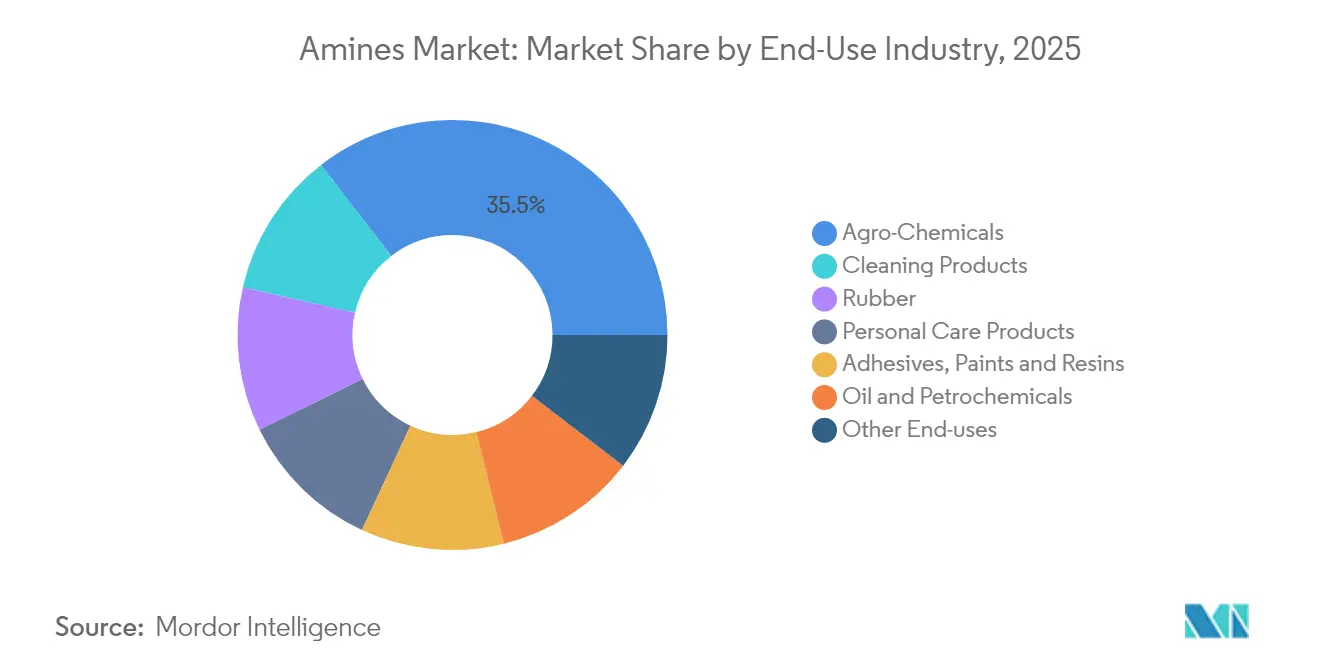
- By end-use industry, agro chemicals commanded 35.12% share of the amines market size in 2025; cleaning products is expected to accelerate at a 5.31% CAGR to 2031.
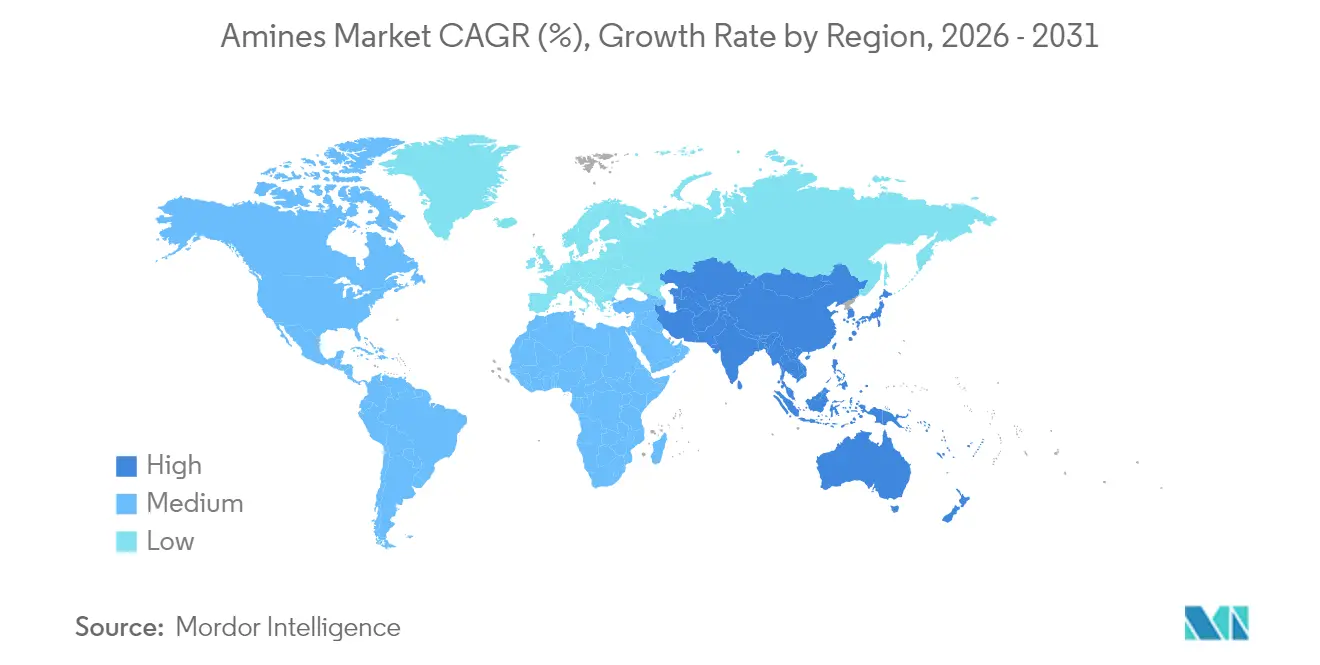
- By geography, Asia Pacific accounted for 38.55% revenue in 2025 in the amines market and is forecast to grow at the highest 5.64% CAGR over the outlook period.
Note: Market size and forecast figures in this report are generated using Mordor Intelligence’s proprietary estimation framework, updated with the latest available data and insights as of 2026.
Market Trends and Insights
Drivers Impact Analysis of Amines Market*
| Driver | (~) % Impact on CAGR Forecast | Geographic Relevance | Impact Timeline |
|---|---|---|---|
| Surging demand from Asian personal-care formulators | +0.80% | Asia Pacific core, spill-over to North America | Medium term (2-4 years) |
| Rapid pesticide adoption in emerging agriculture hubs | +1.20% | Asia Pacific, South America, Middle East and Africa | Long term (≥ 4 years) |
| Infrastructure boom spurring construction chemicals | +0.60% | Global, with concentration in Asia Pacific and Middle East | Medium term (2-4 years) |
| Electronics-grade amines for advanced semiconductor fabs | +0.90% | Asia Pacific, North America | Short term (≤ 2 years) |
| On-site green-hydrogen-derived amines pilots | +0.40% | North America, Europe, with selective Asia Pacific deployment | Long term (≥ 4 years) |
| Source: Mordor Intelligence | |||
Surging Demand from Asian Personal-Care Formulators
Amino acid-based surfactants have outpaced traditional sulfate systems, recording 18% average annual growth since 2010. Asian formulators are mainstreaming glutamate and alaninate derivatives that offer low irritation and high biodegradability, forcing amine suppliers to expand bio-based lines with International Sustainability and Carbon Certification (ISCC-PLUS) credentials. Nouryon’s certified production of green ethylene oxide and ethanolamines illustrates how plant operators are realigning portfolios toward clean-label formulations[1]Nouryon, “ISCC-PLUS certification at Stenungsund site,” nouryon.com . In tandem, multifunctional amine oxides are gaining ground in shampoo, body-wash and household categories as manufacturers pursue high-foaming yet mild profiles. With middle-class consumers gravitating toward products boasting a natural-origin index approaching 100%, the amines market is set to deepen its role as a pivotal enabler of Asia’s fast-growing clean-beauty ecosystem.
Rapid Pesticide Adoption in Emerging Agriculture Hubs
Modern farming practices in Asia Pacific and South America require precision chemical inputs, lifting demand for amine-based pesticide salts and emulsifiers, supporting growth in the amines market. Novel decentralized ammonia plants powered by renewable electricity are lowering logistics costs and improving regional supply security, notably in Brazil and India. CF Industries and POET’s pilot of low-carbon ammonia fertilizer demonstrates the agronomic and sustainability pay-off of integrating green hydrogen pathways. Such developments bolster long-term offtake for ethanolamines, alkylamines, and fatty amines used in herbicides, insecticides, and seed-treatment agents.
Infrastructure Boom Spurring Construction Chemicals
Large-scale urbanization projects across Asia and the Middle East continue to elevate demand for epoxy systems, concrete plasticizers and corrosion inhibitors that rely on polyamines or amidoamines as curing agents. Evonik’s Ancamine series allows structural adhesives to set at 70 °C, enabling faster project cycles. Green-building mandates in China, India and the Gulf Cooperation Council markets are also driving interest in bio-based curing agents derived from vegetable oils, while graphene-enhanced rubber composites formulated with specialty amines deliver superior tensile strength for bridge bearings and rail pads used in extreme climates.
Electronics-Grade Amines for Advanced Semiconductor Fabs
The shift toward 3 nm and below process nodes calls for quaternary amines and amine oxides with parts-per-billion metal impurities. Huntsman has upgraded its Conroe, Texas plant to deliver E-GRADE volumes tailored for lithography cleaning and developer baths. Given that Asia hosts over 70% of global leading-edge capacity additions slated through 2028, local procurement of ultra-pure amines is becoming a supply-chain imperative. Short qualification cycles in chip fabs mean that suppliers capable of consistently meeting sub-ppb thresholds are locking in multi-year contracts, magnifying the growth stimulus for the amines market in the short term.
Restraints Impact Analysis of Amines Market*
| Restraint | (~) % Impact on CAGR Forecast | Geographic Relevance | Impact Timeline |
|---|---|---|---|
| Shift to wood-free paper & digital documentation | -0.30% | Global, with concentration in North America and Europe | Long term (≥ 4 years) |
| Volatile ammonia & ethylene feedstock pricing | -0.70% | Global | Short term (≤ 2 years) |
| Stricter amine VOC/odor regulations | -0.50% | Global, with concentration in North America and Europe | Medium term (2-4 years) |
| Source: Mordor Intelligence | |||
Shift to Wood-Free Paper & Digital Documentation
Declining office-paper consumption in developed economies is dampening demand for amine-based pulp bleaching agents and paper coatings. Companies are reallocating volumes toward faster-growing personal-care and construction segments to cushion the long-term drag. BASF’s decision to reconfigure legacy amine assets toward specialty chemicals highlights the industry’s proactive adjustment to this structural shift.
Volatile Ammonia & Ethylene Feedstock Pricing
Natural-gas price swings translate directly into ammonia and ethylene cost variability, compressing producer margins. Anhydrous ammonia prices have tracked gas markets lower in recent quarters, but geopolitical risks—such as potential Strait of Hormuz disruptions impacting global ammonia trade—keep cost projections uncertain. Suppliers are hedging through forward contracts, portfolio diversification and pilot investments in electrolysis-based green-ammonia routes that promise greater cost stability once scaled.
*Our forecasts treat driver/restraint impacts as directional, not additive. The impact forecasts reflect baseline growth, mix effects, and variable interactions.
Amines Market Segment Analysis
By Type:
Ethanolamines Lead While Specialty Amines AccelerateEthanolamines captured 42.18% of the overall amines market in 2025, owing to their indispensable role in gas sweetening, personal-care surfactants and corrosion inhibitors. Steady demand from natural-gas treatment and triethanolamine-based cement additives underpins a robust baseline, even as newer uses in carbon-capture solvents emerge. The segment’s scale gives leading suppliers cost leverage and operational synergies across derivative chains ranging from ethoxylates to morpholine. In contrast, specialty amines are projected to post the fastest 4.84% CAGR through 2031, propelled by niche applications in electronics, pharmaceuticals and advanced composites.
Producers are installing multipurpose reactors capable of quick changeovers between high-purity morpholines, diamines and chiral amine intermediates. Evonik’s expansion in Nanjing exemplifies this pivot toward higher value-added molecules. Concurrently, academic breakthroughs such as ruthenium/triphos catalysts achieving 90% yields on renewable feedstocks promise to widen the sustainable feedstock pool for specialty grades. The interplay of scale in ethanolamines and growth in specialty amines underpins the balanced long-term trajectory of the amines market.



By End-Use Industry:
Agriculture Dominance Meets Cleaning InnovationAgro chemicals accounted for 35.12% of the amines market size in 2025 as global food-security imperatives spurred large-scale adoption of amine-salt herbicides and emulsifiers. Fertilizer producers utilize monoethanolamine scrubbing to eliminate acid gases, safeguarding synthesis catalysts and improving plant uptime. Downstream, pesticide formulators depend on fatty and alkyl amines to reduce spray drift and enhance leaf cuticle penetration, supporting higher crop yields.
Cleaning products, though smaller in absolute terms, are on track to grow 5.31% annually through 2031, driven by sulfate-free personal-care and plant-based household formulations. Syensqo’s naturally derived surfactant line underscores the appeal of mild, eco-labeled ingredients. Parallel regulatory scrutiny of 6PPD antioxidants in the tire industry has prompted a search for alternative amines that maintain ozone resistance without generating harmful transformation products. These shifts emphasize how evolving health and sustainability standards are reshaping demand patterns within the amines market.
Geography Analysis
APAC Amines Market
Asia Pacific retained its dual leadership position, generating 38.55% of global revenue in 2025 and expanding at a 5.64% CAGR through 2031. China’s 45.52 million t ammonia capacity anchors the region’s raw-material advantage. India’s specialty chemicals champions, including Alkyl Amines and Balaji Amines, operate more than 20 plants and export to over 100 countries, leveraging cost-competitive manufacturing. Semiconductor expansions across Taiwan, South Korea and mainland China are pushing demand for electronics-grade amines, while ASEAN nations add incremental growth through pharmaceuticals, agro chemicals and household products. BASF’s planned USD 10 billion Zhanjiang Verbund project, powered entirely by renewable electricity, illustrates how multinationals intend to capture enduring regional upside.
North America Amines Market
North America represents a mature yet strategically vital cluster, with rising investments in blue ammonia facilities integrated with carbon-capture systems. The United States is expected to quadruple ammonia capacity by 2030. This expansion safeguards domestic fertilizer supply and provides a local feedstock base for ethanolamine and urea derivatives. Meanwhile, Canada’s abundant hydropower positions it as a contender for low-carbon amine production targeting both domestic and export markets.
Europe Amines Market
Europe continues to pursue circular-economy objectives, driving innovations in bio-based intermediates and energy-efficient reactors. Nouryon’s ISCC-PLUS certification for green ethylene oxide supports regional demand for eco-labeled surfactants. The European Commission’s stricter VOC targets are encouraging formulators to substitute conventional volatile amines with higher-flashpoint derivatives that meet performance criteria.
MEA Amines Market
The Middle East and Africa benefit from natural-gas feedstock availability, enabling competitively priced ammonia and downstream amine chains, especially in Saudi Arabia and Oman.
South America Amines Market
South America’s focus on soybean and corn cultivation assures steady consumption of herbicidal amine salts, with Brazil and Argentina leading uptake.

Regulatory Landscape
Amines are managed under broad chemical-control and hazard-communication frameworks that cover registration, new-use notifications, exposure management, and restrictions on substances of concern. In the European Union, REACH requirements administered via ECHA shape market access through registration dossiers and the restrictions process (including Annex XVII), affecting the use and substitution of certain hazardous amine solvents (for example, NMP, CAS 872-50-4) through enforceable use conditions and exposure controls.
In North America, the United States regulates new chemical uses through the EPA under TSCA, including Significant New Use Rules (SNURs). In June 2026, EPA proposed additional SNURs (Batch 26-1) covering certain chemical substances, reinforcing the need for manufacturers and importers to manage compliance ahead of any change in use patterns. Canada manages amine groups under CEPA 1999 through screening assessments and risk-management actions, and ministerial conditions for a surfactant-related quaternary ammonium substance (CAS 691400-36-9) took effect on May 29, 2026, showing how substance-specific conditions can shape commercialization and downstream formulations.
Value Chain Analysis
The amines value chain starts with upstream feedstocks, notably ammonia and petrochemical derivatives such as ethylene/propylene chains, then moves through synthesis routes (amination and alkoxylation-derived intermediates for ethanolamines and specialty amines), followed by purification, blending, packaging, and distribution. Large integrated complexes in Asia and the U.S. Gulf Coast support cost and supply advantages, while electronics and specialty applications add additional purification, quality control, and qualification steps that raise entry barriers and increase the premium on consistent impurity control.
Downstream, amines feed high-volume applications (agro-chemicals, cleaning and personal care, and oil and gas treating) as well as higher-value performance segments such as polyurethane and epoxy additives and electronics-grade chemistries. Capacity and capability upgrades remain a key linkage between producers and end markets: Evonik started operation of its expanded specialty amine production in Nanjing in April 2026 to supply reactive specialty amines used in polyurethane and epoxy applications, while BASF brought onstream a world-scale hexamethylenediamine plant at Chalampé (260,000 metric tons per year, June 2025), reinforcing the role of large-scale assets and regional hubs in balancing global supply.
Competitive Landscape
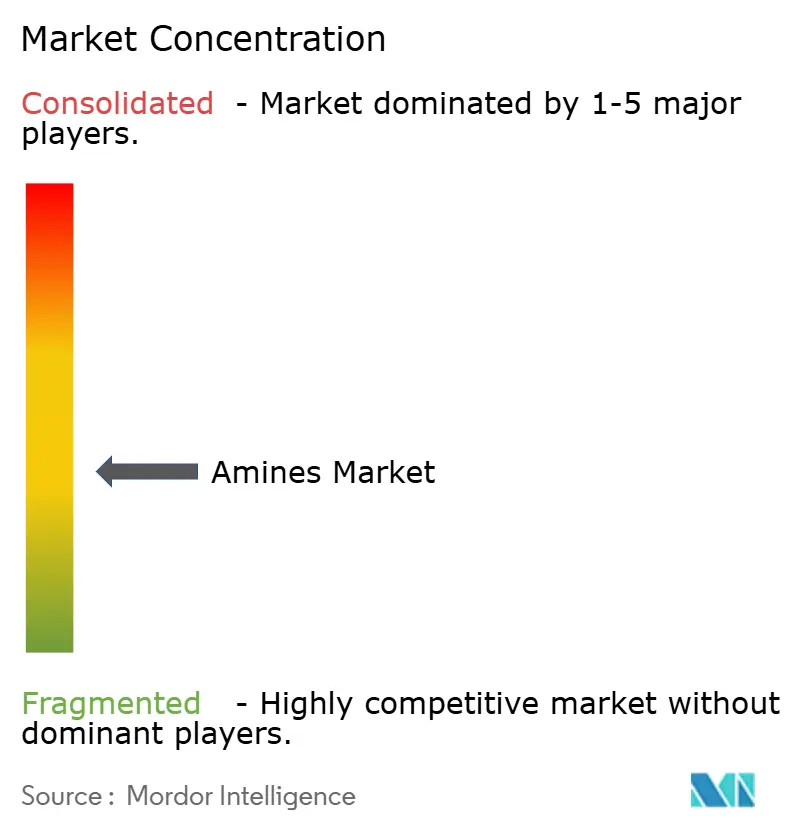
The global amines market is moderately fragmented. BASF, Dow and Huntsman leverage upstream ethylene and ammonia integration to stabilize raw-material costs and guarantee supply continuity. Dow holds the leading position in both ethyleneamines and ethanolamines, underpinned by proprietary Oxirane technology. Huntsman’s E-GRADE platform targets chipmakers that require sub-ppb metal specifications, reinforcing its reputation in high-purity niches. BASF’s 140,000 t/year alkyl ethanolamine plant in Antwerp and the 260,000 t/year hexamethylenediamine unit in Chalampé extend its leadership across intermediates for polyurethanes, nylon 6,6 and specialty surfactants.
Strategic partnerships are central to sustainability progress. Evonik has teamed with BASF to source biomass-balanced ammonia, cutting cradle-to-gate carbon footprints by more than 65%. Similar collaborations are emerging across the value chain, pairing catalytic-process innovators with large-volume operators to accelerate commercialization of low-carbon routes. Niche producers focusing on bespoke amines market opportunities for pharma active ingredients and 3D-printing resins are capturing segments overlooked by commodity incumbents.
Competitive intensity is increasing in emerging applications such as carbon-capture solvents, where traditional monoethanolamine blends are being challenged by proprietary sterically hindered amines that promise lower regeneration energy. ANDRITZ reported 95% CO₂ removal efficiency with liquid amine systems at scale. Suppliers that can combine superior performance with reduced environmental footprint stand to secure early-mover advantage in this rapidly evolving segment of the amines market.
Amines Industry Leaders
Akzo Nobel N.V.
BASF SE
Dow
Huntsman International LLC
LyondellBasell Industries Holdings B.V.
- *Disclaimer: Major Players sorted in no particular order
Amines Market Companies Covered in this Report
- Air Products and Chemicals, Inc.
- Akzo Nobel N.V.
- Alkyl Amines Chemicals Limited
- Arkema
- BASF SE
- Celanese Corporation
- Clariant
- Daicel Corporation
- Dow
- Eastman Chemical Company
- Huntsman International LLC
- INEOS
- Invista
- Kemipex
- LyondellBasell Industries Holdings B.V.
- MITSUBISHI GAS CHEMICAL COMPANY, INC
- NIPPON SHOKUBAI CO., LTD.
- SABIC
- Solvay
- Tosoh Corporation

Market Opportunities and Future Outlook
White-space is most apparent where customers need higher purity, certified sustainability attributes, or localized supply for time-critical qualification cycles. On the supply side, producers are expanding specialty amines and performance additives tied to polyurethane and epoxy systems. Evonik's commissioning of an expanded specialty amine facility in Nanjing in April 2026 supports formulators that need consistent reactive amines for construction, coatings, and composite systems, and it also adds regional supply capacity in Asia Pacific, the largest consumption base in the report.
Another opportunity track is the shift toward certified circular or bio-attributed product offerings and lower-carbon operations, demanded by multinational downstream brands alongside tightening environmental requirements in major economies. BASF has, for instance, expanded DMAPA and PEA capacities at its Nanjing site (announced October 2025) and inaugurated a new alkyl ethanolamines plant at its Antwerp Verbund site (September 2024), which expanded global capacity for key alkyl ethanolamines used in low-VOC formulations and industrial applications. Pricing actions also point to the value of constrained or higher-spec portfolios, including Eastman Chemical Company's amines price increases effective July 15, 2026, alongside further debottlenecking, backward integration, and portfolio upgrades across commodity-to-specialty pathways.
Recent Industry Developments in Amines Market
- June 2026: Huntsman Corporation and Olin Corporation announced a definitive agreement for an all-stock merger of equals to create OlinHuntsman Corporation. The combination links Huntsmans differentiated amines and downstream formulations exposure with Olins large chlor-alkali and vinyls platform, strengthening integration options and scale in key chemical chains. The deal also reshapes competitive dynamics for global buyers that source multiple intermediates from large, integrated suppliers.
- July 2025: BASF started up expanded production plants for 3-(dimethylamino)propylamine (DMAPA) and polyetheramine (PEA) at its Nanjing, China site, with DMAPA capacity nearly doubling. The expansion increases regional availability of intermediates used across cleaning, coatings, and specialty applications, supporting faster supply response in Asia Pacific. It also reinforces the role of China-based integrated sites in supplying higher-value amine derivatives alongside commodity volumes.
- September 2024: BASF inaugurated a new world-scale alkyl ethanolamines production plant at its Antwerp Verbund site, lifting global annual capacity for DMEOA and MDEOA to over 140,000 metric tons. The added capacity supports demand for alkyl ethanolamines used in gas treatment, construction chemicals, and other industrial formulations. Antwerp strengthens BASFs ability to serve European customers from a large integrated hub while improving supply flexibility across regions.


Amines Market Report Scope and Research Methodology
Market Definition and Coverage
For this study, the amines market includes the sales value of amine chemicals used as intermediates or functional ingredients across industrial and consumer end uses, counted at the point where they are sold into the market and recorded in USD.
Scope exclusions: We exclude downstream finished products that only contain amines (for example, formulated detergents, crop protection products, or paints) to avoid double counting.
Segments Covered in This Report
- By Type
- Ethyleneamines
- Alkylamines
- Fatty Amines
- Specialty Amines
- Ethanolamines
- By End-use Industry
- Rubber
- Personal Care Products
- Cleaning Products
- Adhesives, Paints and Resins
- Agro-Chemicals
- Oil and Petrochemicals
- Other End-uses
- By Geography
- Asia-Pacific
- China
- India
- Japan
- South Korea
- Rest of Asia-Pacific
- North America
- United States
- Canada
- Mexico
- Europe
- Germany
- United Kingdom
- France
- Italy
- Rest of Europe
- South America
- Brazil
- Argentina
- Rest of South America
- Middle East and Africa
- Saudi Arabia
- South Africa
- Rest of Middle East and Africa
- Asia-Pacific
Data Sources, Market Sizing, and Validation
Desk Research
Desk research was used to set the demand and supply context for amines and to build clean assumptions on where volumes typically flow by geography and end use. We relied on public, non-paywalled sources such as the USGS for chemicals context, UN Comtrade for trade patterns, the World Bank and IMF for macro indicators, and agencies such as the US EPA and ECHA for regulatory signals that can shift usage or costs.
Along with these, we reviewed company annual reports, investor presentations, product brochures, and trade press to understand capacity moves, product mix language, and typical pricing commentary. Where needed, we also referenced paid subscriptions that support company financials and intelligence, news and financials, patents, and shipment-level trade checks to tighten inputs. These desk sources are illustrative only, and additional public and proprietary references were used for data collection, validation, and clarification.
Primary Interviews and Surveys
Primary work focused on validating how demand is being created and how pricing is structured across major producing and consuming regions, and where the model needed reality checks. We spoke with manufacturers, distributors, end-user procurement and plant teams, and industry experts so assumptions on product mix, typical contract timing, and regional pricing spreads could be adjusted before finalizing totals.
Distribution of primary research fieldwork respondents
| Company type | Respondent position | Region |
|---|---|---|
| Top tier: 32% | CXOs: 19% | APAC: 45% |
| Mid tier: 48% | Functional/Unit leaders: 30% | EMEA: 30% |
| Smaller Players: 20% | Managers: 51% | Americas: 25% |
Market-Sizing & Forecasting
Sizing started with a top-down build where production and trade signals, end-use activity, and typical penetration rates were used to reconstruct the addressable amines demand pool by region and major application buckets. Once the first totals were formed, we corroborated them with selective bottom-up approximations, such as rolling up a sampled set of supplier revenues, checking channel markups, and stress-testing implied average selling prices (ASPs) against observed feedstock and contract commentary.
The market model used a small set of repeatable inputs that can be refreshed each cycle, including chemical output indices, agriculture and personal care activity signals, gas treatment and refining run-rate indicators, import-export balance by region, and expected ASP movement based on feedstock cost direction and product mix shifts. When data gaps appeared for smaller countries or thinner applications, we used proxy indicators (like trade intensity and industrial output) and then constrained results to realistic per-capita and per-industry consumption ranges discussed in interviews.
For forecasting, scenario analysis was applied with base, higher-demand, and lower-demand paths, and the variable outlooks were anchored to expert expectations on capacity additions, substitution risk, and regional demand momentum. Outputs were then rechecked so growth rates, pricing, and mix do not drift away from what participants describe in contracting behavior and plant utilization.
Data Validation & Update Cycle
Validation is done through several checks, starting with ensuring regional totals reconcile with independent signals such as trade flows, capacity announcements, and macro demand indicators. Any large variance triggers a second-pass review where assumptions on mix, pricing windows, and conversion factors are revisited, followed by targeted follow-ups to close the gap.
Before sign-off, another analyst reviews the key inputs and sensitivities so outliers are questioned and corrected, and the logic can be repeated by a different team member. Reports are refreshed annually, and interim updates are made when material events occur, such as large capacity starts, regulatory shifts, or sharp feedstock moves. Right before delivery, a fresh scan is performed so clients receive the most current view available.
Mordor Intelligence's Amines Market Size Compared With Other Published Estimates
Published market sizes for amines often do not match because the year used as the base, the currency conversion timing, and the way pricing is averaged across contract cycles can be handled differently. Differences also show up when some studies mix finished formulations into the chemical total, which can inflate the stated value.
In our refresh-led checks, pricing inputs are revalidated with the latest quarter-level signals (and not just a single annual average), and then currency timing is kept consistent with the period being sized before the final number is locked. This is one reason the 2026 figure from Mordor Intelligence can sit below estimates that assume faster ASP expansion or broader downstream inclusion.
Benchmark comparison
| Source | Market Size | Gaps in Research Methodology |
|---|---|---|
| Mordor Intelligence | USD 16.91 B (2026) | |
| Global Consultancy A | USD 23.90 B (2025) | Uses a different base year and may apply a higher blended ASP across product groups, which can lift the value when price cycles are strong. |
| Industry Publisher B | USD 21.50 B (2024) | Broader scope callouts across functions and applications can pull in adjacent downstream value, and the conversion year for currency can shift totals when regional pricing diverges. |
The spread across sources is largely explained by timing and boundary choices, followed by how ASPs are blended across contract types and regions. By keeping the price window, currency timing, and scope rules consistent, and then rechecking them through interviews and external signals, the final market value stays traceable to practical inputs that can be refreshed and repeated.


Key Questions Answered in the Report
What is the current size of the amines market?
The amines market size reached USD 16.91 billion in 2026 and is projected to grow to USD 21.25 billion by 2031.
Which amine type holds the largest share?
Ethanolamines led with 42.18% share of global demand in 2025 due to widespread use in gas sweetening, personal-care and cement additives.
Which region is expanding the fastest in amines market?
Asia Pacific combines the largest consumption base with the highest 5.64% CAGR forecast through 2031, driven by manufacturing scale in China, India and Southeast Asia.
What is the biggest end-use for amines today?
Agro chemicals dominate, accounting for 35.12% of global volume in 2025 as modern farming requires amine-based herbicides, fertilizers and adjuvants.
How are feedstock price swings affecting producers?
Volatile natural-gas and ethylene costs compress margins; leading suppliers are pursuing green hydrogen routes and long-term supply agreements to stabilize input pricing.
Why are electronics-grade amines gaining attention?
Advanced semiconductor fabs need ultra-pure amines with ppb-level metal impurities, prompting investments in specialized purification facilities that command premium pricing.
Page last updated on:


 Your data is secure and never sold or shared.


