
Natural Gas Market Size and Share
Market Overview
| Study Period | 2021 - 2031 |
|---|---|
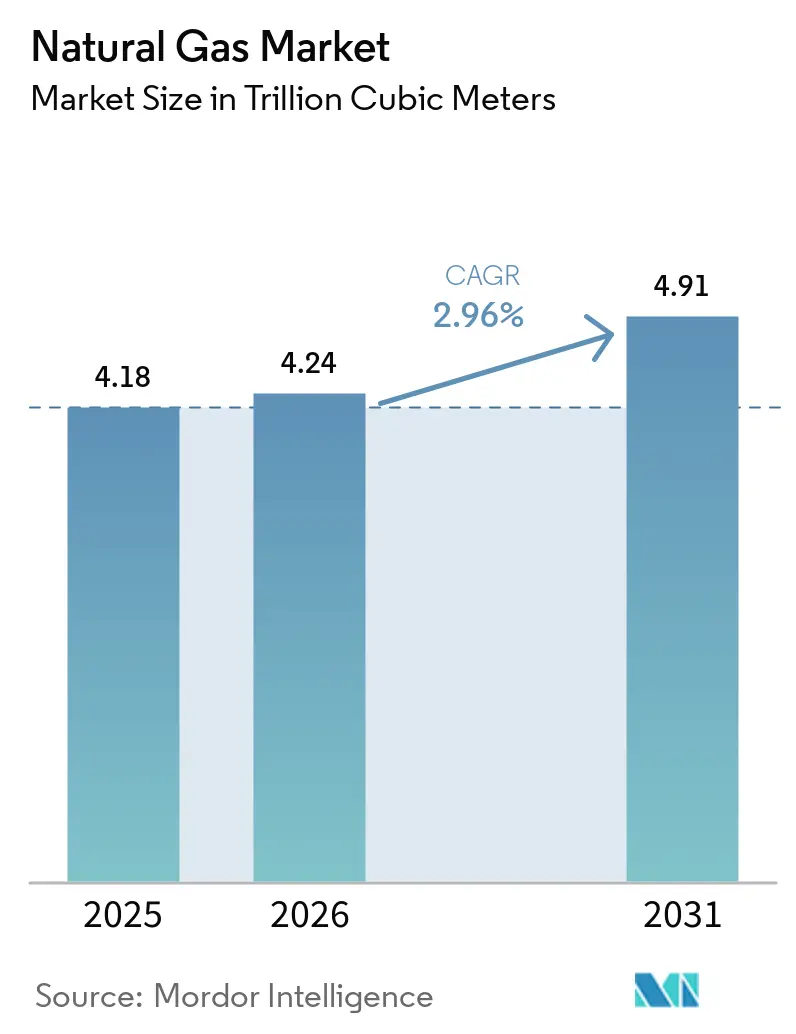
| Market Volume (2026) | 4.24 Trillion cubic meters |
| Market Volume (2031) | 4.91 Trillion cubic meters |
| Growth Rate (2026 - 2031) | 2.96 % |
| Fastest Growing Market | Asia-Pacific |
| Largest Market | North America |
| Market Concentration | Medium |
Major Players *Disclaimer: Major Players sorted in no particular order Image © Mordor Intelligence. Reuse requires attribution under CC BY 4.0. | |
Natural Gas Market Analysis by Mordor Intelligence
The natural gas market size is projected to expand from 4.18 trillion cubic meters in 2025 and 4.24 trillion cubic meters in 2026 to 4.91 trillion cubic meters by 2031, at a CAGR of 2.96% between 2026 to 2031. Gas-fired capacity additions are supporting grids with greater renewable generation, while LNG trade is growing as buyers diversify supply after supply disruptions. Industrialization in South and Southeast Asia is also increasing the use of gas in manufacturing and power systems. Renewable deployment and storage are creating stronger substitution pressure in Europe and North America, which separates demand patterns in mature economies from those in emerging economies. The natural gas market is therefore supported by industrial demand, LNG infrastructure, and grid balancing needs, although its growth rate is moderated by electrification and storage investment. Competition is increasingly based on LNG contracting terms, supply reliability, methane performance, and the ability to deliver capacity quickly.
Key Report Takeaways
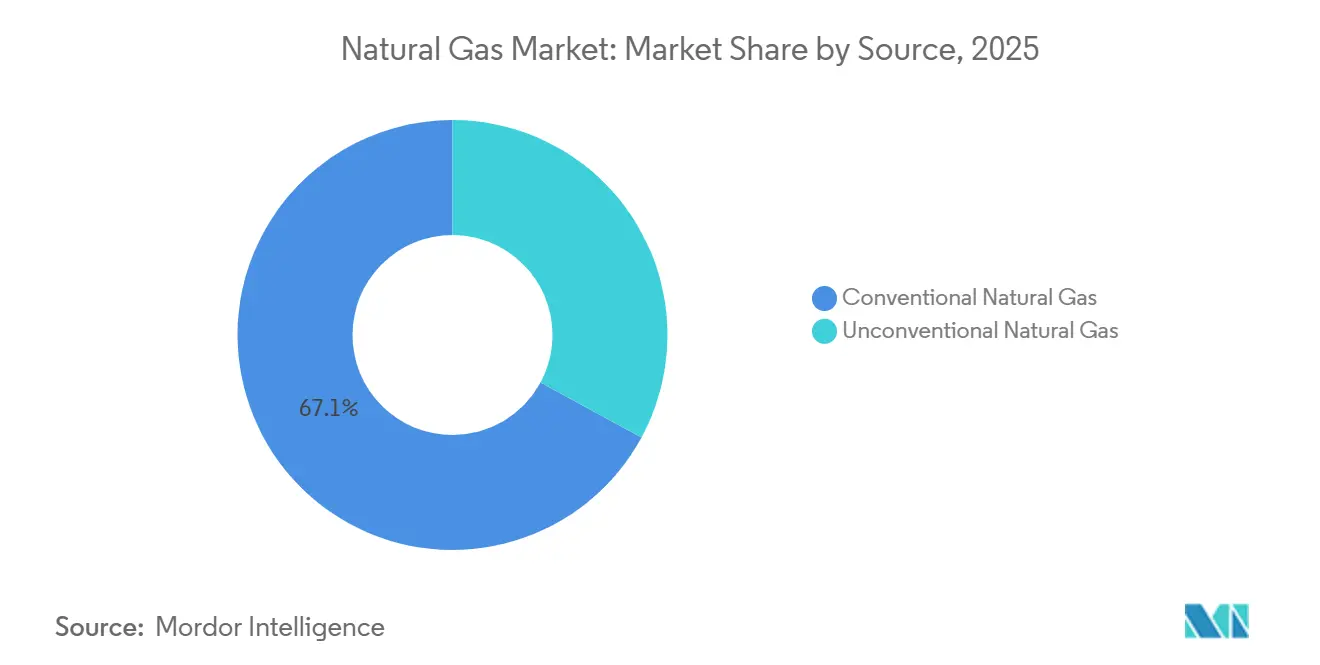
- By source, conventional gas held 67.1% of the natural gas market share in 2025, while unconventional gas is forecast to grow at a 3.2% CAGR through 2031.
- By end-user, power generation held 37.3% of the natural gas market share in 2025, while transportation is forecast to expand at a 5.3% CAGR through 2031.
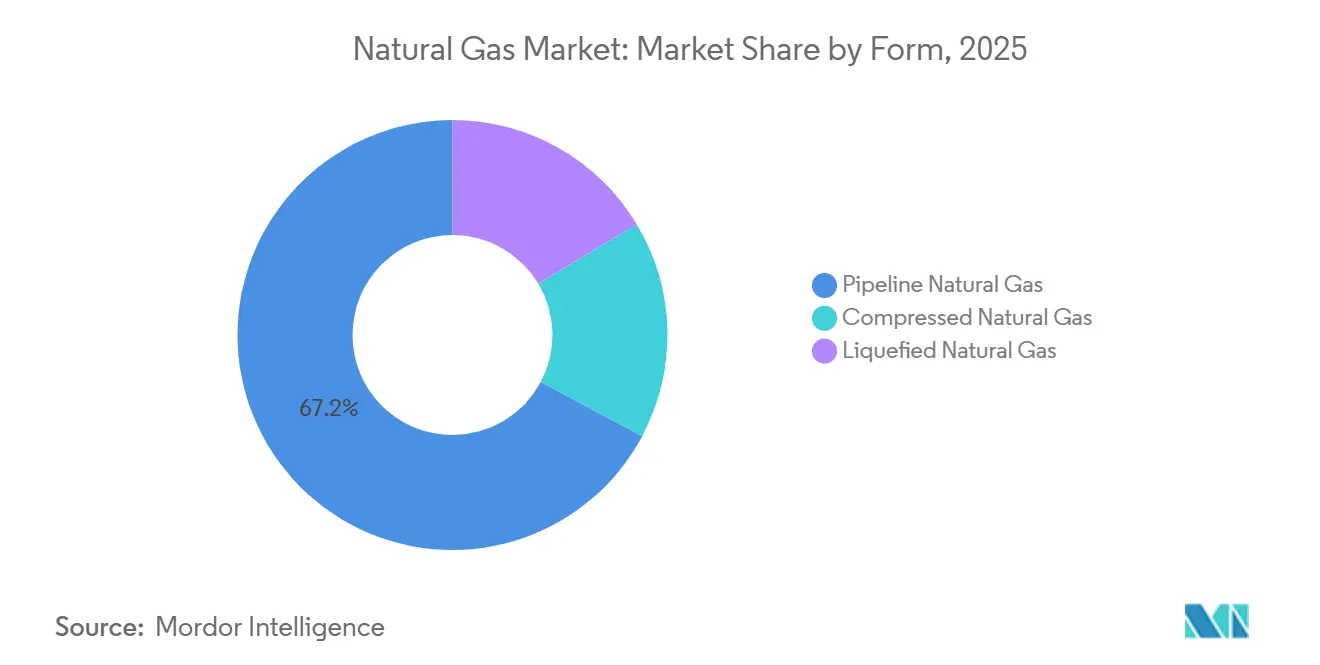
- By form, pipeline gas held 67.2% of the natural gas market share in 2025, while LNG is forecast to advance at a 3.3% CAGR through 2031.
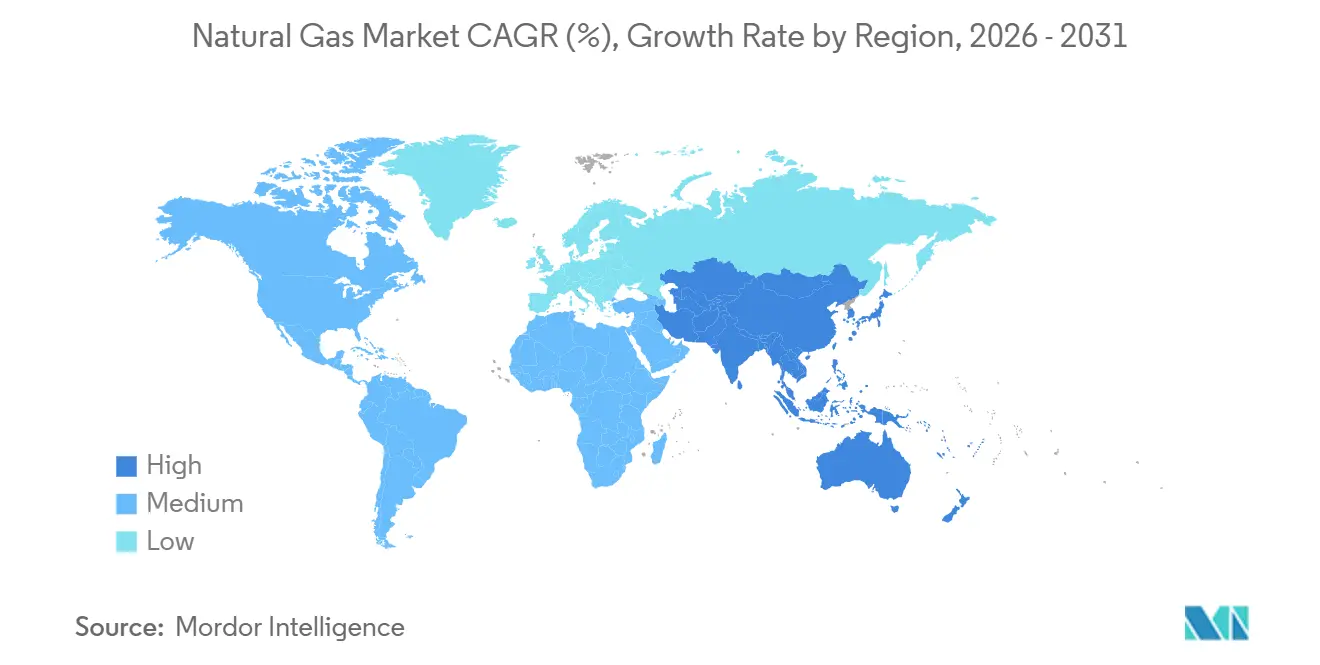
- By geography, North America held 27.4% of the natural gas market share in 2025, while Asia-Pacific is forecast to advance at a 4.9% CAGR through 2031.
Note: Market size and forecast figures in this report are generated using Mordor Intelligence’s proprietary estimation framework, updated with the latest available data and insights as of January 2026.
Global Natural Gas Market Trends and Insights
Drivers Impact Analysis*
| Driver | (~) % Impact on CAGR Forecast | Geographic Relevance | Impact Timeline |
|---|---|---|---|
| Asia-Pacific LNG Import Infrastructure Expansion | +0.50% | APAC core (China, India, Vietnam, Thailand, Malaysia, Singapore) | Short term (≤ 2 years) |
| Gas-Fired Flexibility for Renewable-Heavy Grids | +0.40% | Global, with highest intensity in North America and EU | Medium term (2–4 years) |
| Data-Center and AI Power Demand | +0.40% | North America primary, spill-over to APAC and MEA | Medium term (2–4 years) |
| Destination-Flexible LNG Contracting | +0.20% | Global LNG trade lanes; Atlantic-to-Pacific rerouting | Short term (≤ 2 years) |
| Middle Eastern Oil-to-Gas Switching | +0.20% | Middle East and Africa; national, with intensity in Saudi Arabia, UAE | Long term (≥ 4 years) |
| Methane-Performance Differentiation in Gas Procurement | +0.10% | EU importers, North American exporters; secondary impact in APAC | Long term (≥ 4 years) |
| Source: Mordor Intelligence | |||
Asia-Pacific LNG Import Infrastructure Expansion: Capacity Race Shapes Regional Demand
Asia-Pacific LNG import infrastructure is expanding the base for regional gas consumption. In 2025, 20 LNG import projects entered service in 13 markets, and Asia accounted for 22.2 million tonnes per annum of new regasification capacity[1]International Gas Union, “World LNG Report 2026,” International Gas Union, igu.org.. China added 15.1 mtpa of capacity, while India reached 52.5 mtpa and became the fourth-largest LNG regasification market. Gas Malaysia, Tokyo Gas, and VTTI signed a June 2026 development agreement for a 6 mtpa floating storage and regasification unit in Kedah, Malaysia[2]Gas Malaysia Berhad, “Gas Malaysia Advances Strategic LNG Infrastructure in Northern Peninsular with Tokyo Gas and VTTI,” Gas Malaysia Berhad, gasmalaysia.com.. These terminals encourage minimum throughput because regasification assets carry fixed costs and require long-term supply arrangements. The natural gas market gains a more durable LNG demand base when utilities add import capacity and negotiate certified supply for long-term use.
Gas-Fired Flexibility for Renewable-Heavy Grids: From Baseload to Grid Anchor
Gas-fired generation is increasingly used for grid support rather than only baseload supply. U.S. gas-fired capacity under development or planned more than tripled in 2025 to 252 GW as power systems prepared for coal retirements and rising renewable output. GE Vernova has demonstrated a gas-turbine synchronous condenser configuration that provides grid stability without producing electricity[3]GE Vernova, “Synchronicity: In Sunbelt States, Gas Turbines and Solar Power Are Being Used Together in an Entirely Original Way,” GE Vernova News, gevernova.com.. Tornion Voima's gas-engine plant began commercial operation in Finland in April 2026 as fast-response balancing capacity for a renewable-heavy grid. Siemens Energy committed USD 1 billion in 2026 to expand U.S. gas-turbine manufacturing capacity, showing continued demand for flexible generating equipment. This role supports the natural gas market, where renewables require resources that can respond quickly to changing load and generation conditions.
Data Center and AI Power Demand: Behind-the-Meter Gas Creates a New Demand Class
Data center growth is creating a new source of gas demand for on-site power. More than one-third of U.S. gas-fired power development growth in 2025 was linked to data center power supply. Cleanview identified behind-the-meter projects representing 50 GW, and 90% of those projects were announced in 2025. Berkeley Lab expects data center electricity demand to increase by 74 GW to 132 GW by 2029, reaching as much as 12% of U.S. consumption. Long utility interconnection queues are encouraging operators to pursue direct generation rather than wait for new grid connections. The natural gas market could face tighter feedgas demand in U.S. producing regions if long-lived data center facilities depend on gas-fired generation.
Destination-Flexible LNG Contracting: Spot Trading Rewires Price Formation
Destination-flexible LNG contracts are changing how buyers respond to supply disruptions. Destination-free contracts account for nearly half of contracted LNG volumes, supported by U.S. Henry Hub-linked agreements. During the early 2026 Hormuz disruption, 40% of global LNG volumes moved on a spot basis to limit the immediate price effect. U.S. LNG exports reached 32.15 million tonnes in the first half of 2026, up 28% from the prior year. Flexible portfolios can combine short-term purchases with long-term agreements and redirect cargoes where they are needed. The natural gas market is becoming more responsive to disruptions, although buyers remain exposed to higher spot prices when supply is concentrated.
Restraints Impact Analysis*
| Restraint | (~) % Impact on CAGR Forecast | Geographic Relevance | Impact Timeline |
|---|---|---|---|
| Renewable Power, Storage and Hydropower Substitution | -0.40% | Europe primary, North America secondary, APAC emerging | Medium term (2–4 years) |
| LNG Price Volatility and Affordability Constraints | -0.30% | Global LNG importers; peak exposure in South and Southeast Asia | Short term (≤ 2 years) |
| Pipeline, Storage and Regasification Bottlenecks | -0.20% | North America (Permian, Northeast), spill-over to global LNG delivery | Medium term (2–4 years) |
| Feedgas Competition Between LNG Exports and Domestic Power Load | -0.10% | US Gulf Coast, Qatar, Australia | Long term (≥ 4 years) |
| Source: Mordor Intelligence | |||
Renewable Power, Storage and Hydropower Substitution: Competing for the Baseload Stack
Renewables, storage, and hydropower are reducing gas demand most clearly in mature power systems. U.S. renewable installed capacity is projected to exceed natural gas-fired capacity by April 2027, while utility-scale solar grew 23.9% year over year in the first quarter of 2026[4]International Energy Agency, “Gas Market Report, Q1-2026,” International Energy Agency, iea.org.. Global long-duration energy storage capacity increased 49% in 2025, increasing competition for peaking and balancing demand. The IEA expects European gas demand to decline 2% in 2026 as renewable additions and efficiency measures continue. Battery systems compete with gas plants because both serve flexibility and peak-load roles. This restraint limits the natural gas market in OECD power sectors even as demand continues to grow in emerging economies.
LNG Price Volatility and Affordability Constraints: Spot Market Shocks Displace Price-Sensitive Demand
LNG price volatility can limit gas use among price-sensitive buyers. The JKM spot price reached USD 18/MMBtu in April 2026 after a supply disruption in the Middle East. China reduced LNG imports 10.6% in 2025 while domestic gas production increased by 15 billion cubic meters, and pipeline imports expanded. Higher LNG prices can encourage coal and oil substitution in South and Southeast Asia and postpone planned coal-to-gas switching. Pipeline, storage, and regasification constraints can compound this effect by limiting delivery even when supply is available. The natural gas market remains exposed when importers cannot absorb high spot prices or secure an alternative supply quickly.
*Our forecasts treat driver/restraint impacts as directional, not additive. The impact forecasts reflect baseline growth, mix effects, and variable interactions.
Segment Analysis
By Source: Unconventional Growth Rewires the Supply Map
Conventional gas held 67.1% of production volumes in 2025, maintaining the largest natural gas market share through established fields in the Persian Gulf, North Sea, and Siberia. Unconventional gas is forecast to grow at a 3.2% CAGR from 2026 to 2031, above the overall rate. U.S.-marketed gas production is projected to reach 122.5 billion cubic feet per day in 2026, exceeding the 118.5 Bcfd record in 2025. The Permian Basin and Haynesville Shale are expected to provide most incremental U.S. output. Haynesville production rose 7% year over year in the first half of 2026, supported by access to Gulf Coast LNG terminals. LNG liquefaction additions create demand signals that can encourage drilling even when domestic prices are weak.
China added 15 billion cubic meters of unconventional production in 2025, reducing import dependence at the margin. Saudi Arabia's Jafurah development is intended to displace up to 350,000 barrels per day of crude use in domestic power generation by 2030. The EU Methane Emissions Regulation is raising the importance of methane performance in supply procurement. MiQ certification covered more than 5% of global supply and over 20% of U.S. production in 2026, which supports differentiated procurement terms. Lower-methane supply can receive stronger consideration from buyers subject to import standards. These conditions place unconventional production at the center of supply growth and environmental performance requirements in the natural gas industry.



By End-User: Geographies Define Which End-Users Lead
Power generation accounted for 37.3% of natural gas end use in 2025, giving it the largest share of the natural gas market size by end-user. Transportation is the fastest-growing end-user segment, with a forecast CAGR of 5.3% through 2031. CNG vehicles accounted for 71% of global natural gas vehicle sales in 2026, while LNG is gaining use in long-haul trucking, where fuel density matters. Government-backed city gas distribution is supporting vehicle adoption in India. LNG corridors in Europe and China are also supporting heavy-duty transport applications. These patterns make transport a smaller but faster-growing source of gas demand.
Industrial use is the second-largest end-user category and is closely tied to gas-intensive production in the Middle East and Asia. Industrial and fertilizer activity represented 20% to 25% of Egypt's national gas use, and the country sought 15 to 18 LNG cargoes per month through multi-year supply arrangements. Residential and commercial demand remains significant in Europe and North America because heating systems are already installed. Efficiency rules and heat-pump policies are increasingly reducing demand in these mature markets. The IEA expects Middle East and Africa gas demand to rise 3.5% in 2026, driven by power generation and industrial use. Demand growth is therefore shifting toward industrializing regions while mature building demand faces substitution pressure.
By Form: Pipeline Gas Holds the Base, LNG Trades the Margin
Pipeline gas held 67.2% of volumes in 2025, giving it the dominant share of the natural gas market size by form. LNG is projected to grow at a 3.3% CAGR through 2031 as import capacity expands in Asia and international trade increases. The IEA expects global LNG production to rise by more than 40 billion cubic meters in 2026, with North America providing more than 85% of the incremental supply. Europe has redirected supply requirements toward LNG as Russian pipeline flows remain constrained. This change supports a structural base for global LNG trade. Pipeline systems remain essential where fixed-route infrastructure connects producing and consuming regions.
CNG demand is concentrated in transport and city gas distribution networks, especially in Asia. LNG serves long-haul trucking and marine bunkering because it offers greater energy density. Behind-the-meter data center generation is also creating new demand for piped or compressed gas at industrial sites. U.S. interconnection standards and European gas-market reforms will influence supply routes and investment decisions. Regasification capacity provides flexibility for importing countries, while pipelines provide lower-cost fixed-route delivery. These forms serve different applications, so the natural gas market depends on both permanent infrastructure and flexible LNG trade.
Geography Analysis
North America held 27.4% of global consumption in 2025, representing the largest regional natural gas market share. The United States exported 32.15 million tonnes of LNG in the first half of 2026, 28% more than in the same period of 2025. U.S. marketed production is forecast to average 122.5 Bcfd in 2026. Cheniere, Venture Global, and Woodside are progressing capacity additions that increase feedgas requirements along the Gulf Coast. The INGAA Foundation estimates that U.S. and Canadian gas systems will require more than USD 1 trillion in midstream investment through 2052, including at least 37,000 miles of transmission pipelines. Renewable growth offsets part of export and data center demand, leaving regional consumption broadly stable in 2026.
Europe is more dependent on LNG imports following the reduction in Russian pipeline supply. EU LNG imports rose 30%, or 32 billion cubic meters, in 2025 to a record 140 billion cubic meters. The IEA expects European gas demand to decline 2% in 2026 as renewables and efficiency measures expand. Germany's floating regasification capacity was not fully used in late 2025, showing that infrastructure expansion can exceed demand at prevailing prices. Equinor and its partners committed more than NOK 4 billion to a Troll field development that could begin production in 2028. The EU Gas Package and the Fit for 55 framework limit the long-term case for fixed fossil gas assets.
Asia-Pacific is the fastest-growing regional natural gas market, with a 4.9% CAGR through 2031. The IEA expects regional gas demand to rise 4% in 2026 and account for nearly half of global demand growth. China increased domestic production by 15 billion cubic meters in 2025 and raised Power of Siberia imports 10.1%, while LNG imports fell 10.6%. CNOOC signed a 5-year LNG agreement with ADNOC beginning in 2026, adding supply diversification. IndianOil received clearance to expand the Ennore LNG terminal to 10 mtpa, demonstrating continued investment in import capacity. Industrial expansion, power demand, and regasification investment support the region's role as the central source of incremental demand.

Competitive Landscape
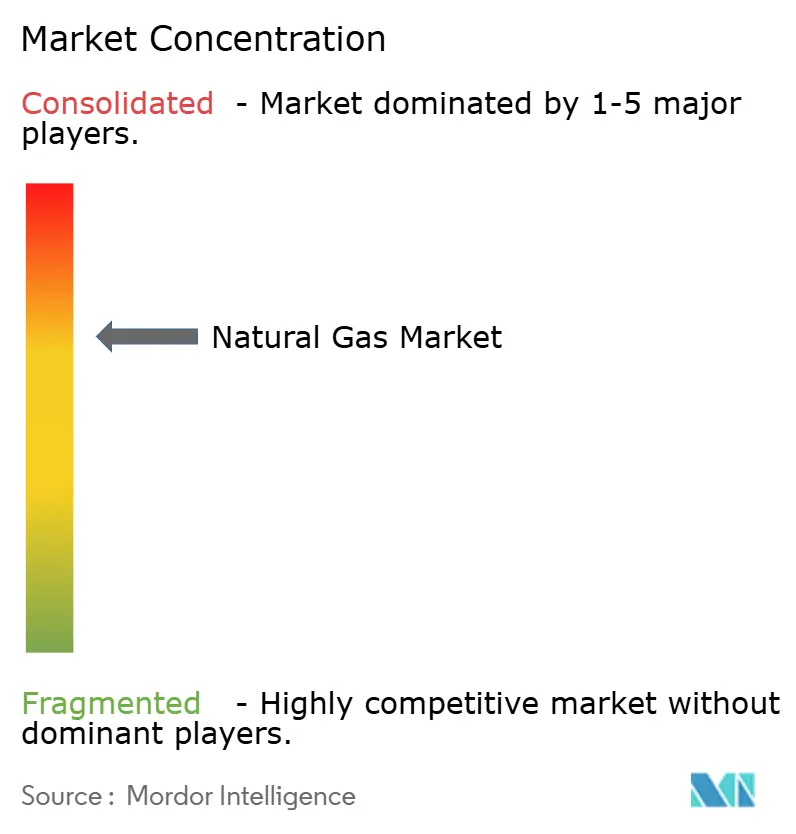
The natural gas market has concentrated ownership of major reserves and a more diverse group of LNG traders, portfolio suppliers, and national utilities. QatarEnergy's North Field expansion targets 142 mtpa of LNG capacity when North Field West is complete. Qatar, Russia, Iran, and the United States control substantial exportable volumes, while companies compete more actively through contracts and logistics. Venture Global, Cheniere, Woodside, and ADNOC Gas are advancing LNG capacity additions through 2030. Venture Global took a USD 8.6 billion final investment decision on CP2 Phase 2 in March 2026. Cheniere began early engineering work for Train 7 at Sabine Pass, with Phase 1 FID expected by early 2027.
Methane performance, contract flexibility, and delivery speed are important points of competitive differentiation. EU methane import requirements favor supply with credible emissions performance. Venture Global reached Phase 1 design throughput at Plaquemines LNG in 7 months and later raised capacity to 140% of the original design. ConocoPhillips' Optimized Cascade Process was selected for Monkey Island LNG's planned 26 mtpa facility, showing the continuing role of liquefaction technology in project economics. ExxonMobil and its partners awarded USD 1.1 billion in long-lead equipment contracts for Rovuma LNG Phase 1 in Mozambique. These actions show that capacity, technology, and project execution all shape competitive position.
South and Southeast Asia offer opportunities for suppliers that can offer shorter agreements and destination flexibility. Regasification capacity under construction in these markets is advancing more quickly than long-term supply contracting. State-owned firms retain important roles because they control reserves, domestic systems, and strategic import programs. Western integrated firms retain strengths in liquefaction, shipping, and global trading. National utilities are seeking a mix of long-term agreements and flexible volumes to reduce supply risk. Competition is therefore concentrated in upstream resources but more varied across the LNG value chain.
Natural Gas Industry Leaders
QatarEnergy
Exxon Mobil Corporation
Shell plc
Cheniere Energy, Inc.
TotalEnergies SE
- *Disclaimer: Major Players sorted in no particular order

Recent Industry Developments
- July 2026: ADNOC approved a USD 6.2 billion final investment decision for the Umm Shaif Gas Cap field. The field is expected to produce more than 600 million standard cubic feet per day by 2030.
- June 2026: Gas Malaysia signed a joint development agreement with Tokyo Gas and VTTI for a proposed 6 mtpa floating storage and regasification unit in Yan, Kedah.
- March 2026: Venture Global received a USD 8.6 billion final investment decision for the second phase of its CP2 LNG export project in Louisiana. The project is intended to expand Venture Global's U.S. export capacity.
- February 2026: QatarEnergy awarded the EPC contract for the 16 mtpa North Field West expansion. The project is the final phase of QatarEnergy's planned 142 mtpa capacity program, with first exports expected by the end of 2031.


Global Natural Gas Market Report Scope
The natural gas market comprises the global economic ecosystem involved in the exploration, production, processing, transportation, storage, trading, distribution, and consumption of natural gas. It encompasses natural gas supply and demand across key end-use sectors, including power generation, industrial, residential, commercial, and transportation.
The Global Natural Gas Market Report is segmented by source, end-user, form, and geography. By source, the market is segmented into conventional natural gas and unconventional natural gas. By end-user, the market is segmented into power generation, industrial, residential, commercial, and transportation. By form, the market is segmented into compressed natural gas (CNG), liquefied natural gas (LNG), and pipeline natural gas. The report also covers the market size and forecasts for the global gas market across 26 countries in key regions. For each segment, the market sizing and forecasts have been provided on the basis of volume (trillion cubic meters).
| Conventional Natural Gas |
| Unconventional Natural Gas |
| Power Generation |
| Industrial |
| Residential |
| Commercial |
| Transportation |
| Compressed Natural Gas |
| Liquefied Natural Gas |
| Pipeline Natural Gas |
| North America | United States |
| Canada | |
| Mexico | |
| Europe | Germany |
| France | |
| Italy | |
| Spain | |
| United Kingdom | |
| Poland | |
| Russia | |
| Rest of Europe | |
| Asia-Pacific | China |
| India | |
| Japan | |
| South Korea | |
| Australia | |
| Indonesia | |
| Vietnam | |
| Thailand | |
| Rest of Asia-Pacific | |
| South America | Brazil |
| Argentina | |
| Chile | |
| Rest of South America | |
| Middle East and Africa | Saudi Arabia |
| United Arab Emirates | |
| Egypt | |
| South Africa | |
| Morocco | |
| Rest of Middle East and Africa |
| By Source | Conventional Natural Gas | |
| Unconventional Natural Gas | ||
| By End-User | Power Generation | |
| Industrial | ||
| Residential | ||
| Commercial | ||
| Transportation | ||
| By Form | Compressed Natural Gas | |
| Liquefied Natural Gas | ||
| Pipeline Natural Gas | ||
| By Geography | North America | United States |
| Canada | ||
| Mexico | ||
| Europe | Germany | |
| France | ||
| Italy | ||
| Spain | ||
| United Kingdom | ||
| Poland | ||
| Russia | ||
| Rest of Europe | ||
| Asia-Pacific | China | |
| India | ||
| Japan | ||
| South Korea | ||
| Australia | ||
| Indonesia | ||
| Vietnam | ||
| Thailand | ||
| Rest of Asia-Pacific | ||
| South America | Brazil | |
| Argentina | ||
| Chile | ||
| Rest of South America | ||
| Middle East and Africa | Saudi Arabia | |
| United Arab Emirates | ||
| Egypt | ||
| South Africa | ||
| Morocco | ||
| Rest of Middle East and Africa | ||


Key Questions Answered in the Report
What is the forecast growth rate for natural gas through 2031?
The natural gas market is projected to grow at a 2.96% CAGR from 2026 to 2031, reaching 4.91 trillion cubic meters.
Which natural gas source is growing fastest?
Unconventional gas is forecast to grow at a 3.2% CAGR through 2031, led by U.S. shale production.
Which end-user segment is growing fastest?
Transportation is forecast to expand at a 5.3% CAGR through 2031, supported by CNG and LNG vehicle use.
Why is LNG demand increasing in Asia-Pacific?
New regasification capacity, industrial expansion, and power demand are supporting regional gas use.
How are renewables affecting gas demand?
Renewables and long-duration storage are reducing gas demand in mature power systems, particularly Europe and North America.
What are the main competitive factors in LNG?
Supply reliability, methane performance, contract flexibility, delivery speed, and liquefaction capacity are central factors.
Page last updated on:





