
Naphthenic Acid Market Size and Share
Market Overview
| Study Period | 2020 - 2031 |
|---|---|
| Forecast Data Period | 2026 - 2031 |
| Historical Data Period | 2020 - 2024 |
| Growth Rate | 1.52 % |
| Fastest Growing Market | Asia Pacific |
| Largest Market | Asia Pacific |
| Market Concentration | High |
Major Players *Disclaimer: Major Players sorted in no particular order Image © Mordor Intelligence. Reuse requires attribution under CC BY 4.0. | |
Naphthenic Acid Market Analysis by Mordor Intelligence
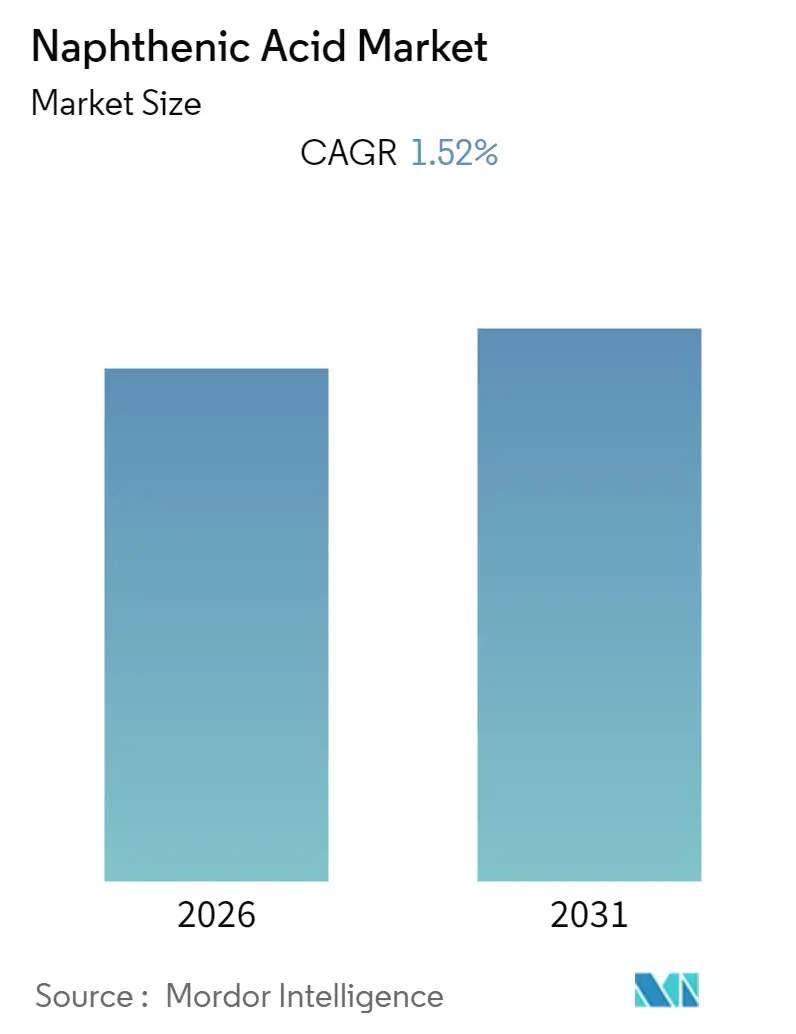
The Naphthenic Acid Market size is expected to register a CAGR of 1.52% during the forecast period (2026-2031).
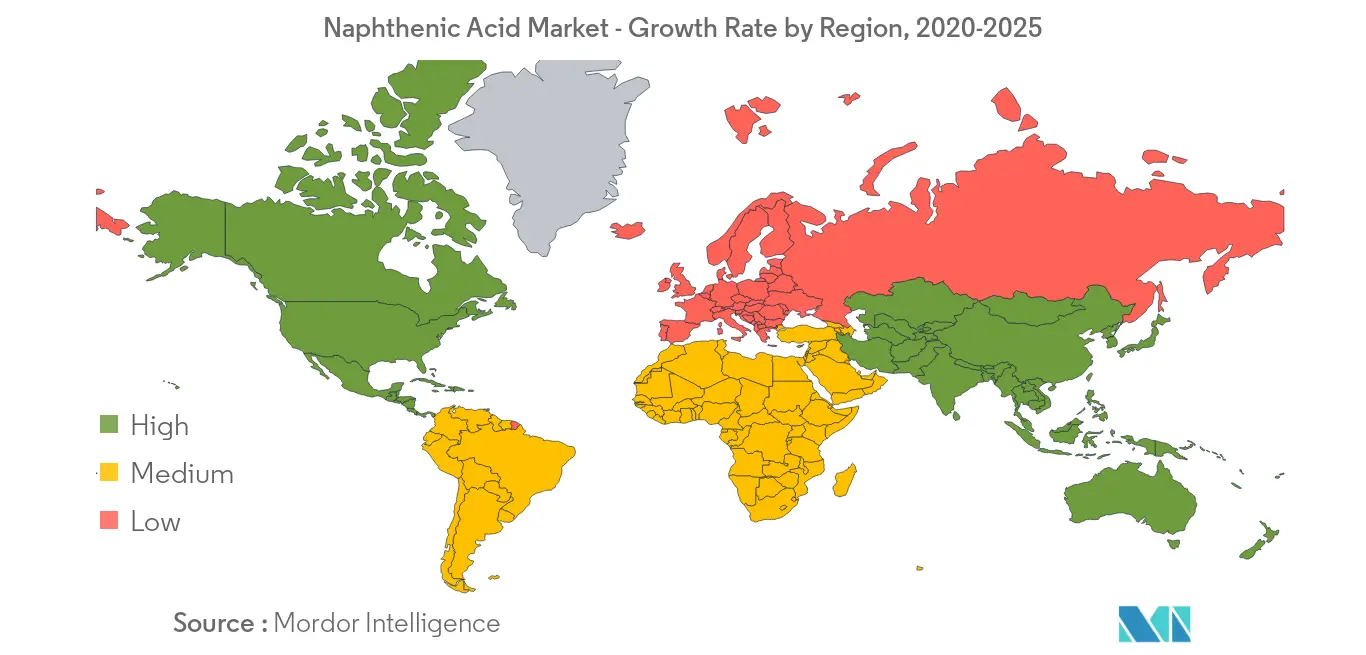
- Asia-Pacific region is expected to dominate the global market during the forecast period and is also expected witness the fastest CAGR.
- Optimal and effective mechanisms used in refining process from crude oil is likely to act as opportunities in the future.
Note: Market size and forecast figures in this report are generated using Mordor Intelligence’s proprietary estimation framework, updated with the latest available data and insights as of 2026.
Market Trends and Insights
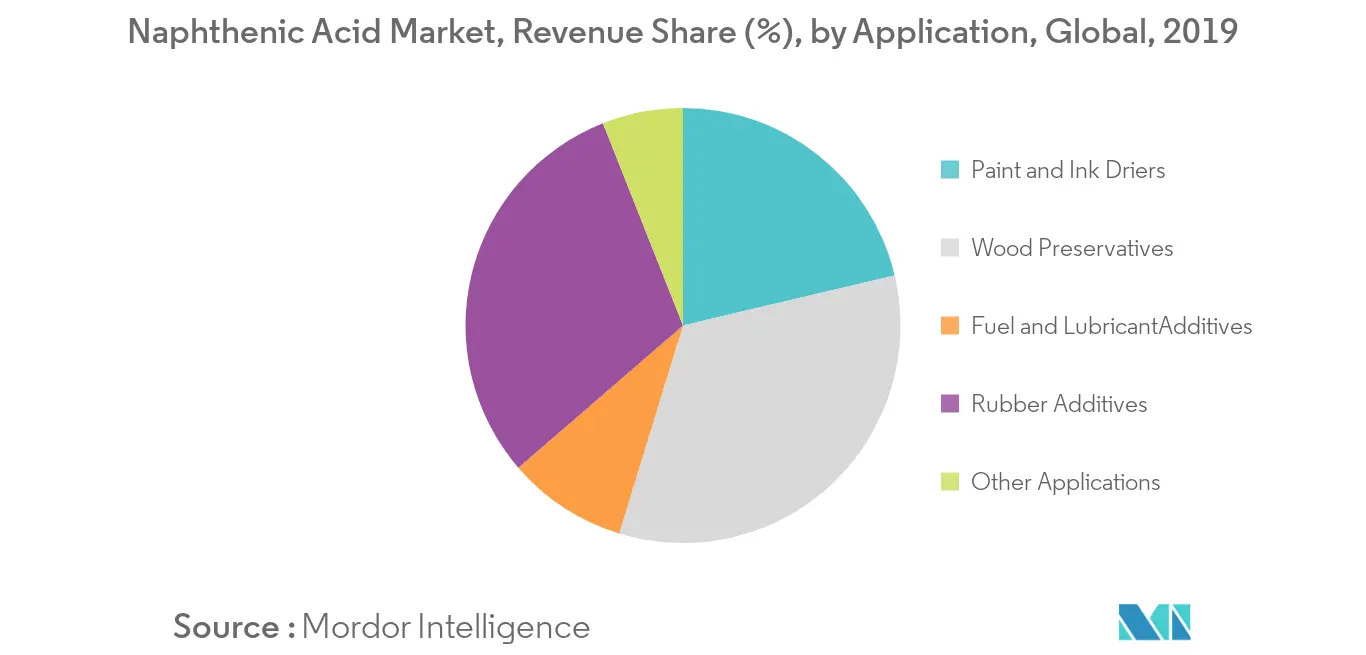
Growing Demand for Wood Preservatives
- Copper and Zinc salts of naphthenic acid known as copper or zinc naphthenate are used in wood preservation and for protecting other cellulosic materials from damage by decay fungi and insects.
- Their addition in wood preservatives helps to prevent the decay of wood products such as fences, poles, and furniture, and timber surfaces and structures in buildings. The decay may be caused by the sun, extremes of temperature, humidity or by fungi and insects (particularly termites and borers). Growing furniture production and booming construction industry is majorly expected to drive the demand for wood preservatives and hence the demand for naphthenic acid through the years.
- According to the China Furniture Association, there are more than 100,000 furniture manufactures located in the five major furniture manufacturing bases.
- In terms of quantity, Malaysia was the largest exports of wooden furniture (26,482,004 units), followed by Thailand (10,936,274 units). In terms of office wooden furniture, Malaysia and China dominated the market in exports.
- Overall, the growing furniture market is majorly expected to fuel the wood preservatives consumption; which, in turn, will increase the demand for naphthenic acid through the forecast period.


China to Dominate the Demand in Asia-Pacific Region
- The demand for Naphthenic acid in China is expected to rise at a great pace due to the increasing demand from furniture manufacturing companies as solvent based intermediaries for the wood preservative applications.
- China is topping the rank as a furniture producer, consumer and exporter. It accounts for around 40% of the global furniture production. The country’s furniture industry is mainly driven by real estate sales.
- As per the Global Infrastructure Outlook report, China, Japan, South Korea, India and Singapore are the major countries comprising the investment needs for infrastructure which already share over half the global infrastructure market.
- Rising demand for home decoration, increased standard of living and its consumption in aerospace applications as an anti-corrosive agent in the production of jet fuel is likely to have a positive effect on the consumption of naphthenic acid in the country.
- Over the next 20 years, China is expected to be the world’s largest single‐country market for civil aircraft sales. Presently, the country is running 2,185 general aviation aircraft. Moreover, it is planning to build more than 5,000 aircraft and 500 airports, by 2020, which, in turn, is expected to boost the demand for jet fuels in the country.
- Owing to all the aforementioned factors, the market for naphthenic acid in the region is projected to grow during the forecast period.

Competitive Landscape
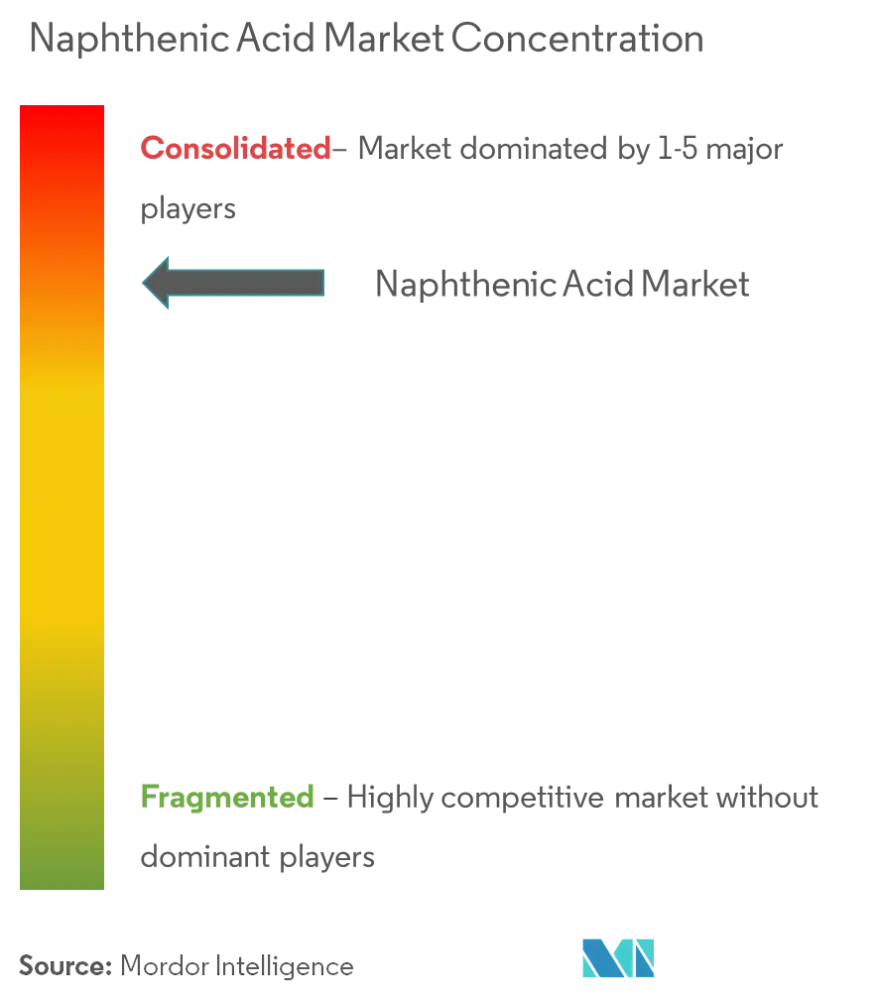
The global naphthenic acid market is consolidated, where the top three players account for majority of the global market share. Major players in the market include Merichem Company, Umicore Cobalt & Specialty Materials (CSM), and Midas Chemical Company Limited, among others.
Naphthenic Acid Industry Leaders
Merichem Company
Umicore
Midas
- *Disclaimer: Major Players sorted in no particular order
Naphthenic Acid Market Companies Covered in this Report
- fulltime (Anhui Fulltime Specialized Solvent & Reagent Co. Ltd)
- Haihang Industry Co. Ltd
- Karvan - l
- Merck KGaA
- Merichem Company
- Midas Chemical Company Limited
- Shanghai Changfeng Chemical Industrial Factory
- Shenyang Zhang Ming Chemical Co., Ltd.
- Tokyo Chemical Industry Co. Ltd
- Umicore Cobalt & Specialty Materials (CSM)

Market Opportunities and Future Outlook
Opportunities center on process and product differentiation within a consolidated supply base. On the demand side, naphthenic-acid-derived copper and zinc naphthenates remain established actives in wood preservation, linking consumption to construction and furniture output, which is concentrated in Asia-Pacific (China is cited as accounting for about 40% of global furniture production). This supports whitespace for suppliers that can provide consistent metal naphthenate intermediates and tighter impurity control for downstream formulators serving poles, fencing, and structural wood applications.
On the supply and product side, refinery modernization and treating technology upgrades create openings to increase availability and shift mix toward refined or high-purity streams used in fuel and lubricant additive packages and performance driers. The market shows a split between commodity and higher-purity requirements, and end-user moves toward more tightly specified acid component profiles raise the value of purification capability and reliable specifications. With Asia-Pacific holding the largest market share in 2025, supplier focus on regionally proximate feedstock access and upgraded separation or treating steps offers a practical way to compete in higher-value applications tied to refined fuels, including specialty lubricants and corrosion-inhibitor uses.
Recent Industry Developments in Naphthenic Acid Market
- July 2026: Umicore continued to position naphthenic acid within its metal carboxylates and lubricant-additives portfolio for industrial manufacturing end uses. The ongoing portfolio emphasis supports supply continuity for formulators that use naphthenic-acid-derived chemistries in lubricants, greases, and fluids, aligning with the report's focus on fuel and lubricant additive demand.
- November 2025: The ruling by U.S. Customs and Border Protection N352217 addressed country-of-origin treatment for processed naphthenic acids under 19 CFR 177.9(b)(1). The ruling reinforced documentation and traceability expectations for cross-border shipments, influencing how producers and traders structure sourcing, processing, and labeling for naphthenic acid supply chains.
- January 2025: Merichem Technologies commissioned a NAPFINING treating system at National Petroleum Refiners of South Africa Ltd. to address emulsion formation and lift jet fuel production rates. This highlighted the role of refinery-side treating solutions in improving fuel-stream quality and throughput, which can affect availability and consistency of naphthenic-acid-related streams used across downstream applications.


Naphthenic Acid Market Report Scope and Research Methodology
Market Definition and Coverage
For this study, the market is defined as the value of naphthenic acid sold as a commercial chemical (including refined and high-purity grades) for industrial use, valued at the point of sale in constant USD terms.
Scope exclusions: We exclude upstream crude oil extraction value, internal captive transfers without a commercial price, and downstream finished goods value where naphthenic acid is only a minor additive.
Segments Covered in This Report
- Type
- Refined Naphthenic Acid
- High-purity Naphthenic Acid
- Application
- Paint and Ink Driers
- Wood Preservatives
- Fuel and Lubricant Additives
- Rubber Additives
- Other Applications
- Geography
- Asia-Pacific
- China
- India
- Japan
- South Korea
- Rest of Asia-Pacific
- North America
- United States
- Canada
- Mexico
- Europe
- Germany
- United Kingdom
- Italy
- France
- Rest of Europe
- Rest of the World
- Asia-Pacific
Data Sources, Market Sizing, and Validation
Desk Research
Desk work started by building the supply and demand context around naphthenic acid, since it is closely linked to petroleum refining streams and industrial additives. We referenced public sources such as energy and refinery statistics from the US Energy Information Administration, trade and tariff line data from UN Comtrade, industrial chemicals information from the European Chemicals Agency, and hazard and use profiles from the US EPA.
To make the dataset usable for sizing, we also reviewed company annual reports, investor presentations, sustainability reports, and reputable press releases that discuss specialty chemicals output and end use demand. Patent databases were screened to understand where metal naphthenates, driers, and lubricant additive use is evolving, and an import and export shipment-level database was used selectively to sanity-check trade flows where product labeling is clear. These sources are not exhaustive, and many other public documents were referred to for data collection, validation, and research clarification.
Primary Interviews and Surveys
Primary work was used to confirm how naphthenic acid is sold (grade, purity, and typical contract structure) and to validate how demand splits across lubricant additives, paint and ink driers, wood preservatives, and rubber additives. We spoke with a mix of producers, distributors, and downstream formulators across APAC, EMEA, and the Americas, and then used follow-up questions to close gaps on price ranges, substitution risk, and the pace of demand changes by application.
Distribution of primary research fieldwork respondents
| Company type | Respondent position | Region |
|---|---|---|
| Top tier: 28% | CXOs: 14% | APAC: 45% |
| Mid tier: 51% | Functional/Unit leaders: 36% | EMEA: 34% |
| Smaller Players: 21% | Managers: 50% | Americas: 21% |
Market-Sizing & Forecasting
Sizing was built using a top-down approach where production signals from refinery streams and chemicals output proxies were used to reconstruct the addressable naphthenic acid pool, and then filtered by application-level consumption patterns. To keep the totals realistic, the model was cross-checked using selective bottom-up approximations, such as sampled supplier volume ranges, distributor channel checks, and price-band checks for refined versus high-purity material.
Key inputs used in the model included regional refinery throughput trends, observed import and export movements where classification is consistent, typical purity mix by application, estimated formulation treat rates in lubricant additives and driers, and average selling price ranges by grade. Because public data can be patchy at product level, gaps were handled through bounded assumptions that were reviewed with industry respondents and then stress-tested so outliers did not drive the final number.
For forecasting, scenario analysis was used, based on expected industrial output trends and application pull, and then adjusted using expert consensus on pricing direction and substitution. The final forecast path was kept smooth unless a clear trigger exists, such as regulation-led shifts in wood preservatives or major changes in refining economics.
Data Validation & Update Cycle
Results were validated by comparing modeled demand against independent signals like trade direction, refinery activity, and downstream usage cues from additive and coatings value chains. When a region showed a sharp jump or drop, the assumptions were rechecked, interview notes were revisited, and follow-up outreach was triggered to confirm whether the movement was real or a data artifact.
Before sign-off, the work goes through multi-step analyst review, including variance checks across years, currency conversion consistency, and unit reconciliation. Reports are refreshed annually, and interim updates are made when material events occur, after which a final pre-delivery review is completed so clients receive the latest updated view.
Mordor Intelligence's Naphthenic Acid Market Size Compared Against Other Published Estimates
Published market sizes for naphthenic acid often disagree because authors do not always count the same products, grades, or value points, and the conversion to USD can be taken at different timings. Differences also come from how price is treated over time, since this market can be shaped by petroleum feedstock movements and contract structures.
Trade-flow direction checks and grade-level price band validation were the evidence gates used to keep Mordor Intelligence tied to a commercially traded naphthenic acid demand pool, instead of a broader set of related naphthenate derivatives or downstream formulations. When an estimate assumes wider end-use coverage or applies a higher growth setting without matching it to refinery-linked availability and realistic treat rates, the reported value can move away from what buyers and sellers typically recognize as the market.
Benchmark comparison
| Source | Market Size | Gaps in Research Methodology |
|---|---|---|
| Mordor Intelligence | USD 0.07 B (2025) | |
| Industry Publisher A | USD 0.07 B (2025) | Uses a similar global scope but can differ on value point, with some pricing captured closer to downstream formulated product realizations, which can slightly lift the total even when volumes match. |
| Industry Publisher B | USD 0.72 B (2024) | Appears to bundle adjacent additives and broader end-use chemistry under naphthenic acid, which expands the demand pool beyond refined and high-purity naphthenic acid sales and results in a much larger headline figure. |
The spread in the table is mainly explained by boundary choices and how closely the model is anchored to traded naphthenic acid volumes and grade-specific prices. By keeping the scope tied to clear applications and checking totals against external supply and trade signals, the final number stays repeatable and easier to audit year to year.


Key Questions Answered in the Report
What is the current Naphthenic Acid Market size?
The Naphthenic Acid Market is projected to register a CAGR of 1.52% during the forecast period (2026-2031)
Who are the key players in Naphthenic Acid Market?
Merichem Company, Umicore and Midas are the major companies operating in the Naphthenic Acid Market.
Which is the fastest growing region in Naphthenic Acid Market?
Asia Pacific is estimated to grow at the highest CAGR over the forecast period (2026-2031).
Which region has the biggest share in Naphthenic Acid Market?
In 2025, the Asia Pacific accounts for the largest market share in Naphthenic Acid Market.
What years does this Naphthenic Acid Market cover?
The report covers the Naphthenic Acid Market historical market size for years: 2019, 2020, 2021, 2022, 2023 and 2024. The report also forecasts the Naphthenic Acid Market size for years: 2026, 2027, 2028, 2029, 2030 and 2031.
Page last updated on:


 Your data is secure and never sold or shared.


