Multi Vendor Support Services Market Size and Share
Market Overview
| Study Period | 2020 - 2031 |
|---|---|
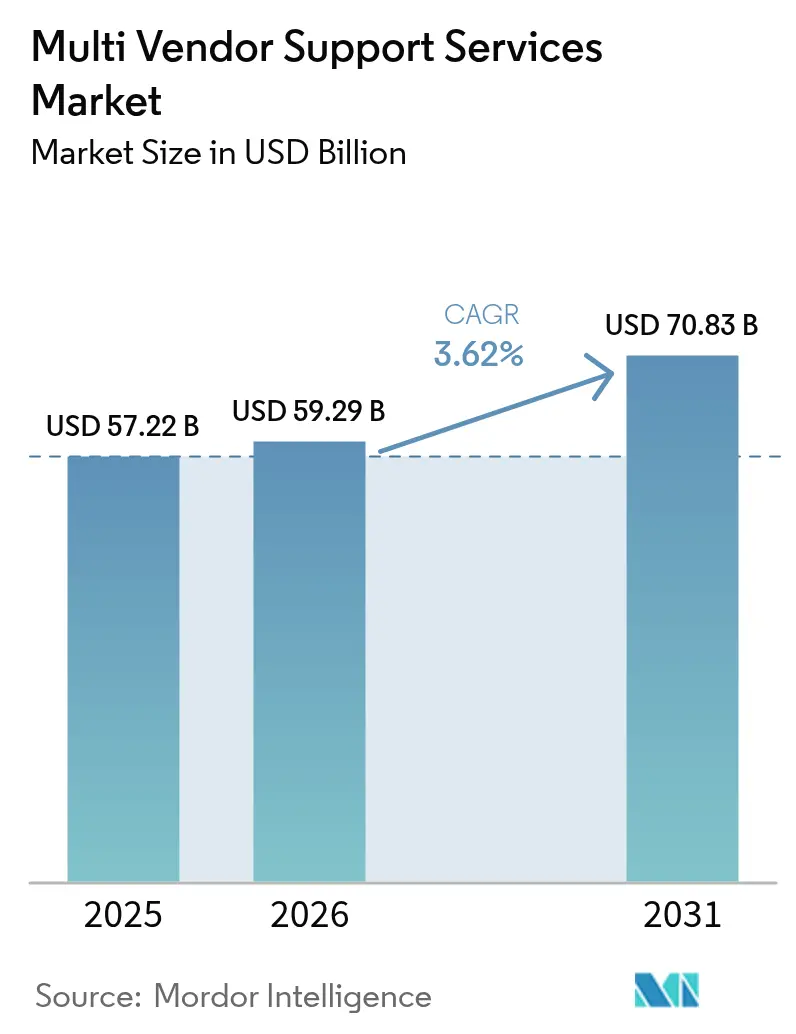
| Market Size (2026) | USD 59.29 Billion |
| Market Size (2031) | USD 70.83 Billion |
| Growth Rate (2026 - 2031) | 3.62% CAGR |
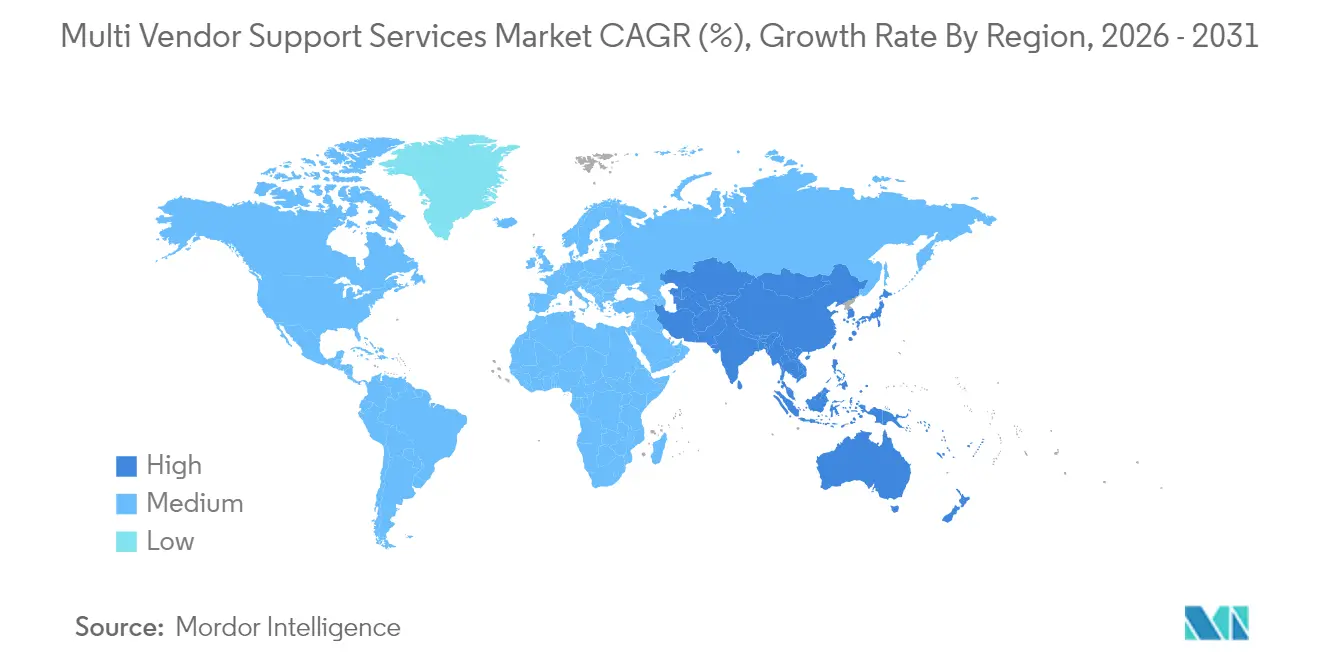
| Fastest Growing Market | Asia Pacific |
| Largest Market | North America |
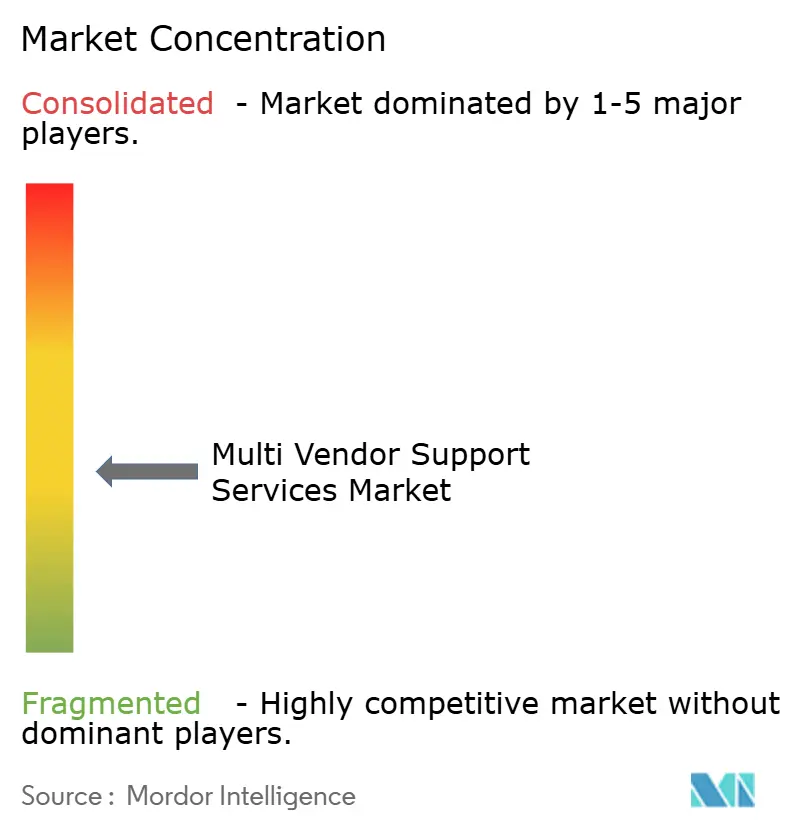
| Market Concentration | Medium |
Major Players *Disclaimer: Major Players sorted in no particular order Image © Mordor Intelligence. Reuse requires attribution under CC BY 4.0. | |
Multi Vendor Support Services Market Analysis by Mordor Intelligence
The Multi Vendor Support Services market size is expected to grow from USD 57.22 billion in 2025 to USD 59.29 billion in 2026 and is forecast to reach USD 70.83 billion by 2031 at 3.62% CAGR over 2026-2031. Rising enterprise demand for predictable, outcome-based support contracts and the need to navigate increasingly heterogeneous hardware and software estates underpin this steady expansion. Cost-optimized purchasing policies, accelerated by macro-economic caution, are steering buyers toward vendor consolidation and life-extension strategies that lower total cost of ownership without compromising compliance. Providers with robust AI-driven diagnostics, zero-trust security frameworks, and experience in regulated sectors are gaining competitive advantage. Heightened regulatory focus on operational resilience, particularly in financial services, and on sustainability-linked product lifecycles, especially in Europe, is also reshaping service scope and value propositions.
Key Report Takeaways
- By service type, managed services captured 70.65% of the Multi Vendor Support Services market share in 2025; remote and virtual support is projected to log the fastest 4.38% CAGR to 2031.
- By enterprise size, large enterprises held 69.10% of the Multi Vendor Support Services market in 2025, while the SME segment is expanding at a 4.86% CAGR through 2031.
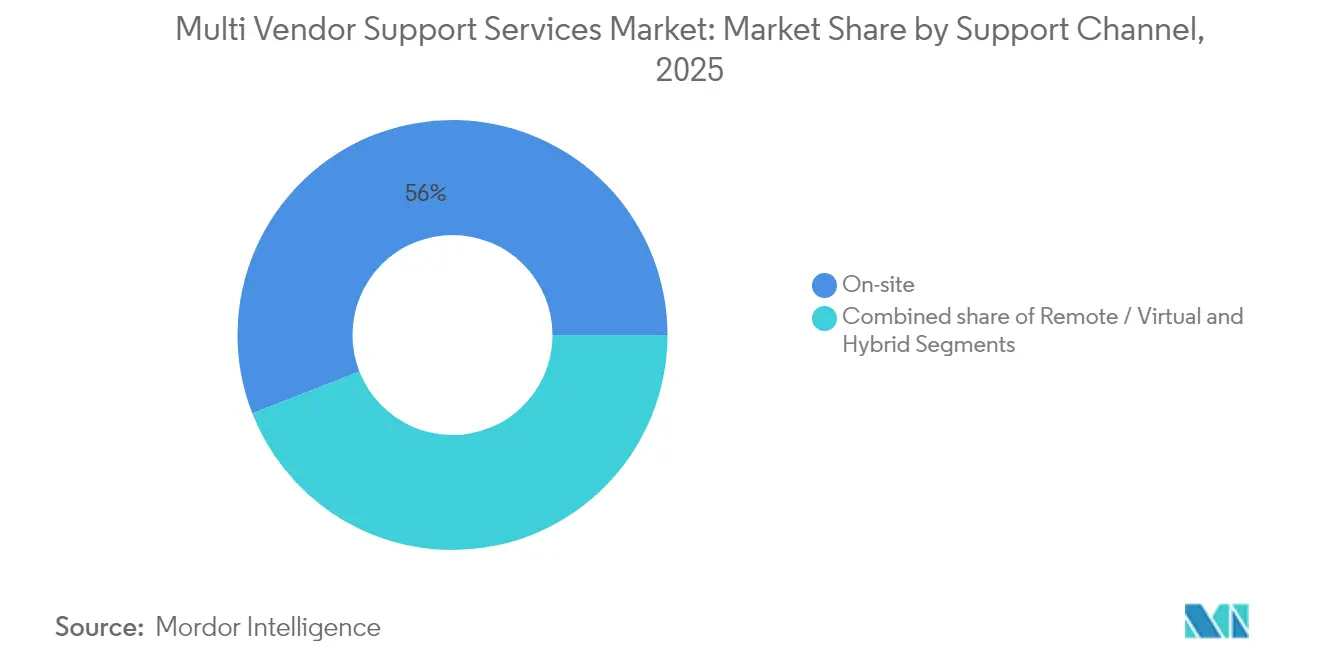
- By support channel, on-site services accounted for 55.95% of the Multi Vendor Support Services market size in 2025, but hybrid models mixing remote diagnostics with targeted field visits are scaling fastest.
- By end-user vertical, IT & telecommunications led with 22.10% revenue share in 2025; BFSI is poised to grow at a 3.78% CAGR through 2031 on the back of operational-resilience mandates.
- By geography, North America dominated with 34.60% revenue share in 2025; Asia-Pacific is forecast to clock a 4.03% CAGR to 2031 as cloud-first deployments proliferate.
Note: Market size and forecast figures in this report are generated using Mordor Intelligence’s proprietary estimation framework, updated with the latest available data and insights as of 2026.
Global Multi Vendor Support Services Market Trends and Insights
Drivers Impact Analysis*
| Driver | (~) % Impact on CAGR Forecast | Geographic Relevance | Impact Timeline |
|---|---|---|---|
| Rising maintenance cost of OEM services | +1.2% | Global (North America, Europe highest) | Medium term (2-4 years) |
| Growing complexity of multi-vendor IT estates | +0.8% | Global (APAC scaling) | Long term (≥ 4 years) |
| Cost-optimization and vendor consolidation push | +0.9% | North America and EU, expanding to APAC | Short term (≤ 2 years) |
| Shorter OEM support window / rapid obsolescence | +0.6% | Global, technology-intensive regions | Medium term (2-4 years) |
| Sustainability-linked life-extension mandates | +0.4% | EU leading | Long term (≥ 4 years) |
| AI-driven predictive maintenance capabilities | +0.7% | North America and EU early adoption | Medium term (2-4 years) |
| Source: Mordor Intelligence | |||
Rising Maintenance Cost of OEM Services
OEMs continue to lift annual maintenance prices as hardware margins erode, widening the cost differential against independent support firms that frequently deliver equivalent SLAs at 50–80% lower expense. Procurement teams now benchmark total cost of ownership rather than headline purchase prices, spurring hybrid models that retain OEM cover for mission-critical assets while offloading legacy estates to third-party providers. CFO-led scrutiny has intensified under uncertain economic conditions, accelerating the switch to outcome-based contracts that guarantee uptime while capping spend. Even heavily regulated organizations are joining the shift, provided providers evidence compliance with sector-specific controls. The financial effect has made cost-savings a primary selection criterion in new tenders.
Growing Complexity of Multi-Vendor IT Estates
Typical enterprises now run equipment from five to seven manufacturers, a product of best-of-breed strategies and rapid cloud adoption. Heterogeneous stacks increase interoperability challenges and expose gaps in traditional OEM-centric support models. Companies therefore expect partners to own end-to-end incident resolution across servers, storage, networking, and cloud platforms. This complexity premium rewards service integrators with certified expertise on disparate technologies and centralized command centers capable of orchestrating multi-party escalations. Demand is rising for unified dashboards that provide single-pane-of-glass visibility into incident queues and SLA compliance.
Cost-Optimization and Vendor Consolidation Push
Operating-expense reduction programs prioritize supplier rationalization, with enterprises discovering that managing several dozen contracts can inflate procurement and governance overheads by 15–20%. Aggregated spending enhances bargaining leverage and simplifies SLA management, fueling migration toward providers that can support multi-vendor estates globally. Consolidation is particularly attractive to organizations facing heightened audit scrutiny, as a single master services agreement eases compliance tracking. As a result, vendors showcasing broad certification portfolios and proven governance frameworks enjoy higher win rates.
Shorter OEM Support-Window / Rapid Obsolescence
Hardware refresh cycles have compressed to approximately four years, with end-of-support notifications often arriving before capital investments are fully depreciated[1]European Commission, “Circular Economy Action Plan,” ec.europa.eu. Third-party providers are bridging this gap, offering parts availability and on-site engineering for platforms that OEMs no longer service. Customers extend asset life to redirect capital toward transformative initiatives such as edge computing and AI analytics. EU ecodesign directives are reinforcing this life-extension mindset by emphasizing repairability and circular-economy metrics.
Restraints Impact Analysis*
| Restraint | (~) % Impact on CAGR Forecast | Geographic Relevance | Impact Timeline |
|---|---|---|---|
| Security and privacy concerns with third-party access | -0.7% | Global, regulated industries focus | Short term (≤ 2 years) |
| OEM resistance and warranty-void threats | -0.5% | Global, risk-averse enterprises | Medium term (2-4 years) |
| Global shortage of legacy hardware skill sets | -0.4% | Developed markets acute | Long term (≥ 4 years) |
| Compliance / data-sovereignty complexities | -0.3% | Europe and APAC | Medium term (2-4 years) |
| Source: Mordor Intelligence | |||
Security and Privacy Concerns with Third-Party Access
High-profile supply-chain breaches have heightened scrutiny of extended vendor ecosystems, with frameworks such as the EU Digital Operational Resilience Act obliging banks to evidence robust third-party risk governance. Security teams fear that privileged remote tools could become attack vectors, delaying contracting cycles while due-diligence checks are completed. Leading support firms are responding with zero-trust architectures, rigorous background screening, and cyber-insurance protections that in several cases exceed OEM offerings. Adoption momentum is therefore tempered but not derailed, as risk-mitigation best practices mature.
OEM Resistance and Warranty-Void Threats
Many manufacturers threaten to void warranty coverage if unauthorized technicians work on equipment, deterring some enterprises from fully migrating to independent support[2]Repair Association, “Right to Repair Policy Updates,” repair.org. Right-to-repair legislation enjoys growing political backing in the United States and Europe, but tangible relief remains two to three years away. To navigate the risk, buyers commonly keep OEM cover on newer assets while transferring older fleets to third-party maintenance. Independents counteract OEM rhetoric by offering insurance underwriters that guarantee performance equivalent to original warranties, yet perception hurdles persist among risk-averse boards.
*Our forecasts treat driver/restraint impacts as directional, not additive. The impact forecasts reflect baseline growth, mix effects, and variable interactions.
Segment Analysis
By Service Type: Managed Services Drive Market Evolution
Managed services accounted for 70.65% of the Multi Vendor Support Services market share in 2025, evidencing enterprise preference for predictable, outcome-based models that offload operational risk. Providers package 24×7 monitoring, parts logistics, and compliance reporting into multi-year contracts that harmonize disparate SLAs. The Multi Vendor Support Services market size for managed services is forecast to expand at a 5.23% CAGR from 2026 to 2031 as AI-powered tools elevate automation and lower unit costs. Professional services remain vital for migrations and complex upgrades but are expected to grow more slowly, constrained by one-time project billing.
Advanced providers differentiate by embedding machine-learning engines that anticipate failures and schedule just-in-time parts delivery, raising asset uptime. Predictive analytics combined with automated runbooks shrink mean-time-to-repair, enabling service-credit models that align incentives. The managed approach also supports regulatory audits, as centralized ticket data simplifies evidence gathering. Collectively, these attributes reinforce customer loyalty and underpin higher renewal rates that elevate provider valuations.


By Enterprise Size: SME Adoption Accelerates Digital Parity
Large organizations retained 69.10% revenue share in 2025, reflecting extensive legacy estates and complex compliance demands. Yet SMEs are the fastest-growing constituency, logging a 4.86% CAGR through 2031 as cloud economics level the playing field. Consumption-based pricing plus standardized support bundles remove the need for hefty capital outlays, making enterprise-grade services accessible to smaller IT teams. Providers leverage remote monitoring and templated runbooks to deliver scale benefits irrespective of client headcount.
SME demand is strongest in manufacturing, healthcare, and professional-services niches where regulatory and uptime requirements mirror those of larger peers. Vendors respond with modular offerings that bundle security, backup, and hardware maintenance into a single invoice. This simplification resonates with mid-market CFOs eager to consolidate suppliers and streamline governance, translating into longer contract tenures once onboarded.
By Support Channel: Remote Capabilities Transform Service Delivery
On-site interventions still represented 55.95% of the Multi Vendor Support Services market in 2025, underscoring the continued need for hands-on expertise in secure facilities and heavy-industries plants. Nonetheless, the Multi Vendor Support Services market size attached to remote services is climbing rapidly, thanks to a 4.38% CAGR fueled by augmented-reality headsets, AI-assisted troubleshooting, and encrypted connectivity. Pandemic travel restrictions proved the viability of virtual resolution workflows, and many customers now make remote triage a contract prerequisite.
Hybrid models prevail: providers run initial diagnostics remotely, dispatching field engineers only when physical repair is unavoidable. This approach cuts response times, trims travel emissions, and maximizes talent utilization across regions. Leading platforms integrate automatic session recording, sentiment analysis of technician-client dialogues, and auto-generated service reports, relieving engineers of administrative overhead.
By End-User Vertical: BFSI Leads Digital Resilience Investment
IT and telecommunications firms generated the largest revenue slice at 22.10% in 2025, reflecting demanding uptime SLAs and rapid product cycles. Financial-services institutions, however, will contribute the highest incremental growth, with a 3.78% CAGR to 2031. Regulatory imperatives such as DORA place stringent resilience and third-party oversight duties on banks, spurring comprehensive support contracts that span data centers and hybrid-cloud nodes. Healthcare buyers are likewise leaning on multi-vendor support to manage connected medical devices under HIPAA and GDPR constraints.
Manufacturers adopt predictive maintenance to avert unplanned line stoppages, while retailers rely on end-to-end support for omnichannel point-of-sale platforms. Energy utilities constitute an emerging hotspot, where distributed grid assets require rapid field response and secure remote diagnostics. The depth of domain knowledge demanded in these regulated segments favors providers willing to certify engineers, invest in compliance automation, and secure sector-specific accreditations.
Geography Analysis
North America commanded 34.60% of global revenue in 2025, underpinned by early cloud adoption, sophisticated procurement teams, and stringent data-protection rules that favor specialized partners. The region’s enterprises tend to refresh hardware frequently, generating a steady pipeline for lifecycle-extension services. High labor costs also magnify the economic argument for automation-driven remote support, prompting providers to establish AI centers of excellence in the United States and Canada.
Europe maintains a solid position, buoyed by ecodesign regulations that encourage repairability and by privacy frameworks such as GDPR that elevate audit requirements. Multi-vendor contracts often incorporate green-IT metrics, rewarding providers that can document carbon savings from extended asset life. Government agencies in Germany and the Nordics are pioneering long-term partnerships that weave sustainability KPIs into performance dashboards.
Asia-Pacific is the growth engine, expected to post a 4.03% CAGR to 2031. Enterprises in India, China, and Indonesia are leapfrogging legacy architectures, adopting cloud-native workloads that require heterogeneous support from day one. Local service integrators are scaling rapidly, while global players open regional service hubs and bilingual helpdesks to tap rising demand. Regulatory maturity varies by market, but the common thread is an aggressive digital-transformation agenda that outstrips local OEM warranty provisions, reinforcing the multi-vendor proposition.
South America and the Middle East and Africa register smaller absolute spending yet demonstrate strong interest in remote-first models to overcome talent shortages and geographical dispersion. Currency volatility and fiscal constraints temper contract sizes, but low data-center density makes high uptime even more critical, enhancing the value narrative for predictive maintenance propositions.

Competitive Landscape
The Multi Vendor Support Services market remains moderately fragmented but is consolidating as clients favor suppliers with global reach and broad certification portfolios. Major OEMs such as IBM, Dell, and Cisco continue to operate in-house support arms yet face pricing pressure from independents promoting 50–70% cost savings. Acquisition activity is brisk: IBM agreed to purchase HashiCorp for USD 6.4 billion to fortify multi-cloud automation, while Cognizant bought Belcan for USD 1.3 billion to diversify into engineering services.
Technology investment defines competitive edge. Providers are embedding predictive-analytics engines that decode telemetry streams and trigger proactive dispatch. Field technicians receive augmented-reality overlays for guided repair, raising first-time fix ratios. Security posture is equally pivotal; zero-trust remote-access gateways and continuous compliance reporting distinguish bids in regulated verticals. Vendors unable to fund such platforms risk relegation to niche, price-led segments.
Vertical specialization deepens as players court industries with complex governance regimes. Rimini Street’s expansion into SAP cloud support strengthens its appeal to enterprises balancing hybrid ERP stacks. NWN’s acquisition of InterVision broadens its cybersecurity and public-sector footprint, underscoring a trend toward portfolio stacking to win multi-tower contracts[3]Finsmes, “NWN Corporation Acquires InterVision,” finsmes.com . Private-equity investors, exemplified by Warburg Pincus backing Service Express, target firms with recurring revenue and sticky customer bases, accelerating roll-up strategies.
Emerging disruptors include cloud-native managed-service providers leveraging infrastructure-as-code tooling to deliver elastic support at margins untenable for legacy models. However, risk-averse global enterprises still prize long operating histories and audited controls, limiting near-term share shift. Overall, the competitive dynamic is transitioning from pure cost contest to value-centric differentiation anchored in automation, vertical compliance expertise, and ESG alignment.
Multi Vendor Support Services Industry Leaders
IBM Corporation
Microsoft Corporation
Oracle Corporation
Hewlett Packard Enterprise Co
Dell Technologies Inc
- *Disclaimer: Major Players sorted in no particular order

Recent Industry Developments
- June 2025: Atos Group received a confirmatory offer from the French State to acquire its Advanced Computing business for EUR 410 million (USD 445 million), excluding Vision AI activities.
- June 2025: NWN Corporation acquired InterVision Systems, deepening capabilities in customer experience, cybersecurity, and intelligent infrastructure.
- May 2025: Dell Technologies and NVIDIA launched Dell AI Factory, a turnkey enterprise AI infrastructure and services platform.
- January 2025: IBM Consulting acquired Oracle-specialist AST, reinforcing multi-vendor platform expertise.


Research Methodology Framework and Report Scope
Market Definitions and Key Coverage
Our study defines the multi-vendor support services market as all paid post-warranty hardware and software maintenance, break-fix, and proactive monitoring contracts that a single service provider delivers across mixed IT estates covering servers, storage, network gear, operating systems, and key enterprise applications. According to Mordor Intelligence, the valuation tracks revenue generated by both on-site and remote service channels across large enterprises and SMEs worldwide.
Scope exclusion: warranties bundled in original equipment sales and pure help-desk outsourcing contracts are not included.
Segmentation Overview
- By Service Type
- Professional
- Managed
- By Enterprise Size
- Large Enterprises
- Small and Medium Enterprises (SMEs)
- By Support Channel
- On-site
- Remote / Virtual
- Hybrid
- By End-user Vertical
- IT and Telecommunication
- BFSI
- Healthcare
- Energy and Power
- Manufacturing
- Retail
- Other End-user Verticals
- By Geography
- North America
- United States
- Canada
- Mexico
- Europe
- Germany
- United Kingdom
- France
- Italy
- Spain
- Rest of Europe
- Asia-Pacific
- China
- Japan
- India
- South Korea
- Australia
- Rest of Asia-Pacific
- South America
- Brazil
- Argentina
- Rest of South America
- Middle East and Africa
- Middle East
- Saudi Arabia
- United Arab Emirates
- Turkey
- Rest of Middle East
- Africa
- South Africa
- Egypt
- Nigeria
- Rest of Africa
- Middle East
- North America
Detailed Research Methodology and Data Validation
Primary Research
Mordor analysts interviewed service architects at independent maintainers, enterprise infrastructure managers in North America, Europe, and Asia, and sourcing advisors who monitor third-party maintenance bids. These conversations validated real-world contract values, renewal cycles, and emerging hybrid cloud support pain points that secondary data alone could not surface.
Desk Research
We began by mapping the service universe through freely available tier-1 sources such as United States Census ICT surveys, Eurostat Digital Economy indicators, International Telecommunication Union ICT price baskets, Gartner Total Cost of Ownership studies, and trade association briefs from the Service Industry Association. Company 10-Ks, vendor price lists, and news archived in Dow Jones Factiva supplemented utilization rates and average support fee movements.
Patent analytics from Questel and import shipment clues from Volza then helped us sense check installed-base longevity for legacy hardware. The sources named here illustrate the breadth we explored; many additional open materials reinforced data points before they flowed into the model.
Market-Sizing & Forecasting
A top-down build started with enterprise IT spend pools from national accounts, which were then split by maintenance intensity, device class mix, and average contract penetration rates. Supplier roll-ups of sampled ASP times volume provided a selective bottom-up cross-check, allowing us to trim variance where data packets ran thin.
Key variables in our model include installed-base age profile, OEM list-price inflation, third-party discount depth, cloud migration pace, and regional labor cost drift. Multivariate regression aligned each driver with historic revenue, and an ARIMA overlay projected through 2030 while scenario inputs from primary experts bounded outliers.
Data Validation & Update Cycle
Outputs pass through three analyst reviews, anomaly flags trigger re-contact with experts, and figures are benchmarked against quarterly earnings signals. The report refreshes annually; yet material events such as a major OEM price hike prompt interim updates so clients receive our latest view.
Why Mordor's Multi Vendor Support Services Baseline Earns Trust
Published estimates often differ because each firm carves the market by service mix, geography focus, and refresh cadence.
Key gap drivers include competitors counting only hardware tickets, applying static average selling prices, or projecting from pre-pandemic run rates without post-cloud correction, whereas our base year anchors on verified 2025 contracts and is adjusted for remote support's faster expansion.
Benchmark comparison
| Market Size | Anonymized source | Primary gap driver |
|---|---|---|
| USD 57.22 B (2025) | Mordor Intelligence | |
| USD 56.23 B (2024) | Global Consultancy A | Excludes remote diagnostics and SME contracts |
| USD 54.67 B (2024) | Regional Consultancy A | Uses list prices, limited primary validation |
| USD 60.14 B (2023) | Trade Journal B | Older base year, hardware-only scope |
The comparison shows how scope breadth, live contract pricing, and annual refresh discipline shape final numbers. By grounding each assumption in openly traceable data and fresh dialogue, Mordor Intelligence delivers a balanced baseline decision makers can rely on.


Key Questions Answered in the Report
What is the current size of the Multi Vendor Support Services market?
The Multi Vendor Support Services market size stood at USD 59.29 billion in 2026 and is projected to reach USD 70.83 billion by 2031.
Which service type dominates the Multi Vendor Support Services market?
Managed services dominate, holding 70.65% market share in 2025 as enterprises favor outcome-based, risk-transfer contracts.
Which region is growing fastest?
Asia-Pacific is forecast to record the fastest 4.03% CAGR through 2031, driven by rapid cloud-first adoption and growing need for multi-vendor integration.
Why are financial institutions increasing spend on multi-vendor support?
Frameworks such as the EU Digital Operational Resilience Act obligate banks to strengthen third-party risk management and operational resilience, prompting 3.78% CAGR spending growth in BFSI.
How are AI technologies influencing support delivery?
Providers embed machine-learning models for predictive maintenance, improving uptime and reducing mean-time-to-repair, a key differentiator in contract bids.
What is a typical cost saving from third-party maintenance versus OEM support?
Independent providers frequently deliver equivalent SLAs at 50–80% lower cost, a gap widening as OEMs shift to subscription-driven models.
Page last updated on:


