MOSFET Power Transistors Market Size and Share
Market Overview
| Study Period | 2020 - 2031 |
|---|---|
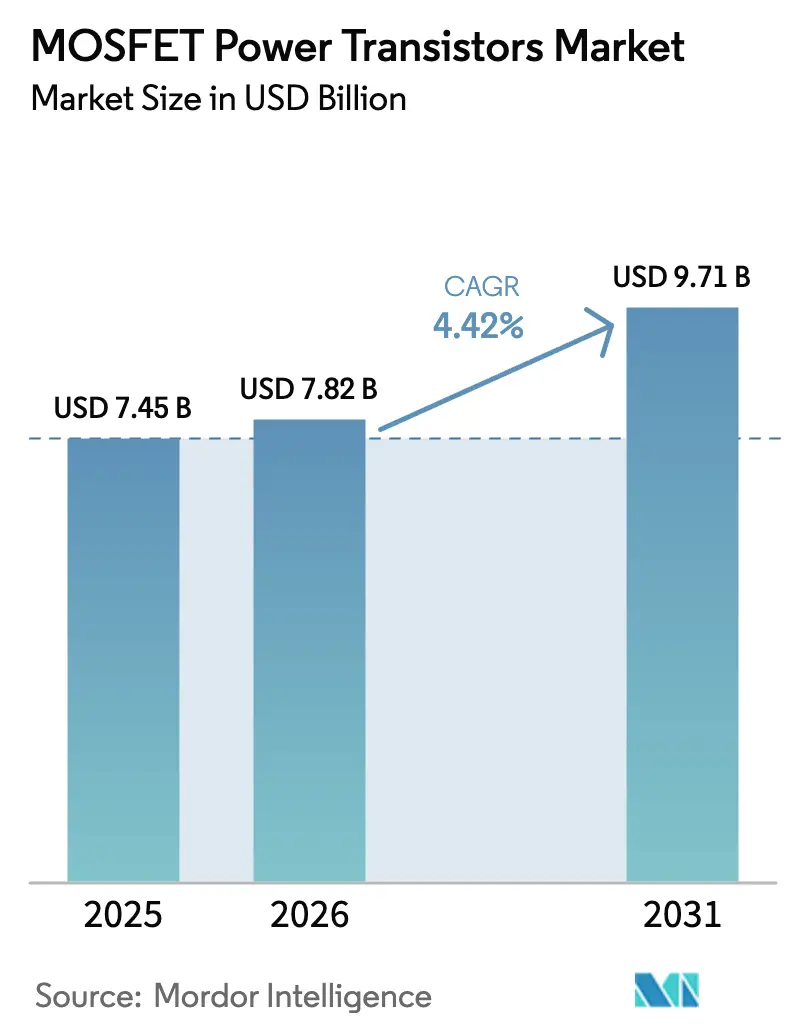
| Market Size (2026) | USD 7.82 Billion |
| Market Size (2031) | USD 9.71 Billion |
| Growth Rate (2026 - 2031) | 4.42% CAGR |
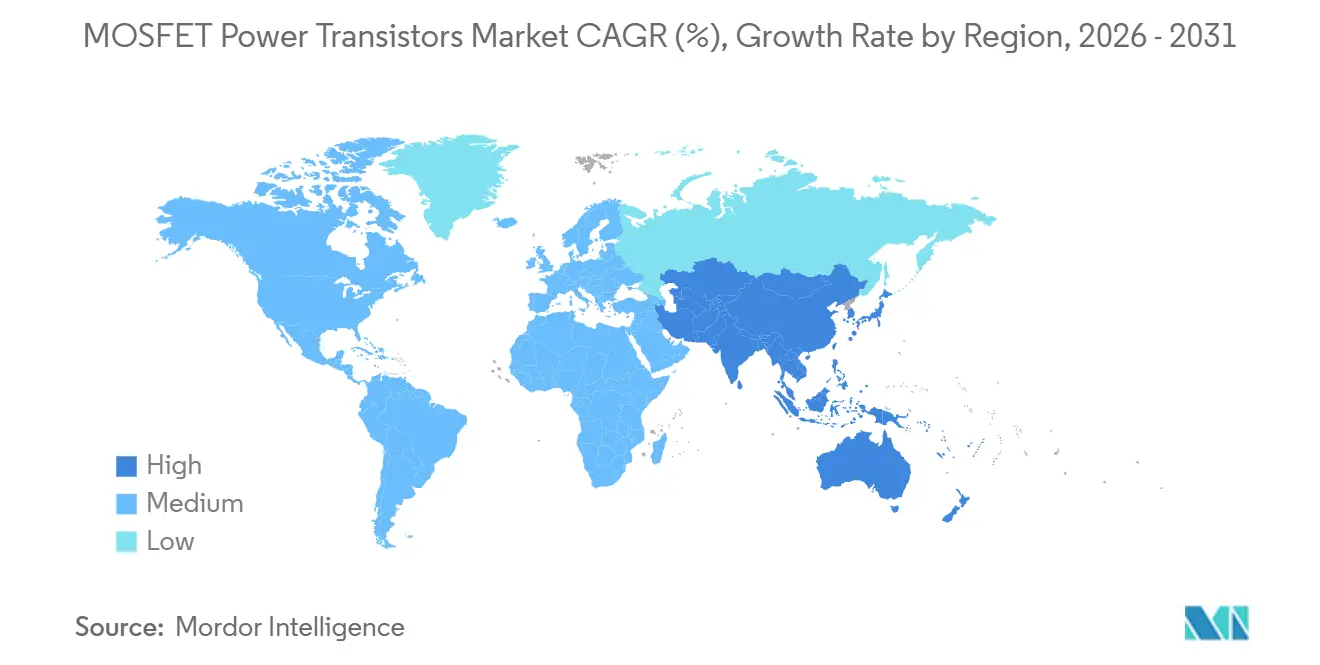
| Fastest Growing Market | Middle East |
| Largest Market | Asia Pacific |
| Market Concentration | Medium |
Major Players *Disclaimer: Major Players sorted in no particular order Image © Mordor Intelligence. Reuse requires attribution under CC BY 4.0. | |
MOSFET Power Transistors Market Analysis by Mordor Intelligence
The MOSFET power transistors market size is projected to be USD 7.45 billion in 2025, USD 7.82 billion in 2026, and reach USD 9.71 billion by 2031, growing at a CAGR of 4.42% from 2026 to 2031. Demand momentum is moving away from legacy silicon toward wide-bandgap alternatives as automotive electrification, 48 V data-center rails, and AI server power trains reset performance baselines. While consumer-electronics unit volumes are flattening, pricing discipline in specialty automotive and renewable-energy sockets is preserving value growth, and packaging innovation in wafer-level CSP is enabling ultra-thin mobile devices. Competitive behavior shows incumbents accelerating 300 mm SiC wafer transitions and fabless GaN specialists using integrated driver architectures to compress design cycles, intensifying share battles in fast-charger and cloud-computing verticals. Regulatory scrutiny of PFAS etchants is simultaneously raising compliance costs in Europe and North America, amplifying the importance of long-term chemistry supply agreements for margin security.
Key Report Takeaways
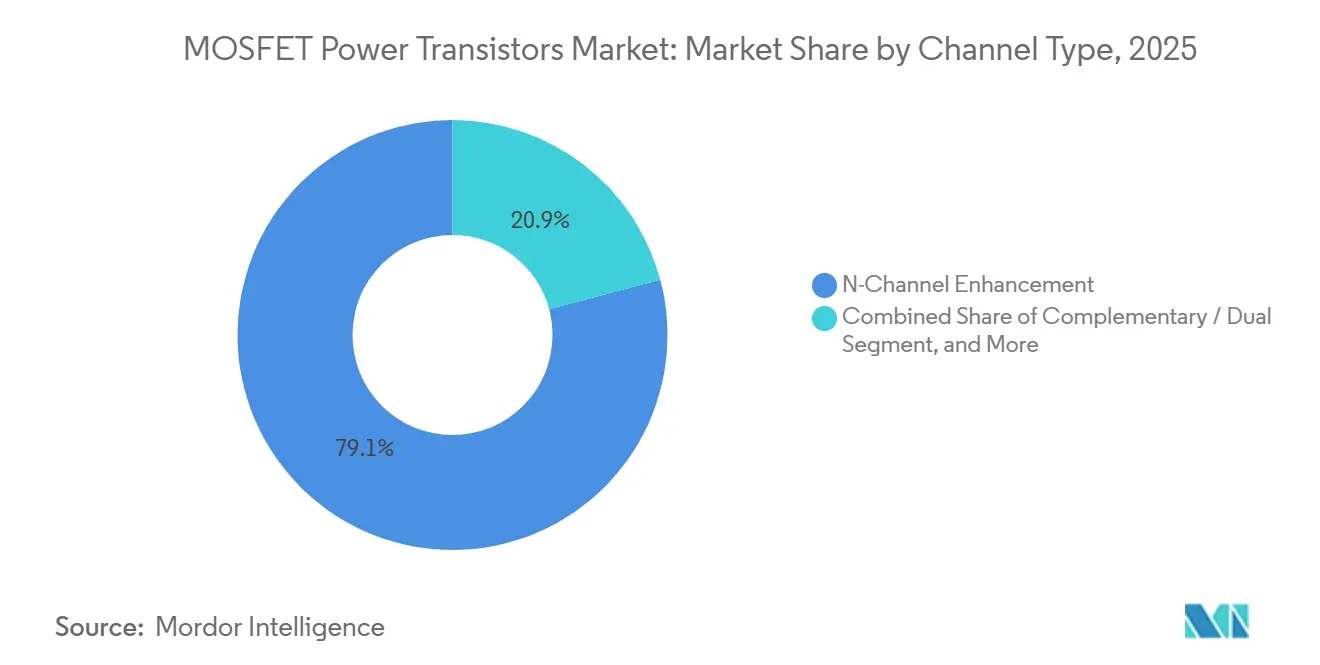
- By channel type, N-Channel enhancement devices captured 79.13% of the MOSFET power transistors market share in 2025, while complementary and dual configurations are poised to grow at a 4.58% CAGR through 2031.
- By material, silicon accounted for 68.47% of the MOSFET power transistors market in 2025, whereas gallium nitride devices are forecast to post a 5.11% CAGR over 2026-2031.
- By package type, surface-mount formats accounted for 46.49% of the MOSFET power transistors market in 2025, and wafer-level CSP solutions are projected to grow at a 6.06% CAGR through 2031.
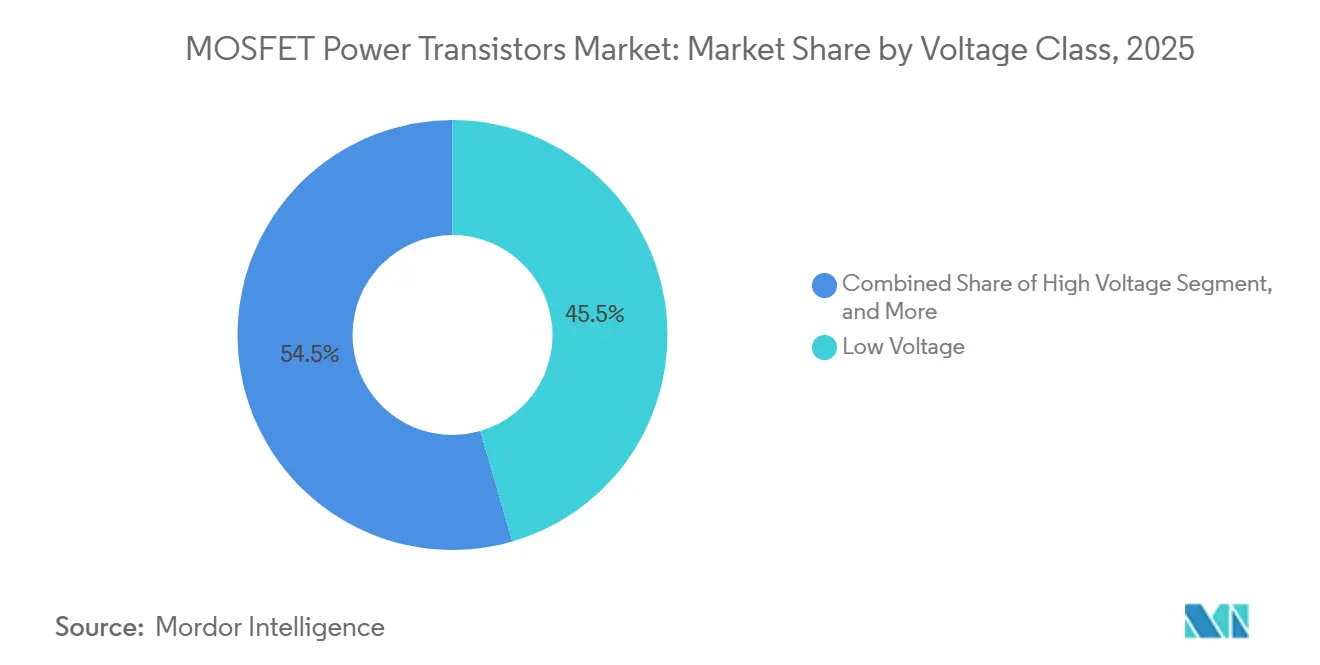
- By voltage class, low-voltage parts below 60 V commanded 45.51% of the MOSFET power transistors market share in 2025, while high-voltage devices above 600 V are set to record a 6.13% CAGR through 2031.
- By end-user industry, automotive and transportation led with 49.84% of the MOSFET power transistors market share in 2025, whereas healthcare applications are expected to grow at a 6.84% CAGR during 2026-2031.
- By geography, Asia-Pacific dominated the MOSFET power transistors market with 41.23% market share in 2025, and the Middle East is anticipated to register the highest 5.88% CAGR through 2031.
Note: Market size and forecast figures in this report are generated using Mordor Intelligence’s proprietary estimation framework, updated with the latest available data and insights as of 2026.
Global MOSFET Power Transistors Market Trends and Insights
Drivers Impact Analysis*
| Driver | (~) % Impact on CAGR Forecast | Geographic Relevance | Impact Timeline |
|---|---|---|---|
| EV-production boom elevating demand for traction and onboard-charger MOSFETs | +1.2% | Global, Asia-Pacific core with spill-over to Europe and North America | Medium term (2-4 years) |
| Renewable-energy inverter build-outs in solar and wind | +0.8% | Middle East, Asia-Pacific, Europe | Long term (≥ 4 years) |
| Explosive smartphone and wearable shipments requiring low-power MOSFETs | +0.6% | Asia-Pacific core, North America | Short term (≤ 2 years) |
| AI-server power-supply migration to high-voltage SiC/GaN stages | +0.9% | North America, Europe, Asia-Pacific hyperscale hubs | Medium term (2-4 years) |
| 48 V board-power conversions in data centers accelerating adoption of low-RDSon MOSFETs | +0.7% | North America, Europe, Asia-Pacific hyperscale hubs | Short term (≤ 2 years) |
| Vertical power-FET 3D stacking enabling high-density modules for mobility devices | +0.4% | Asia-Pacific core, North America | Long term (≥ 4 years) |
| Source: Mordor Intelligence | |||
EV-Production Boom Elevating Demand for Traction and Onboard-Charger MOSFETs
Electric-vehicle production climbed to 8.35 million traction-inverter units in the third quarter of 2025, and SiC MOSFET penetration jumped to 18% as automakers adopted 800 V battery platforms that halve cable gauge and trim charging times to below 20 minutes.[1]TrendForce, “EV Traction Inverter Shipments and SiC Penetration Analysis,” trendforce.com Premium brands are specifying 1200 V SiC devices that tolerate 175 °C junction temperature, whereas mass-market models still blend silicon super-junction switches on the power-factor-correction stage to save 15-20% material cost. Hybrid modules that co-package silicon and SiC die are therefore winning sockets at Tier 1 suppliers because supply continuity outweighs peak efficiency gains. Renesas signaled the democratization trend by launching 100V trench MOSFETs for e-bikes and light EVs in January 2025, further broadening demand beyond luxury segments. This momentum suggests a silicon-SiC duopoly through 2028, with GaN confined to 48 V auxiliary loads such as electric power steering and active suspension.
Renewable-Energy Inverter Build-Outs in Solar and Wind
Saudi Arabia earmarked USD 50 billion for 58.7 GW of renewable projects by 2030, while the UAE targets 14.2 GW of solar capacity in the same window, both of which are driving large orders for 1200 V SiC MOSFETs for utility-scale string inverters. String inverters running at 98 kHz rely on SiC to curb switching loss, yet rooftop systems below 10 kW still prefer 600 V silicon super-junction parts because the SiC premium outstrips lifetime energy savings.[2]Infineon Technologies, “OptiMOS 6 150 V MOSFET Family Product Brief,” infineon.com Onshore wind turbines under 3 MW are migrating to 1700 V SiC MOSFETs to meet the IEC 61400-21-1 harmonic limit of 2% THD, while offshore units stay with IGBT modules due to slower electrical dynamics. Hybrid solar-plus-storage arrays offer a new opportunity, as GaN’s soft reverse-recovery behavior enables single-stage bidirectional converters that eliminate 30% of the magnetics. Suppliers that bundle SiC or GaN devices with digital gate drivers are securing early design wins by shrinking inverter footprints and installation labor.
Explosive Smartphone and Wearable Shipments Requiring Low-Power MOSFETs
Magnachip’s 24 V BatteryFET, released in February 2026, delivers 5 mΩ on-resistance in a 0.6 mm square WLCSP, underscoring the push for ultra-thin power stages inside tri-fold phones and earbuds. Foldable handsets now cycle 200,000 hinge openings, so battery-management MOSFETs must dissipate minimal heat during 100 W fast-charge sessions. Texas Instruments’ FemtoFET supplies 25 A continuous current from 0.16 mm² of silicon, but the ±20 µm coplanarity tolerance of WLCSP bumps raises production rework costs by 40%, lifting the value of suppliers that prequalify board-level assembly. Specifications for mobile MOSFETs mirror those of 48 V automotive subsystems, demanding gate charge below 10 nC and avalanche-rated body diodes, so common die platforms now serve both markets. As smartwatches and AR glasses proliferate, unit demand for sub-40 V MOSFETs remains healthy even as smartphone volumes plateau.
AI-Server Power-Supply Migration to High-Voltage SiC and GaN Stages
Hyperscale operators are standardizing on 48 V rack architectures that cut copper losses by 75% compared with legacy 12 V rails, and servers hosting 1,500 W GPUs require power-supply efficiency above 96%. Infineon and NVIDIA demonstrated an 800 V supply chain in 2024 that pairs 650 V GaN devices on the front end with 100 V trench MOSFETs at the point of load to satisfy compact form-factor targets. Navitas’ GaNFast family goes further by integrating the FET, driver, and protection logic into a single QFN, halving the number of external parts and trimming design cycles from 18 to 9 months. The transition exposes a supply-chain pinch because fewer than ten fabs worldwide process 150 mm GaN epi wafers, keeping lead times near twenty weeks, so hyperscalers insist on dual-source plans that still include silicon super-junction fallbacks.[3]SEMI, “Global Fab Equipment Spending and Wafer Capacity Outlook,” semi.org Over the forecast horizon, wide-bandgap adoption in AI servers will accelerate demand for 80-100 V MOSFETs with sub-1 mΩ RDS(on), reinforcing the premium attached to integrated gate-driver solutions.
Restraints Impact Analysis*
| Restraint | (~) % Impact on CAGR Forecast | Geographic Relevance | Impact Timeline |
|---|---|---|---|
| Wide-bandgap MOSFETs’ high die and packaging costs | -0.9% | Global | Medium term (2-4 years) |
| Wafer-capacity shortages and long lead-times | -0.5% | Global, acute in Asia-Pacific and North America | Short term (≤ 2 years) |
| Non-standardized gate-driver interfaces prolonging design cycles | -0.3% | Global | Long term (≥ 4 years) |
| Carbon-footprint levies on PFAS etchants increasing production costs | -0.4% | Europe, North America | Medium term (2-4 years) |
| Source: Mordor Intelligence | |||
Wide-Bandgap MOSFETs’ High Die and Packaging Costs
SiC die cost remains five to eight times higher than silicon even after moving to 200 mm wafers, and pilot 300 mm lines will not close the gap until at least 2028-2029. Packaging compounds the premium because GaN and SiC devices need Kelvin-source layouts or embedded substrates to control ringing, adding USD 0.50-0.80 per unit at volume. Consumer appliance and power-tool makers, therefore, retain silicon unless heatsink, magnetics, and enclosure savings exceed a 3-4× delta over device cost, limiting early wide-bandgap adoption to automotive and renewable systems where efficiency is monetized. Suppliers that co-package silicon and SiC die in hybrid modules help customers stage their transition, capturing designs in the 3-10 kW band where partial SiC is economically justified. Sustained cost pressure keeps R&D focused on higher-yield substrates and simpler assembly, but material parity remains a long-term ambition rather than a near-term reality.
Wafer-Capacity Shortages and Long Lead-Times
Although silicon MOSFET lead times fell to twelve weeks in 2025, SiC and GaN wafers still face sixteen-to-twenty-week queues because fewer than ten fabs run wide-bandgap epi globally. Substrate supply worsens the squeeze, as micro-pipe defects scrap 30-40% of 4 H-SiC boules, capping effective output and sustaining USD 800-1,200 wafer prices. Fabless GaN vendors that rely on external foundries can see delivery stretch beyond twenty-four weeks, prompting OEMs to dual-qualify vertically integrated suppliers for critical automotive and server lines. Meanwhile, 150 mm silicon overcapacity keeps low-voltage MOSFET pricing soft, compressing gross margins and discouraging investment in next-generation trench topologies that might ease supply constraints. Unless fresh furnace and boule capacity ramps before 2027, persistent tightness could delay 800 V EV platform rollouts and slow hyperscale rack conversions.
*Our forecasts treat driver/restraint impacts as directional, not additive. The impact forecasts reflect baseline growth, mix effects, and variable interactions.
Segment Analysis
By Channel Type: N-Channel Leadership and Dual-Gate Momentum
N-Channel enhancement MOSFETs captured 79.13% of the MOSFET power transistors market share in 2025 because majority-carrier conduction delivers lower on-resistance for automotive traction, server VRMs, and industrial drives. Complementary pairs, although starting from a small base, advance at a 4.58% CAGR on the back of synchronous rectifiers in 48 V converters, where matched P- and N-channel timing trims prevent shoot-through. P-Channel devices remain relevant for high-side battery protection thanks to simpler gate drive, but incur a 50-70% resistance penalty that limits high-current utility.
Complementary architectures also gain favor in class-D audio and wireless-charging transmitters, where symmetric rise-fall times reduce harmonic distortion without the need for bulky LC filters. Emerging dual-gate MOSFETs, shipping in Toshiba’s 650 V SiC family, enable zero-voltage switching in flyback converters by independently tuning source- and drain-side control, cutting 20-30% of external resonant components. The MOSFET power transistors market size for N-Channel devices will keep expanding in absolute dollars even as share plateaus, while dual-gate niche volumes should double by 2031 under RF and active-clamp demand.


By Material: Silicon Scale Meets GaN Speed
Silicon retained 68.47% of the MOSFET power transistors market share in 2025, driven by 200 mm and 300 mm line maturity, sub-USD 50 wafer costs, and yield rates north of 95%. GaN expands at a 5.11% CAGR, carving out the 650 V sweet spot for fast chargers and data-center PSUs, where one-fifth the switching loss justifies a 2-3× ASP. SiC rules above 1200 V, powering traction inverters and solar strings that require 175 °C operation, while exotic gallium-oxide and diamond remain pre-commercial.
The MOSFET power transistors market for silicon persists in high-volume consumer platforms but is ceding premium sockets to wide-bandgap devices. Yet GaN’s sub-5 ns edges raise EMI levels to 50 V/ns, requiring multilayer boards with stitched ground planes, which add USD 3-5 per supply. Conversely, silicon super-junction designs like ST’s MDmesh M9 achieve 600 V and 40 mΩ at one-quarter the cost of SiC, preserving share in cost-sensitive industrial drives.
By Package Type: Surface-Mount Mainstay, WLCSP Ascendance
Surface-mount QFN and DPAK formats captured 46.49% of the MOSFET power transistors market share in 2025, as automated pick-and-place processes and <1 °C/W thermal paths meet most industrial and automotive needs. Wafer-level CSPs post a 6.06% CAGR through 2031, driven by foldable phones, earbuds, and smartwatches, where sub-1 mm stack heights are critical. Discrete TO-247 and TO-220 remain entrenched in welding and heavy-duty applications owing to their mechanical robustness, but 15-20 nH inductance caps are required for switching at 100 kHz and below.
Power modules integrate multiple dies and drivers into a single mold, easing design at a 30-40% price premium. Infineon’s 20 µm ultra-thin wafers enable vertical stacking that packs 50 A into a 3 mm-square module, opening the door to mobile fast charging. The MOSFET power transistors market tied to WLCSP is small but growing fastest, while surface-mount formats maintain a steady share, driven by automotive reliability credentials such as JEDEC temperature cycling endurance.
By Voltage Class: Low-Voltage Bulk, High-Voltage Gain
Low-voltage parts below 60 V held 45.51% of the MOSFET power transistors market share in 2025, thanks to their ubiquitous use in smartphone, laptop, and home-appliance DC-DC stages. High-voltage devices above 600 V log the highest 6.13% CAGR as 800 V traction inverters and 1200 V solar strings shift to SiC. Medium-voltage 60-600 V devices remain the workhorse of server power and LED lighting, balancing cost and performance.
The MOSFET power transistors market for high-voltage SiC units grows with each EV battery upgrade, while low-voltage silicon innovates through trench thinning, now flirting with the theoretical 0.5 mΩ·cm² limit. 100 V devices are invading 60 V slots as USB-PD 3.1 raises charger outputs to 28 V, demanding wider avalanche margin. Direct 400 V-to-48 V data-center architectures offer a long-term upside for 1700 V switches that can collapse three stages into one, yet this heightens dV/dt stress, pushing gate-oxide stacks toward SiO₂-Si₃N₄ bilayers.
By End-User Industry: Automotive Weight, Healthcare Upswing
Automotive and transportation accounted for 49.84% of the MOSFET power transistors market share in 2025, with roughly 20 devices per battery-electric vehicle across traction, DC-DC, and 48 V mild-hybrid rails. Healthcare grows at a 6.84% CAGR as portable MRI, surgical robots, and implantable pumps specify 10 nC gate-charge devices that survive autoclave sterilization. Consumer electronics rank second in absolute dollars but flatten as phone replacement cycles lengthen.
Industrial and manufacturing end users often defer wide-bandgap migration to protect 20-year machine lifetimes, while aerospace and defense remain a niche at <2% of the MOSFET power-transistor market yet command premium margins under MIL and NASA rad-hard mandates. Cross-segment convergence is evident: both 48 V automotive rails and portable diagnostic gear share demand for avalanche-rated body diodes and AEC-Q101 or IEC 60601-1 qualification, enabling suppliers to amortize platform investment.
Geography Analysis
Asia-Pacific led with 41.23% share in 2025, sustained by China’s 9.5 million EV builds, Japan’s SiC wafer fabs, and South Korea’s GaN-on-silicon lines. North America accounts for roughly one-quarter of the MOSFET power transistors market, driven by hyperscale data centers and CHIPS Act incentives, yet domestic SiC substrate capacity remains limited to Wolfspeed, creating supply-chain fragility. Europe sits near 20-25%, anchored by German automotive Tier 1s and French SiC operations, but faces elevated energy prices and looming PFAS levies that inflate local processing costs.
The Middle East is the fastest riser, with a 5.88% CAGR, as Saudi NEOM and UAE solar-plus-storage programs demand tens of millions of high-voltage switches annually, though the region imports nearly all semiconductors. South America and Africa together remain below 10%, hampered by sparse fab infrastructure. Geopolitical divergence is crystallizing: U.S. export rules limit China’s sub-28 nm gate-driver nodes, while Europe’s carbon-border measure penalizes coal-fired SiC wafer output, nudging capacity toward Japan and South Korea.
Regional qualification hurdles compound delays. Chinese GB/T standards, European AEC-Q101, and Japanese JIS each impose separate reliability gauntlets, extending cross-border launch cycles by six to nine months. To hedge, major suppliers pursue parallel supply routes, commissioning substrate in the United States, Germany, and Malaysia, then dicing and assembly in Vietnam or Mexico, balancing tariff exposure with labor economics.

Competitive Landscape
Roughly 50-55% of the MOSFET power transistors market is held by the top five vendors: Infineon Technologies, STMicroelectronics, ON Semiconductor, Texas Instruments, and Toshiba. These majors defend their share through vertical SiC substrate production, 300 mm line migrations, and multi-year automotive LTAs that lock in price and allocation. GaN specialists GaN Systems, Navitas Semiconductor, EPC, and Transphorm win designs for fast chargers and 48 V boards by integrating drivers and protection, trimming component counts by 40% and halving design schedules.
Incumbents are adopting advanced co-simulation tool chains that seamlessly integrate SPICE, thermal, and electromagnetic (EM) models. This strategic approach enables original equipment manufacturers (OEMs) to achieve early-stage validation and secure critical sockets 12-18 months ahead of competitors who rely solely on datasheet-based solutions. A significant growth opportunity is emerging in the development of hybrid modules that co-package silicon (Si) and silicon carbide (SiC). These innovative modules are designed to optimize the trade-off between cost and efficiency at each stage, with particular relevance in the 3-10 kW solar energy market and industrial uninterruptible power supply (UPS) racks.
Financial barriers are steep: Wolfspeed’s workforce cutbacks and fab delays underline the USD 1-1.5 billion up-front requirement for a 200 mm SiC facility and protracted 24-36 month yield learning before 30% gross margins. Fabless challengers thus rely on foundry access; any slip in TSMC or Samsung schedules can stretch lead times to 24 weeks and forfeit design slots. The Open Compute Project now shapes server power specifications, and vendors presenting reference boards grab mindshare well before the standard freezes, exemplified by Infineon’s OptiMOS 6 adoption across 48 V racks.
MOSFET Power Transistors Industry Leaders
Texas Instruments Incorporated
NXP Semiconductors N.V.
Analog Devices, Inc.
Broadcom Inc.
Microchip Technology Incorporated
- *Disclaimer: Major Players sorted in no particular order


Recent Industry Developments
- February 2026: Magnachip Semiconductor launched a 24 V BatteryFET for tri-fold smartphone hinges, enabling 100 W USB-PD fast charging in a 0.6 mm × 0.6 mm WLCSP.
- August 2025: Toshiba Corporation announced 650 V third-generation SiC MOSFETs in TOLL, integrating a Schottky body diode that lifts light-load efficiency by 3-4 points.
- July 2025: Toshiba Corporation launched SOP Advance(E) surface-mount packaging, replacing bond wires with copper clips to cut inductance from 2 nH to 0.7 nH.
- February 2025: Infineon Technologies rolled out CoolSiC 650 V Generation 2 MOSFETs in Q-DPAK and TOLL, posting 30% lower switching loss than silicon super-junction peers.


Global MOSFET Power Transistors Market Report Scope
The MOSFET Power Transistors Market Report is Segmented by Channel Type (N-Channel, P-Channel, Complementary/Dual), Material (Silicon, Silicon-Carbide (SiC), Gallium-Nitride (GaN), Other Materials), Package Type (Discrete, Surface-Mount, Power Modules, Wafer-Level CSP, Other Package Types), Voltage Class (Low Voltage, Medium Voltage, High Voltage), End-User Industry (Automotive and Transportation, Consumer Electronics, Industrial and Manufacturing, Healthcare, Aerospace and Defense, Other End-User Industries), and Geography (North America, South America, Europe, Asia-Pacific, Middle East, Africa). The Market Forecasts are Provided in Terms of Value (USD).
| N-Channel |
| P-Channel |
| Complementary / Dual |
| Silicon |
| Silicon-Carbide (SiC) |
| Gallium-Nitride (GaN) |
| Other Materials |
| Discrete (TO-247 / TO-220) |
| Surface-Mount (DPAK, QFN) |
| Power Modules |
| Wafer-Level CSP |
| Other Package Types |
| Low Voltage |
| Medium Voltage |
| High Voltage |
| Automotive and Transportation |
| Consumer Electronics |
| Industrial and Manufacturing |
| Healthcare |
| Aerospace and Defense |
| Other End-User Industries |
| North America | United States |
| Canada | |
| Mexico | |
| South America | Brazil |
| Argentina | |
| Rest of South America | |
| Europe | Germany |
| United Kingdom | |
| France | |
| Italy | |
| Spain | |
| Rest of Europe | |
| Asia-Pacific | China |
| India | |
| Japan | |
| South Korea | |
| Australia and New Zealand | |
| Rest of Asia-Pacific | |
| Middle East | Saudi Arabia |
| United Arab Emirates | |
| Turkey | |
| Rest of Middle East | |
| Africa | South Africa |
| Nigeria | |
| Egypt | |
| Rest of Africa |
| By Channel Type | N-Channel | |
| P-Channel | ||
| Complementary / Dual | ||
| By Material | Silicon | |
| Silicon-Carbide (SiC) | ||
| Gallium-Nitride (GaN) | ||
| Other Materials | ||
| By Package Type | Discrete (TO-247 / TO-220) | |
| Surface-Mount (DPAK, QFN) | ||
| Power Modules | ||
| Wafer-Level CSP | ||
| Other Package Types | ||
| By Voltage Class | Low Voltage | |
| Medium Voltage | ||
| High Voltage | ||
| By End-User Industry | Automotive and Transportation | |
| Consumer Electronics | ||
| Industrial and Manufacturing | ||
| Healthcare | ||
| Aerospace and Defense | ||
| Other End-User Industries | ||
| By Geography | North America | United States |
| Canada | ||
| Mexico | ||
| South America | Brazil | |
| Argentina | ||
| Rest of South America | ||
| Europe | Germany | |
| United Kingdom | ||
| France | ||
| Italy | ||
| Spain | ||
| Rest of Europe | ||
| Asia-Pacific | China | |
| India | ||
| Japan | ||
| South Korea | ||
| Australia and New Zealand | ||
| Rest of Asia-Pacific | ||
| Middle East | Saudi Arabia | |
| United Arab Emirates | ||
| Turkey | ||
| Rest of Middle East | ||
| Africa | South Africa | |
| Nigeria | ||
| Egypt | ||
| Rest of Africa | ||


Key Questions Answered in the Report
How large is the MOSFET power transistors market expected to be by 2031?
The MOSFET power transistors market is forecast to reach USD 9.71 billion by 2031.
Which segment is growing fastest within the voltage classes?
High-voltage devices above 600 V show the quickest 6.13% CAGR on the shift to 800 V EV platforms and 1200 V solar strings.
Why is GaN adoption accelerating in data-center power supplies?
GaN’s lower switching loss and integrated drivers raise 48 V converter efficiency above 96%, meeting hyperscaler energy targets.
What restraint most limits wide-bandgap MOSFET penetration?
High die and packaging costs keep SiC prices 5-8 times silicon, delaying adoption in cost-sensitive appliances and tools.
Which region offers the highest growth potential through 2031?
The Middle East leads growth at 5.88% CAGR as massive data-center and solar investments demand high-efficiency power stages.
How concentrated is supplier power in this market?
The top five vendors hold a bit more than half of global revenue, reflecting moderate concentration with space for GaN specialists.
Page last updated on:


