Market Overview
| Study Period | 2020 - 2031 |
|---|---|
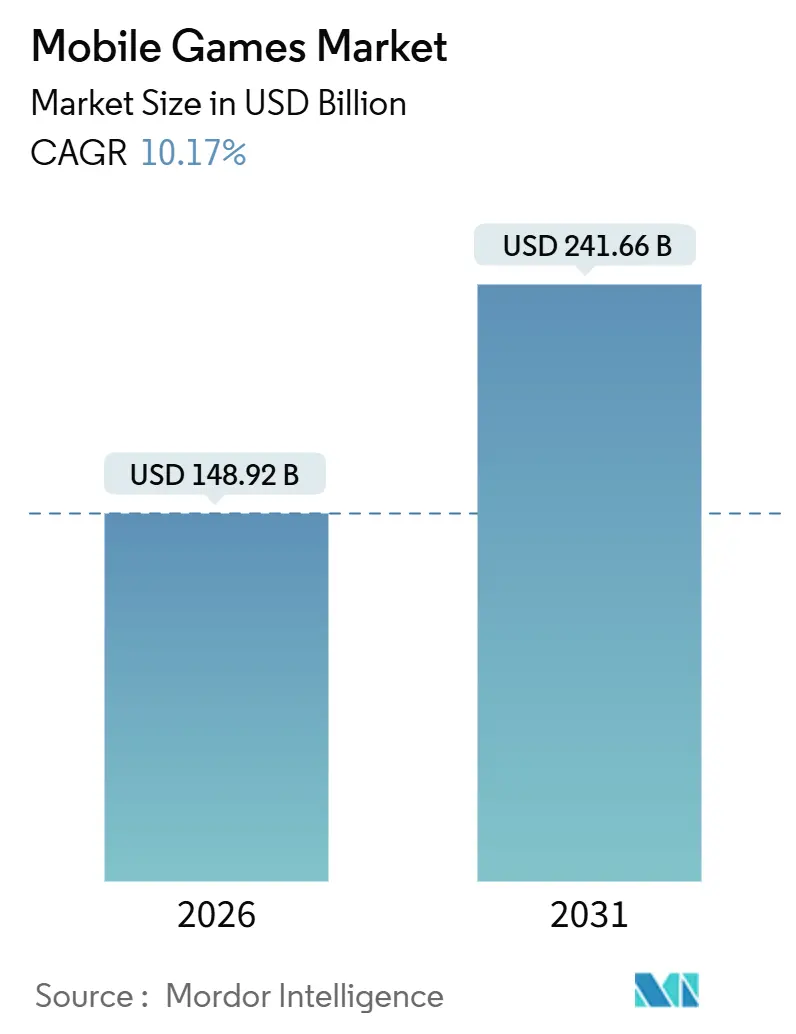
| Market Size (2026) | USD 148.92 Billion |
| Market Size (2031) | USD 241.66 Billion |
| Growth Rate (2026 - 2031) | 10.17% CAGR |
| Fastest Growing Market | Asia Pacific |
| Largest Market | Asia Pacific |
| Market Concentration | Medium |
Major Players *Disclaimer: Major Players sorted in no particular order Image © Mordor Intelligence. Reuse requires attribution under CC BY 4.0. | |
Mobile Games Market Analysis by Mordor Intelligence
The mobile games market size stood at USD 148.92 billion in 2026 and is projected to reach USD 241.66 billion by 2031, recording a 10.17% CAGR. Expanding 5G coverage is lowering latency below 20 milliseconds, which is unlocking real-time multiplayer play and converting casual smartphone owners into committed gamers. Telco-bundled cloud libraries are widening paid access in emerging economies, while generative artificial intelligence is compressing live-ops production cycles and lifting 30-day retention rates above historical norms. Subscription passes and hybrid monetization are diluting single-purchase dependency, and foldable handsets are redefining premium on-the-go experiences. Competitive intensity remains high as mid-tier studios use AI automation to match update cadences previously reserved for the largest publishers.
Key Report Takeaways
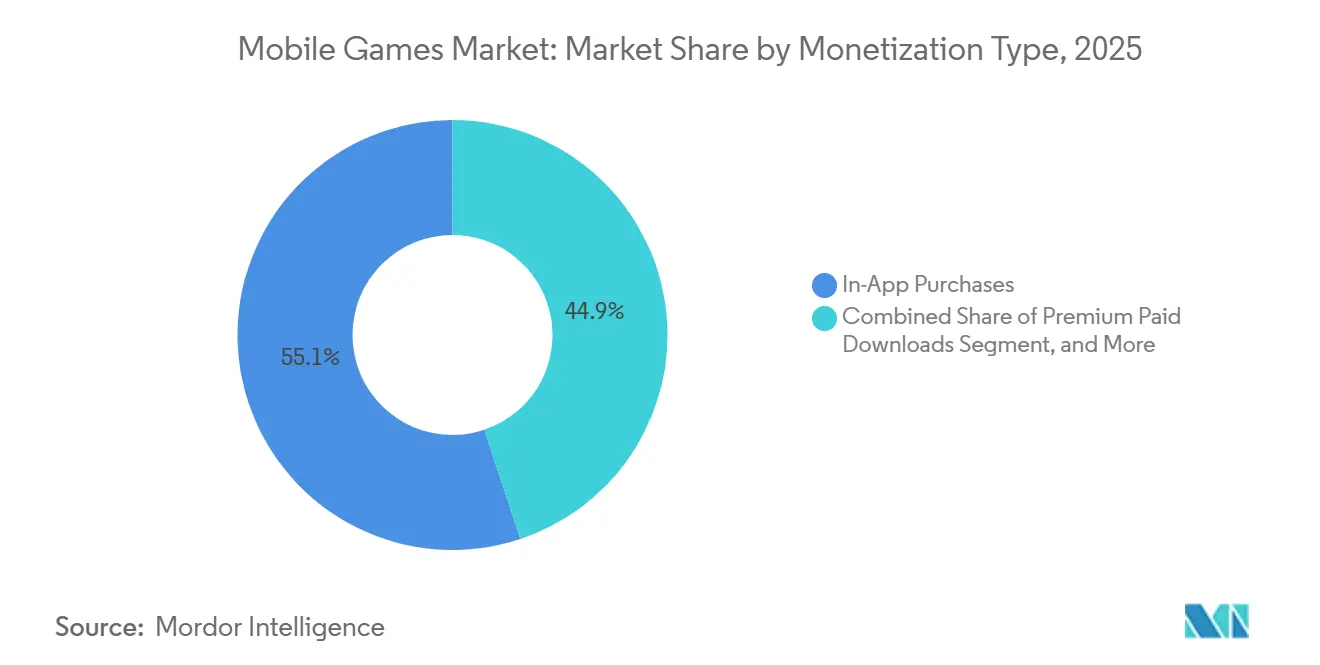
- By monetization type, in-app purchases led with 55.13% of the mobile games market share in 2025, while subscriptions and season passes are forecast to advance at an 18.42% CAGR to 2031.
- By platform, Android held 71.32% revenue share in 2025, whereas cloud streaming and progressive web apps are expanding at a 40.21% CAGR through 2031.
- By device, smartphones accounted for 83.67% of the mobile games market size in 2025 and foldables are set to grow at a 27.56% CAGR between 2026-2031.
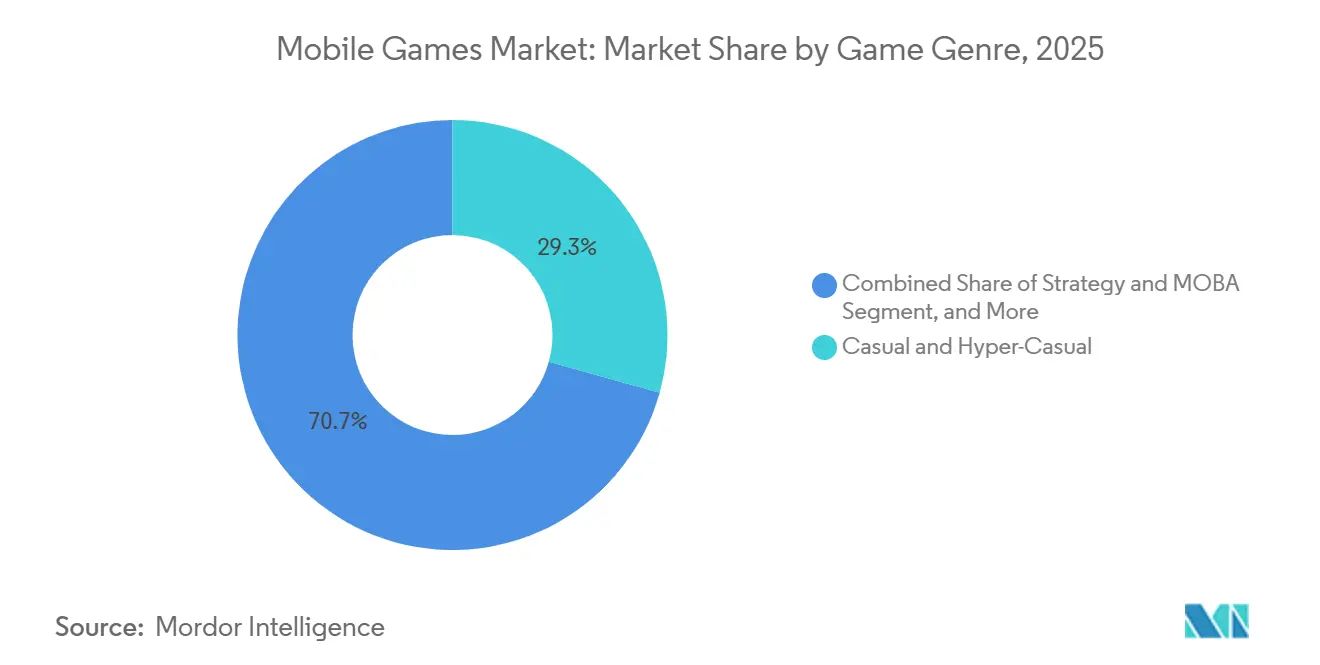
- By genre, casual and hyper-casual titles commanded 29.32% of the mobile games market size in 2025, while strategy and MOBA games are on track for a 15.71% CAGR to 2031.
- By geography, Asia Pacific led with 49.23% revenue share in 2025, whereas Africa is positioned for the fastest 12.51% CAGR through 2031.
Note: Market size and forecast figures in this report are generated using Mordor Intelligence’s proprietary estimation framework, updated with the latest available data and insights as of January 2026.
Global Mobile Games Market Trends and Insights
Drivers Impact Analysis*
| Driver | (~) % Impact on CAGR Forecast | Geographic Relevance | Impact Timeline |
|---|---|---|---|
| 5G Roll-outs Lowering Latency | +2.1% | Global, with early gains in South Korea, China, United States | Medium term (2-4 years) |
| Contextual-First Advertising Revenues Post-IDFA | +1.8% | North America and Europe, spill-over to Asia Pacific | Short term (≤ 2 years) |
| Telco-Led Cloud Gaming Bundles Stimulating ARPDAU | +2.3% | Asia Pacific core, expanding to Middle East and Africa | Medium term (2-4 years) |
| Gen-Z Preference for Hyper-Casual Gameplay | +1.5% | Global, with concentration in North America, Europe, Asia Pacific | Long term (≥ 4 years) |
| AI-Generated Live-Ops Content Boosting Retention | +1.9% | Global, led by North America and Asia Pacific studios | Short term (≤ 2 years) |
| Cross-Platform Progression Increasing LTV | +1.6% | North America and Europe, expanding to Asia Pacific | Medium term (2-4 years) |
| Source: Mordor Intelligence | |||
5G Roll-Outs Lowering Latency
Standalone 5G cores separate control and user planes, driving sub-20 millisecond ping that rivals wired consoles.[1]Ericsson, “Ericsson Mobility Report June 2025,” ericsson.com In 2025, global 5G subscriptions passed 1.9 billion, and operators in South Korea and China began selling gaming-grade network slices to premium subscribers. Smartphone chipsets such as Snapdragon Elite Gaming exploit this bandwidth, ensuring stable 120 frame-per-second play. As a result, esports-ready titles that once required a PC now launch simultaneously on mobile, broadening the mobile games market to competitive segments. Publishers consequently unlock sponsorship and event revenues that were formerly confined to console ecosystems.
Telco-Led Cloud Gaming Bundles Stimulating ARPDAU
Operators including Reliance Jio and Vodafone add curated game libraries to data plans, pushing cloud libraries to more than 50 million monthly active users in India alone. These bundles remove multi-gigabyte downloads, sidestep app-store commissions, and raise average revenue per daily active user by 22%. Ericsson ConsumerLab showed that 40% of cloud gamers in Southeast Asia rely solely on operator portals. For publishers, the model extends the mobile games market into price-sensitive audiences, while telcos monetize fixed assets more efficiently. As the approach spreads across Middle East and Africa, incremental ARPDAU uplift is expected to compound revenue growth.
AI-Generated Live-Ops Content Boosting Retention
Large language models fine-tuned for game design now create quests, seasonal challenges, and dialogue in days rather than weeks. Unity’s 2025 survey reported a 40% cut in live-ops production time and an 8-12-percentage-point lift in 30-day retention after AI adoption. The lowered content cadence barrier allows mid-tier studios to rival top publishers, intensifying competition and supporting steady expansion of the mobile games market. For free-to-play titles, each retention-point gain expands lifetime value by roughly one-quarter, reinforcing investment in automated pipelines.
Contextual-First Advertising Revenues Post-IDFA
Apple’s privacy framework removed device-level identifiers for most iOS users, spiking performance-marketing costs. Publishers pivoted to in-game behavioral signals, rewarded videos, and playable ads, which now convert 30% better than traditional interstitials. Google’s Privacy Sandbox for Android follows a similar path, standardizing on-device ad matching. Contextual approaches reduce reliance on giant acquisition budgets and have widened access for smaller studios, diversifying the mobile games market even as effective CPM rates edge lower.
Restraints Impact Analysis*
| Restraint | (~) % Impact on CAGR Forecast | Geographic Relevance | Impact Timeline |
|---|---|---|---|
| Country-Level Loot-Box Regulations Dampening IAP | -1.4% | Europe (Belgium, Netherlands), expanding to United Kingdom, Australia | Medium term (2-4 years) |
| Rising User Acquisition CPI on iOS | -1.6% | North America and Europe, moderate impact in Asia Pacific | Short term (≤ 2 years) |
| App-Store Tax Policy Uncertainty | -0.9% | Global, with acute impact in United States, European Union | Long term (≥ 4 years) |
| High 5G Device Battery Drain Limiting Session Length | -0.7% | Global, concentrated in markets with high 5G penetration | Medium term (2-4 years) |
| Source: Mordor Intelligence | |||
Country-Level Loot-Box Regulations Dampening IAP
Belgium and the Netherlands classify loot boxes as gambling, prompting publishers to strip random-reward mechanics or exit those storefronts. The United Kingdom and Australia are drafting similar controls that could widen compliance costs. Electronic Arts removed paid packs from its flagship sports titles in the affected markets, losing 12% ARPU in the first year. The clampdown accelerates shifts toward battle passes and cosmetic microtransactions, yet near-term friction trims the mobile games market growth by 1.4 percentage points within the forecast window.
Rising User Acquisition CPI on iOS
App Tracking Transparency lifted average North American mid-core CPI to USD 3.80, 45% above 2023 benchmarks, while Android held near USD 2.10. Despite higher iOS lifetime value, budget reallocation toward Android and influencer channels signals a permanent shift. AppLovin logged an 18% retreat in iOS ad volumes during 2025, illustrating the squeeze. Heightened acquisition expense slows portfolio expansion and drags on the overall mobile games market CAGR until alternative targeting methods fully mature.
*Our forecasts treat driver/restraint impacts as directional, not additive. The impact forecasts reflect baseline growth, mix effects, and variable interactions.
Segment Analysis
By Monetization Type: Subscriptions Reshape Revenue Mix
In 2025, in-app purchases generated 55.13% of mobile games market revenue, but subscriptions and season passes are pacing for the highest 18.42% CAGR through 2031. The pivot responds to player fatigue with unpredictable spending and to growing scrutiny over random rewards. Publishers such as Epic Games now bundle cosmetics, in-game currency, and premium events into monthly passes that secure recurring cash flow. Hybrid models that layer optional purchases over a base subscription uplift lifetime value by roughly 40%, creating a powerful lever for revenue diversification within the mobile games market.
The strategic impact extends beyond direct earnings. Predictable subscription income enables steadier content investment and cushions against advertising cyclicality. As regulators tighten loot-box rules, transparent fee structures lower legal exposure. With Gen Z players favoring fixed costs, the momentum behind subscription schemes is likely to accelerate, embedding the model as a core pillar of the mobile games industry by the decade’s close.


By Platform: Cloud Streaming Disrupts Download Dominance
Android accounted for 71.32% of 2025 spend, reflecting its ubiquity in high-volume emerging regions. Yet a fast-rising platform class (cloud streaming and progressive web apps) holds less than 2% today and is forecast for a 40.21% CAGR to 2031. Telcos that bundle low-latency libraries into premium data plans are bypassing gatekeeper stores and 30% commissions, a dynamic that reshapes distribution economics and enlarges the mobile games market in previously under-monetized territories.
Microsoft, Nvidia, and Alphabet report that mobile devices now drive more than one-third of total cloud-gaming hours, evidence that the market is ready for download-free access. As mature networks reduce buffering, graphically intensive console titles become playable on handsets, drawing new demographics into premium content. The shift also mitigates storage constraints and long install times that have historically suppressed user conversion.
By Device Type: Foldables Unlock Premium Experiences
Smartphones captured 83.67% of revenue in 2025 and remain the workhorse of the mobile games market. Foldable handsets, however, are set for a robust 27.56% CAGR into 2031. Dual-screen modes let players keep controls on the outer display while gameplay unfolds on the interior panel, widening field of view without added peripherals. High-end chipsets provide console-like visuals, and average selling prices above USD 1,200 signal a premium audience receptive to exclusive content drops.
Tablets, holding roughly 14% share, retain appeal for strategy and simulation. Yet improving foldable durability and falling prices suggest that many future tablet gamers will carry a single foldable device instead. Publishers are already crafting adaptive user interfaces that exploit larger unfolded real estate, further reinforcing the segment’s upside.
By Game Genre: Strategy Titles Capture Esports Momentum
Casual and hyper-casual titles led the mobile games market size at 29.32% in 2025 thanks to viral mechanics and ad-supported monetization. Looking forward, strategy and MOBA games are set to post a 15.71% CAGR as tournament prize pools swell and live-streamed events convert viewers to players. Honor of Kings, for example, recorded more than USD 2 billion in 2024 revenue while sustaining daily users above 100 million.[2]Tencent, “Financial Reports 2024,” tencent.com
Esports infrastructure lowers acquisition costs by harnessing influencer reach. Meanwhile, casual segments continue generating dependable ad revenue due to their broad base. The genre mix thus balances high-volume, low-spend users with a rising cadre of competitive spenders, enhancing overall resilience in the mobile games market.
By Player Demographic: Gen Z Drives Engagement Metrics
Gen Z accounted for 43.63% of 2025 revenue and will expand at a 12.37% CAGR through 2031. Their preference for short, socially integrated play propels hyper-casual and snackable competitive formats, raising daily session frequency by 50% above Millennial averages. Millennials and Gen X sustain higher per-user spend through subscriptions and deeper progression arcs, offering a complementary revenue tier.
Cross-platform progression resonates across age groups by preserving cosmetic investments irrespective of device. Epic Games reports that synchronized inventories reduce churn in multi-device households, cementing loyalty and fortifying the mobile games market against platform migration risk.
Geography Analysis
Asia Pacific produced 49.23% of global revenue in 2025, anchored by China’s resumed game license approvals and India’s explosive smartphone adoption. Chinese regulators cleared more than 1,000 domestic mobile titles in 2024, unlocking pent-up launch pipelines. Meanwhile, India surpassed 450 million gamers, driven by sub-USD 100 handsets and unlimited data bundles at USD 3 per month.[3]GSMA, “Mobile Economy Asia Pacific 2025,” gsma.com Mature spenders in Japan and South Korea lift per-user averages above USD 80, balancing lower-priced mass markets across Southeast Asia.
North America and Europe combined for roughly a 35% share, with the United States remaining the largest single-country contributor. However, divergent European loot-box rules raise compliance burdens, prompting publishers to regionalize monetization mechanics and content. Cloud gaming adoption is high, reflecting households with multiple devices that value seamless migration between console and mobile.
Africa, the fastest-growing region with a 12.51% CAGR, benefits from mobile-money ecosystems that process more than USD 700 billion annually. Carrier billing allows prepaid users to spend within games without bank accounts, broadening the mobile games market beyond traditional financial rails. Middle Eastern youth demographics and sovereign digital-economy investments further amplify regional growth potential, while South America offers resilience through low-cost entertainment demand despite currency volatility.


Competitive Landscape
The top ten publishers accounted for a major share of 2025 revenue, indicating a moderately concentrated field in which incumbents leverage IP depth and vertical ecosystems. Tencent and NetEase integrate games with social and payment services, reinforcing network effects that are difficult for Western rivals to imitate. Activision Blizzard and Electronic Arts port flagship console franchises to mobile, using cross-platform progression to extend lifetime value.
Mid-tier studios counterbalance scale advantages through AI-generated content pipelines that slash costs by up to 45%. Technical arms races now center on procedural design, predictive churn analytics, and cloud delivery rather than pure marketing spend. Blockchain-enabled item ownership remains a niche amid regulatory uncertainty, but it signals long-term potential for decentralized economies.
Strategic partnerships between publishers and telcos are reshaping distribution economics, as evidenced by Tencent’s WeChat Mini Games tie-up with Vodafone across Europe. Investments in regional studios, such as Krafton’s USD 150 million Indian funding program, underscore growing localization requirements. The evolving landscape compels incumbents and challengers alike to blend creative innovation with infrastructure expertise to maintain share in the expanding mobile games market.
Mobile Games Industry Leaders
Tencent Holdings Ltd.
NetEase Inc.
Activision Blizzard Inc.
Electronic Arts Inc.
Nintendo Co., Ltd.
- *Disclaimer: Major Players sorted in no particular order

Recent Industry Developments
- December 2025: Tencent partnered with Vodafone to preload WeChat Mini Games across ten European markets, offering more than 200 titles inside monthly data plans.
- November 2025: Bladepoint Mobile globally, achieving 20 million downloads within two weeks and enabling cross-platform progression.
- October 2025: Electronic Arts introduced USD 1 million prize pools in EA Sports FC Mobile tournaments, paying winners through Visa-linked mobile wallets.
- September 2025: Krafton pledged USD 150 million to invest in Indian studios creating locally themed content for regional audiences.


Research Methodology Framework and Report Scope
Market Definitions and Key Coverage
Our study defines the mobile games market as all gross consumer and advertising revenues earned by games purpose-built for smartphones and tablets, whether acquired through official app stores or sanctioned third-party Android stores. Revenues include in-app purchases, rewarded or interstitial ads, season passes, premium downloads, and game-linked subscriptions; they are recorded in US dollars at the point of spend and allocated to the geography where the user transacts.
Scope Exclusions: Hardware sales, console/PC editions, real-money gambling apps, esports media rights, and cloud-gaming fees billed outside a mobile storefront are excluded.
Segmentation Overview
- By Monetization Type
- In-App Purchases
- Subscription and Season Passes
- Advertising (Rewarded Video, Interstitial, Native)
- Premium Paid Downloads
- By Platform
- Android
- iOS
- Third-Party Android Stores
- Cloud Streaming / Progressive Web App
- By Device Type
- Smartphones
- Foldable Smartphones
- Tablets
- By Game Genre
- Casual and Hyper-Casual
- Action / Adventure
- Strategy and MOBA
- Role-Playing (RPG)
- Sports and Racing
- Casino and Card
- Puzzle
- Simulation
- By Player Demographic
- Gen Z (Below 25 Years)
- Millennials (25-40 Years)
- Gen X and Above (Over 40 Years)
- By Geography
- North America
- United States
- Canada
- Mexico
- South America
- Brazil
- Argentina
- Rest of South America
- Europe
- Germany
- United Kingdom
- France
- Italy
- Spain
- Russia
- Rest of Europe
- Asia Pacific
- China
- Japan
- South Korea
- India
- Australia
- New Zealand
- Rest of Asia Pacific
- Middle East
- United Arab Emirates
- Saudi Arabia
- Turkey
- Rest of Middle East
- Africa
- South Africa
- Nigeria
- Kenya
- Rest of Africa
- North America
Detailed Research Methodology and Data Validation
Primary Research
Mordor analysts conduct structured calls with game publishers, ad-monetization networks, telecom operators, and payment-gateway integrators across Asia-Pacific, North America, Europe, and key emerging markets. These discussions validate pay-rate ranges, ad-load ceilings, and forecast sentiment, and they clarify gray-channel download volumes that public data ignore.
Desk Research
We screen open datasets from bodies such as the GSMA, national telecom regulators, and UN Comtrade for smartphone penetration, mobile broadband tariffs, and handset imports. App usage and payment ratios are benchmarked with quarterly dashboards from sources such as Data.ai, Statista Digital Economy, and national game trade associations, while publisher earnings are tracked through SEC 10-Ks and regional exchange filings. Complementary insight is drawn from news archives on Dow Jones Factiva and company intelligence on D&B Hoovers. The sources listed illustrate, not exhaust, the reference pool consulted by analysts.
A second sweep gathers policy notes (app-store fee rulings, loot-box directives), patent abstracts from Questel, and advertising CPM series released by the Interactive Advertising Bureau, giving context for pricing and risk assumptions.
Market-Sizing & Forecasting
A top-down model starts with active smartphone counts, applies observed gamer penetration and payer ratios, and multiplies by average spend per payer plus ad ARPU to reconstruct 2024 revenue. Selective bottom-up checks, publisher roll-ups, and sampled average selling price times volume stress-test totals before finalizing. Variables tracked include 5G user share, average mobile data cost, genre-level session length, exchange-rate shifts, and regulatory fee caps, each forecast through multivariate regression supported by expert consensus. Scenario analysis handles gaps in emerging markets where official spend data lag.
Data Validation & Update Cycle
Outputs pass variance checks against third-party billings and historical CAGR envelopes, then undergo a two-step peer review. We refresh models annually, triggering mid-cycle updates when platform-fee or currency shocks exceed predefined thresholds so clients always receive a current baseline.
Why Mordor's Mobile Gaming Baseline Commands Reliability
Published estimates often differ because firms pick distinct revenue buckets, convert currencies on varied dates, or stretch forecasts without revisiting pay-rate realities.
Key gap drivers include (a) inclusion of hybrid streaming or PC cross-play revenues outside our mobile scope, (b) use of gross store billings before platform fees, and (c) sporadic refresh cadences that miss post-pandemic demand resets.
By centering on device-level spend signals and re-checking each major variable yearly, Mordor delivers a balanced, transparent figure that decision-makers can retrace.
Benchmark comparison
| Market Size | Anonymized source | Primary gap driver |
|---|---|---|
| USD 135.06 B (2025) | Mordor Intelligence | - |
| USD 157.60 B (2025) | Global Consultancy A | Counts all advertising linked to cloud and console companion apps |
| USD 100.58 B (2024) | Industry Publisher B | Excludes rewarded-video ad revenue and third-party Android stores |
| USD 194.14 B (2021) | Trade Journal C | Blends mobile games with wider digital entertainment streams |
In sum, the disciplined variable selection, annual refresh, and dual validation steps used by Mordor Intelligence yield a dependable starting point that avoids scope creep while staying attuned to fast-shifting mobile gamer behavior.


Key Questions Answered in the Report
How big is the mobile games market today and where is it heading by 2031?
The mobile games market size reached USD 148.92 billion in 2026 and is expected to climb to USD 241.66 billion by 2031 at a 10.17% CAGR.
Which monetization model is growing the fastest in mobile gaming?
Subscriptions and season passes are forecast to rise at an 18.42% CAGR through 2031, outpacing in-app purchases and advertising.
Why are telcos becoming important distribution partners for mobile games?
Bundled cloud libraries integrated into mobile data plans remove downloads, cut acquisition costs, and raise average revenue per daily active user by more than 20%.
What impact do loot-box regulations have on revenue growth?
Countries banning or restricting random rewards reduce in-app purchase conversion by 15-20%, trimming aggregate CAGR growth by about 1.4 percentage points in affected regions.
Which device segment offers the highest growth potential after smartphones?
Foldable smartphones are projected for a 27.56% CAGR to 2031 as dual-screen mechanics attract premium spenders and console-quality graphics migrate to handheld form factors.
Which region is expanding the quickest in mobile gaming?
Africa leads with a 12.51% forecast CAGR, aided by mobile-money integration that enables microtransactions without traditional banking services.
Page last updated on:


