Military Amphibious Vehicle Market Size and Share
Market Overview
| Study Period | 2020 - 2031 |
|---|---|
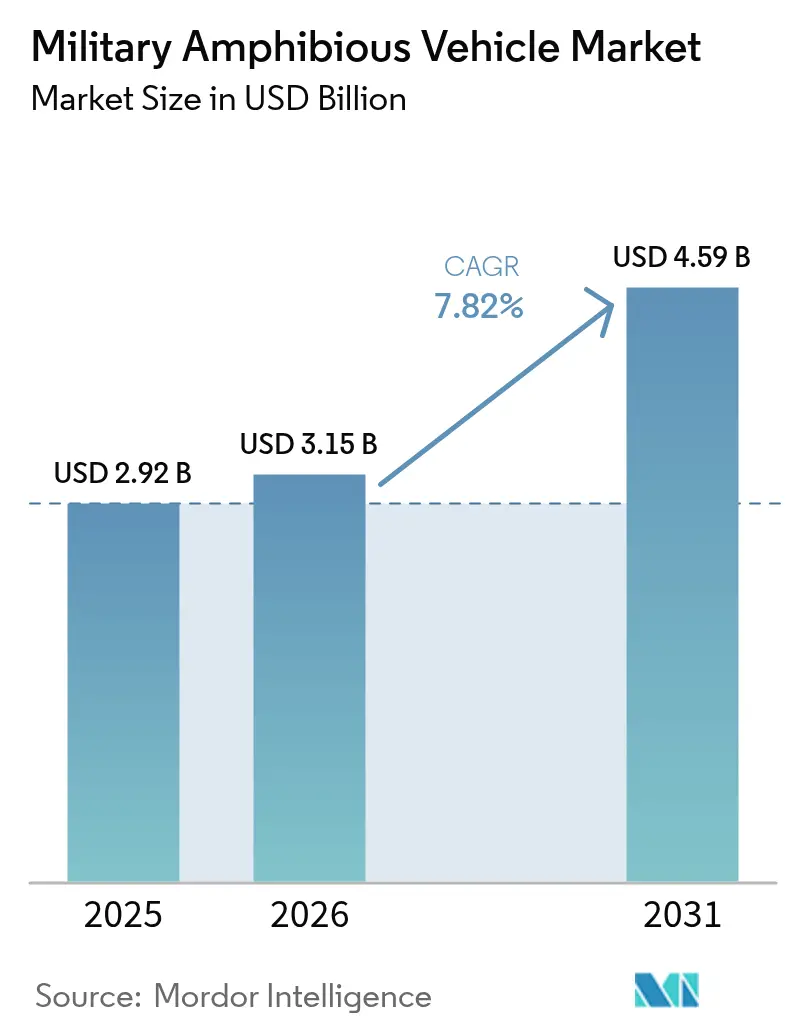
| Market Size (2026) | USD 3.15 Billion |
| Market Size (2031) | USD 4.59 Billion |
| Growth Rate (2026 - 2031) | 7.82% CAGR |
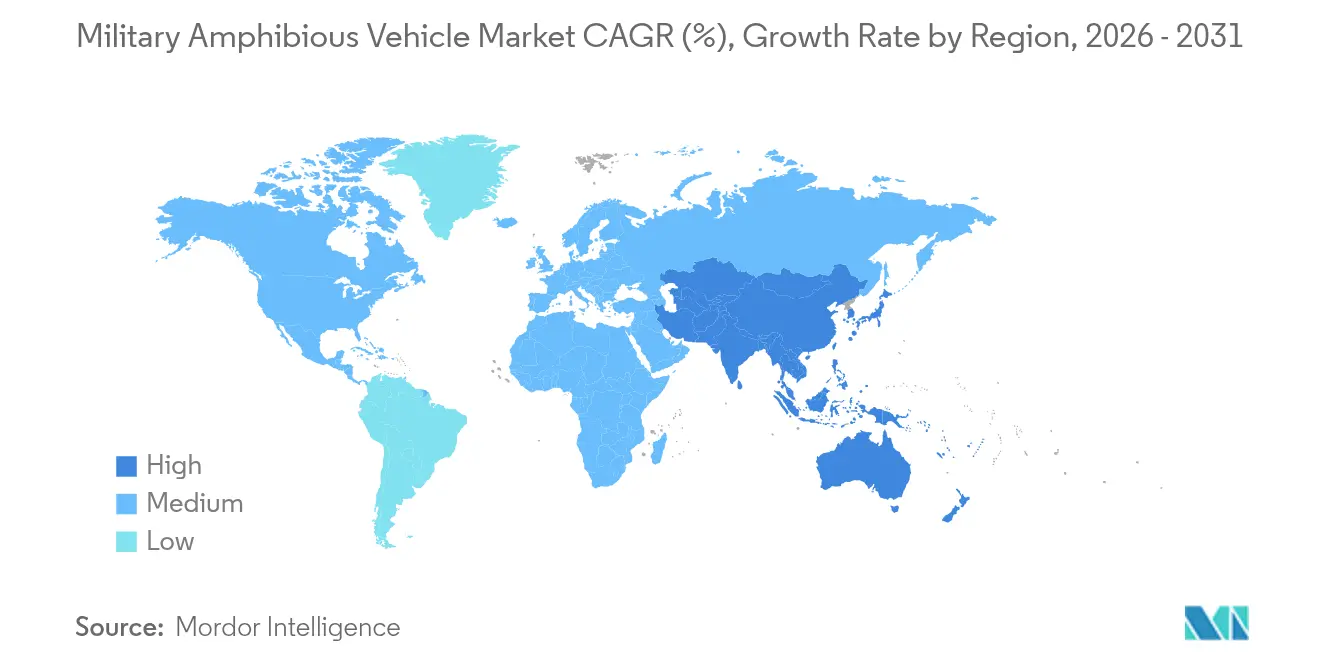
| Fastest Growing Market | Asia Pacific |
| Largest Market | North America |
| Market Concentration | Medium |
Major Players *Disclaimer: Major Players sorted in no particular order Image © Mordor Intelligence. Reuse requires attribution under CC BY 4.0. | |
Military Amphibious Vehicle Market Analysis by Mordor Intelligence
The military amphibious vehicles market size was valued at USD 2.92 billion in 2025 and estimated to grow from USD 3.15 billion in 2026 to reach USD 4.59 billion by 2031, at a CAGR of 7.82% during the forecast period (2026-2031). Demand growth reflects widening maritime flashpoints, especially in the Indo-Pacific, where expeditionary warfare, over-the-horizon logistics, and contested-littoral operations have become top procurement priorities. Programs such as the US Marine Corps Amphibious Combat Vehicle (ACV), Brazil’s VBTP-MR Guarani, and the US Navy Ship-to-Shore Connector (SSC) illustrate sustained investments in protected mobility, rapid ship-to-shore transfer, and network-enabled command. Hovercraft reliability upgrades, additive-manufactured spare parts, and saltwater-resistant materials reshape life-cycle economics while tracking global demand toward more agile, corrosion-resilient fleets. As nations recalibrate force structures to counter anti-access threats, the military amphibious vehicles market continues to attract moderate but stable competitive intensity led by BAE Systems, Textron, General Dynamics, and Lockheed Martin.
Key Report Takeaways
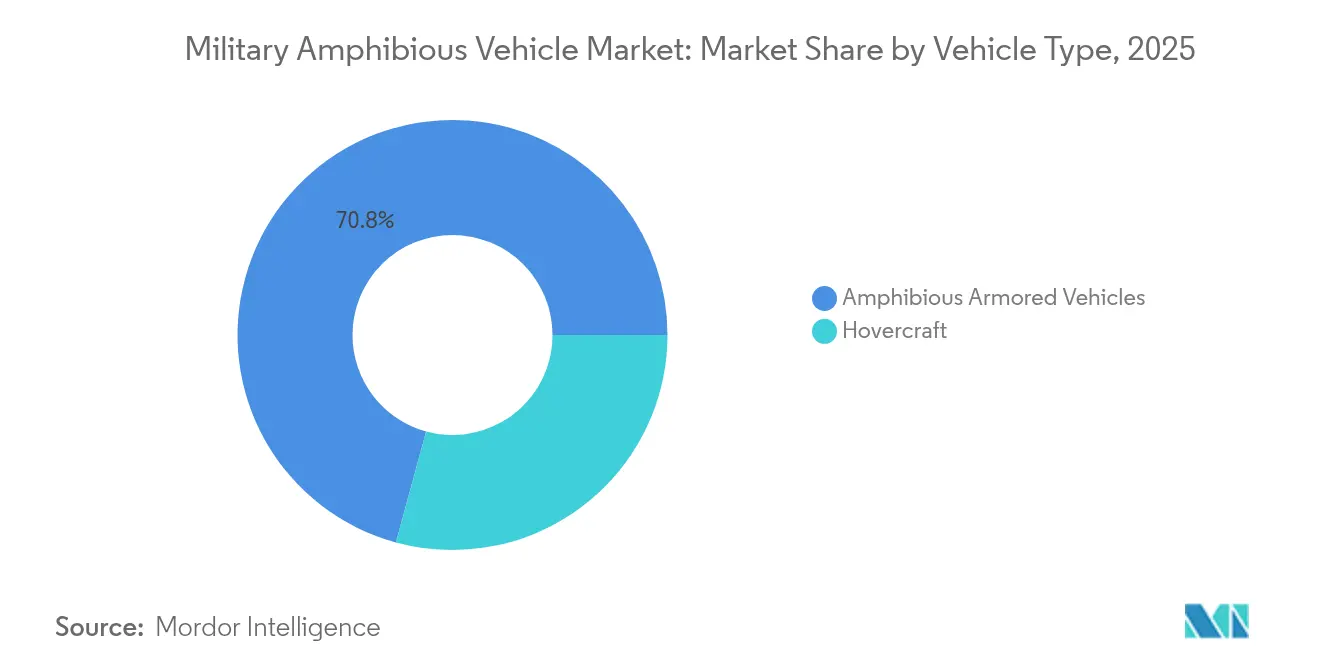
- By vehicle type, amphibious armored vehicles led with 70.76% revenue share in 2025, while hovercraft are forecasted to expand at an 8.11% CAGR through 2031.
- By mobility, tracked systems held 63.62% of the military amphibious vehicles market share in 2025, whereas wheeled variants are advancing at a 7.98% CAGR to 2031.
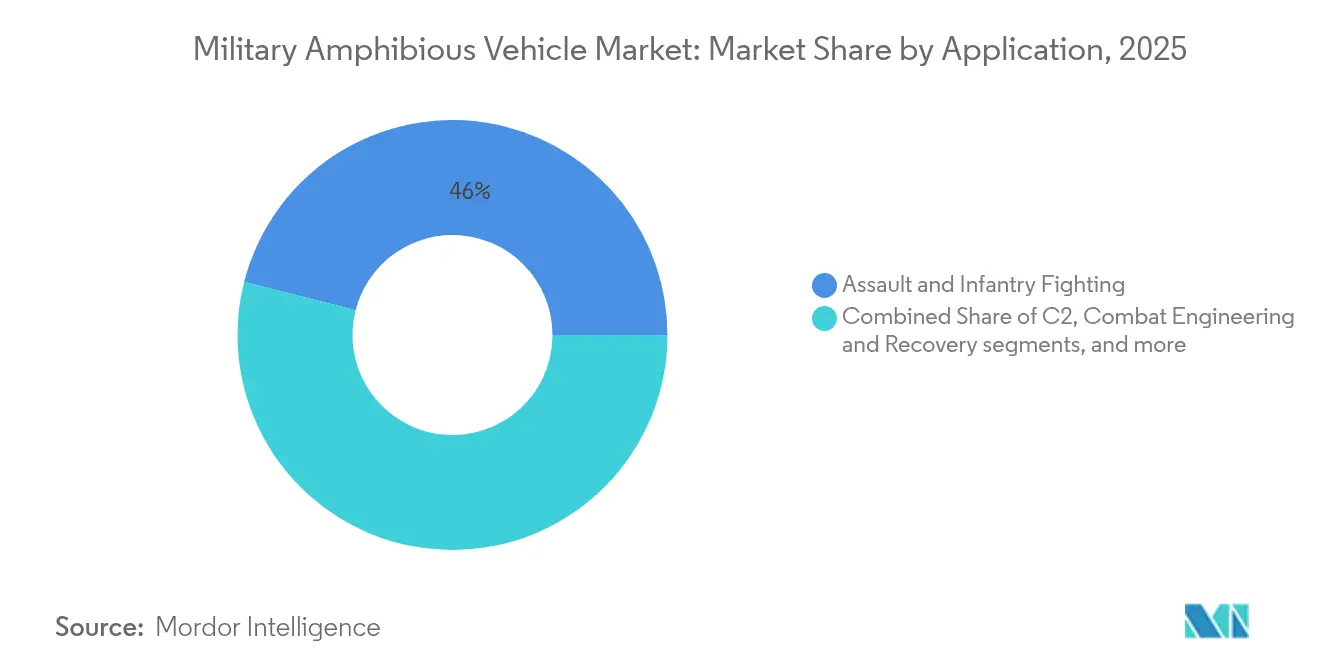
- By application, assault and infantry fighting captured 46.02% of the military amphibious vehicles market size in 2025 and will progress at a 7.28% CAGR through 2031.
- By end user, Marine Corps units accounted for a 46.68% share of the military amphibious vehicles market size in 2025 while growing at an 8.38% CAGR to 2031.
- By geography, North America held a 45.77% share in 2025, yet Asia-Pacific is set to post the fastest 8.78% CAGR between 2026 and 2031.
Note: Market size and forecast figures in this report are generated using Mordor Intelligence’s proprietary estimation framework, updated with the latest available data and insights as of 2026.
Global Military Amphibious Vehicle Market Trends and Insights
Drivers Impact Analysis*
| Driver | (~) % Impact on CAGR Forecast | Geographic Relevance | Impact Timeline |
|---|---|---|---|
| Rising maritime tensions and grey-zone confrontations | +2.1% | Indo-Pacific, South China Sea, Eastern Europe | Short term (≤ 2 years) |
| Increasing focus on over-the-horizon expeditionary logistics capabilities | +1.8% | North America, Asia-Pacific, NATO Europe | Medium term (2-4 years) |
| Accelerated fielding of next-generation amphibious combat vehicles | +1.5% | North America, Europe, advanced Asia-Pacific | Medium term (2-4 years) |
| Naval adoption of additive manufacturing to reduce spare part lead times | +0.9% | North America, Europe, allied nations | Long term (≥ 4 years) |
| Development of amphibious ground vehicles for first-wave breaching operations | +1.2% | Global early adopters | Medium term (2-4 years) |
| Integration of multi-domain command and control (C2) systems in amphibious platforms | +0.8% | NATO, Five Eyes, advanced militaries | Long term (≥ 4 years) |
| Source: Mordor Intelligence | |||
Rising Maritime Tensions Drive Amphibious Capability Investments
Escalating South China Sea and Taiwan Strait disputes compel regional forces to acquire platforms to maneuver in contested littorals. Chinese Type 072A drills within 24 nautical miles of Taiwan demonstrate operational readiness, prompting allied programs such as Japan’s new assault vehicle prototype and South Korea’s KAAV II. The US Marine Corps’ Force Design 2030 accents distributed operations across the first island chain. Together, these developments reinforce procurement of highly protected, long-range systems that can survive anti-access threats and deliver combat power ashore.
Expeditionary Logistics Capabilities Transform Doctrine
Modern militaries emphasize rapid, self-sustained deployment beyond fixed port infrastructure. The ACV’s ship-launched, over-the-horizon reach enables Marines to bypass fortified beaches. Brazil’s 2,044-vehicle Guarani order shows emerging powers pursuing similar versatility for warfighting and disaster relief. Networked command suites extend mission duration, while modular mission bays allow quick role change from troop lift to cargo or casualty evacuation.
Next-Generation Combat Vehicles Accelerate Growth
Additive-manufactured hulls, autonomous navigation, and AI-enabled threat detection improve survivability without weight penalties. The US Army’s Jointless Hull research reduces weld points, lowering maintenance needs. Japan’s sensor-fused demonstrator achieves real-time situational awareness, and South Korea’s KAAV II targets higher water speed while protecting against kinetic threats. These advances raise replacement demand among fleets built in the 1990s and early 2000s.[1]U.S. Army, “Army Advances Additive Manufacturing for Combat Vehicles,” army.mil
Additive Manufacturing Revolutionizes Spare Parts Supply
Shipboard 3D printers now produce propulsion seals, hatch latches, and structural brackets, cutting lead times from months to hours. The US Navy fabricates lightweight aluminum couplings aboard LHD-class assault ships, trimming inventory and shipping costs. European partners Denmark and the Netherlands embed similar depot-level printers, enhancing NATO interoperability and sparing logistics chains in highly dispersed operations.
Restraints Impact Analysis*
| Restraint | (~) % Impact on CAGR Forecast | Geographic Relevance | Impact Timeline |
|---|---|---|---|
| High life-cycle costs due to saltwater corrosion exposure | –1.4% | Coastal and island operators | Long term (≥ 4 years) |
| Operational limitations linked to low gearbox reliability in hovercraft | –0.8% | North America, Europe LCAC users | Short term (≤ 2 years) |
| Supply chain risks from single-source skirt fabric procurement | –0.6% | Hovercraft operators worldwide | Medium term (2-4 years) |
| Complex maintenance requirements for hybrid propulsion and waterjet systems | –1.1% | Advanced market adopters | Medium term (2-4 years) |
| Source: Mordor Intelligence | |||
Saltwater Corrosion Inflates Ownership Costs
Studies show salt-spray exposure lifts maintenance spending 40–60% above land-only fleets. Hull pitting, galvanic corrosion, and electronic degradation shorten overhaul intervals, forcing navies to allocate growing sustainment budgets. Protective coatings and fiber-reinforced composites help, yet they require specialized repair skills that are not always available in forward areas.[2]Congressional Budget Office, “Cost Growth in Naval Shipbuilding Programs,” cbo.gov
Hovercraft Gearbox Reliability Constrains Tempo
LCAC transmissions experience wear from abrasive sand ingestion and fluctuating lift loads. The US Navy incorporated hardened steel gears and improved lubrication circuits in new SSC blocks, but legacy craft still record lower availability. European fleets conduct pre-deployment gearbox borescope checks, raising operating costs and delaying sortie generation.
*Our forecasts treat driver/restraint impacts as directional, not additive. The impact forecasts reflect baseline growth, mix effects, and variable interactions.
Segment Analysis
By Vehicle Type: Armored Platforms Dominate Despite Hovercraft Momentum
Amphibious armored vehicles accounted for 70.76% of 2025 revenue, underpinned by continuous ACV deliveries to the US Marine Corps. The military amphibious vehicles market benefits from armor upgrades that defeat medium-caliber threats and improvised explosives. Demand for autonomous gunnery, active protection, and modular mission packages sustains replacement cycles.
Hovercraft posts the strongest outlook at an 8.11% CAGR through 2031 as navies seek over-the-horizon lift and lighter footprints in contested bays. The SSC introduces composite air-cushion systems and corrosion-resistant propulsion gear, lowering life-cycle costs. Expanded cargo decks enable the delivery of heavier main battle tanks, broadening mission sets beyond beach assault to humanitarian supply. Operational doctrines now treat hovercraft as integral to maritime pre-positioning rather than niche connectors, which enlarges their share of future fleet plans.


By Mobility: Tracked Systems Lead While Wheeled Variants Gain Ground
Tracked platforms held 63.62% of 2025 sales, reflecting proven traction on littoral mud and obstacle-strewn beaches. The military amphibious vehicles market values their balanced buoyancy and armor baseline. Upgraded hydropneumatic suspensions extend service lives while preserving low-ground pressure for soft-sand mobility.
Wheeled variants, forecast at an 7.98% CAGR, gain favor for strategic mobility and lower road wear. Patria 6×6 trucks in Denmark’s EUR 247 million (USD 289.95 million) order achieve 100 km/h on highways, accelerating joint force response times. Reduced maintenance man-hours and simpler drivetrains appeal to midsized armies, while modular flotation kits permit quick amphibious configuration changes, enlarging mission scope.
By Application: Assault Operations Dominate While Engineering Capabilities Expand
Assault and infantry missions captured 46.02% of 2025 revenue. Demand is driven by integrating remotely operated turrets, anti-tank guided missiles, and C4ISR nodes into core troop carriers, ensuring immediate fire support after beach landing. The military amphibious vehicles market size for assault roles will grow as forces replace aging AAV-7 and BTR-50 fleets.
Combat engineering and recovery platforms register the top 8.26% CAGR. Gap-crossing, mine-clearing, and obstacle-breaching kits enable first-wave survivability. NATO coastal exercises increasingly feature armored dozer blades, line-charge launchers, and self-deploying bridge layers, unlocking stable demand among amphibious engineer battalions. Urban littoral operations in congested megacities further underscore the importance of engineer variants.
By End User: Marine Corps Leadership Reflects Doctrine Evolution
Marine Corps formations commanded 46.68% of 2025 revenue and will grow at an 8.38% CAGR. Force Design 2030 reorients US Marines toward dispersed stand-in forces, prompting sustained investment in amphibious mobility and long-range fires. Comparable reforms in Japan, South Korea, and the United Kingdom fuel parallel acquisition programs.
Army use cases expand as continental forces anticipate river-crossing and disaster-relief missions. Navy procurement focuses on connectors and logistics craft. Interservice joint experimentation now treats amphibious fleets as shared assets, driving interoperable specifications and joint sustainment frameworks. The military amphibious vehicles industry benefits from specialized and multi-domain procurement pathways.
Geography Analysis
North America maintained a 45.77% revenue lead in 2025, anchored by the ACV’s USD 1.16 billion contract portfolio and the SSC’s USD 706 million modernization track. Mexico’s coastal security orders and Canada’s Arctic-amphibious exercises add incremental volume, though US budgets remain the region’s core driver. Robust depot infrastructure mitigates corrosion costs, extending platform service lives.
Asia-Pacific records the fastest 8.78% CAGR as China, Japan, South Korea, and India intensify amphibious modernization. PLA drills near Taiwan illustrate gray-zone escalation, while Japan’s autonomous assault prototype and South Korea’s KAAV II fielding expand local supply chains. India’s WhAP deployments in overseas peace missions prove the region’s desire for adaptable, export-compliant craft. Emerging Southeast Asian users monitor technology trends, potentially spurring second-wave demand later in the decade.
Europe advances steady replacement programs aligned with NATO interoperability mandates. Denmark’s 130-unit Patria buy, Portugal’s EUR 1.236 billion (USD 1.45 billion) army overhaul, and the Netherlands’ BvS10 transfer to Ukraine signal commitment despite fiscal constraints. Arctic climate change also raises northern amphibious requirements for search-and-rescue and infrastructure defense missions.

Competitive Landscape
Leading suppliers leverage multi-year government contracts, proven combat pedigrees, and classified intellectual property to sustain mid-level market concentration. BAE Systems plc dominates armored categories through ACV and Guarani backlogs. Textron holds a near-duopoly in military hovercraft with the SSC, consolidating aftermarket revenues through proprietary skirt and gearbox upgrades. General Dynamics Corporation complements its portfolios with command-centric variants and hybrid propulsion research.
Sub-tier innovators target autonomy kits, additive-manufactured spares, and corrosion-resistant composites to gain footholds. However, International Traffic in Arms Regulations (ITAR) restrict technology export, raising entry barriers that favor incumbents licensed for cross-border transfers. Supply-chain shocks from single-source skirt materials, turbine blades, and high-strength gear alloys expose OEMs to schedule risk, prompting diversification of suppliers and localized “factory-in-a-box” concepts.
Merger and acquisition prospects remain selective, with primes focusing on software-defined radios, battery management systems, and composite hull producers rather than full-platform acquisitions. Joint ventures with regional shipyards help incumbents comply with local content mandates, reinforcing share stability. Consequently, the military amphibious vehicles market sustains moderate rivalry without price-war races as performance and survivability rank above unit cost in procurement evaluations.
Military Amphibious Vehicle Industry Leaders
BAE Systems plc
General Dynamics Corporation
Rheinmetall AG
Griffon Hoverwork Ltd.
Textron Systems Corporation (Textron Inc.)
- *Disclaimer: Major Players sorted in no particular order


Recent Industry Developments
- April 2025: The US Marine Corps awarded BAE Systems a USD 188.5 million contract for full-rate production of 30 ACV-30mm vehicles. The contract includes fielding support, spare parts, and test equipment.
- July 2025: The United States Marine Corps (USMC) awarded Kongsberg a contract for the full-rate production of remotely operated turrets for the ACV-30 amphibious combat vehicle.
- February 2024: The Japanese MoD announced its involvement in research programs to develop a new amphibious assault vehicle to support its country's various needs.


Global Military Amphibious Vehicle Market Report Scope
Amphibious vehicles can traverse both land and water. This study focuses on two main types: amphibious armored vehicles and hovercraft. These vehicles serve various purposes, including combat, patrol, surveillance, reconnaissance, and search and rescue operations.
The military amphibious vehicle market is segmented by vehicle type, vehicle wheel type, and geography. By vehicle type, the market is segmented into amphibious armored vehicles and hovercraft. By vehicle wheel type, the market is classified as wheeled and tracked. The report also covers the market sizes and forecasts for the military amphibious vehicle market in major countries across different regions. For each segment, the market size is provided in terms of value (USD).
| Amphibious Armored Vehicles |
| Hovercraft |
| Wheeled |
| Tracked |
| Assault and Infantry Fighting |
| Command and Control (C2) |
| Combat Engineering and Recovery |
| Logistics and Humanitarian |
| Army |
| Marine Corps |
| Navy |
| North America | United States | |
| Canada | ||
| Mexico | ||
| Europe | United Kingdom | |
| France | ||
| Germany | ||
| Italy | ||
| Rest of Europe | ||
| Asia-Pacific | China | |
| India | ||
| Japan | ||
| South Korea | ||
| Rest of Asia-Pacific | ||
| South America | Brazil | |
| Rest of South America | ||
| Middle East and Africa | Middle East | Saudi Arabia |
| United Arab Emirates | ||
| Rest of Middle East | ||
| Africa | South Africa | |
| Rest of Africa | ||
| By Vehicle Type | Amphibious Armored Vehicles | ||
| Hovercraft | |||
| By Mobility | Wheeled | ||
| Tracked | |||
| By Application | Assault and Infantry Fighting | ||
| Command and Control (C2) | |||
| Combat Engineering and Recovery | |||
| Logistics and Humanitarian | |||
| By End User | Army | ||
| Marine Corps | |||
| Navy | |||
| By Geography | North America | United States | |
| Canada | |||
| Mexico | |||
| Europe | United Kingdom | ||
| France | |||
| Germany | |||
| Italy | |||
| Rest of Europe | |||
| Asia-Pacific | China | ||
| India | |||
| Japan | |||
| South Korea | |||
| Rest of Asia-Pacific | |||
| South America | Brazil | ||
| Rest of South America | |||
| Middle East and Africa | Middle East | Saudi Arabia | |
| United Arab Emirates | |||
| Rest of Middle East | |||
| Africa | South Africa | ||
| Rest of Africa | |||


Key Questions Answered in the Report
What is the 2026 value and projected CAGR for the Military Amphibious Vehicles market?
The market stands at USD 3.15 billion in 2026 and is forecasted to grow at a 7.82% CAGR to reach USD 4.59 billion by 2031.
Which vehicle type currently leads global sales?
Amphibious armored vehicles hold 70.76% of 2025 revenue, driven by programs like the US ACV and Brazil’s Guarani.
Which region is expanding the fastest?
Asia-Pacific posts the highest 8.78% CAGR through 2031 due to heightened geopolitical tensions and modernization in China, Japan, South Korea, and India.
Why are hovercraft gaining momentum despite reliability concerns?
Upgraded gearboxes, composite skirts, and larger cargo decks in new Ship-to-Shore Connectors support over-the-horizon logistics, driving an 8.11% CAGR outlook for hovercraft.
How do corrosion costs affect platform selection?
Saltwater exposure can lift maintenance spending by up to 60%, prompting buyers to specify advanced coatings and composites that lower life-cycle costs despite higher upfront prices.
Page last updated on:


