
Metro Dense Wave Division Multiplexing (DWDM) Market Size and Share
Market Overview
| Study Period | 2020 - 2031 |
|---|---|
| Market Size (2026) | USD 11.82 Billion |
| Market Size (2031) | USD 17.14 Billion |
| Growth Rate (2026 - 2031) | 7.72 % |
| Fastest Growing Market | Asia-Pacific |
| Largest Market | North America |
| Market Concentration | High |
Major Players *Disclaimer: Major Players sorted in no particular order Image © Mordor Intelligence. Reuse requires attribution under CC BY 4.0. | |
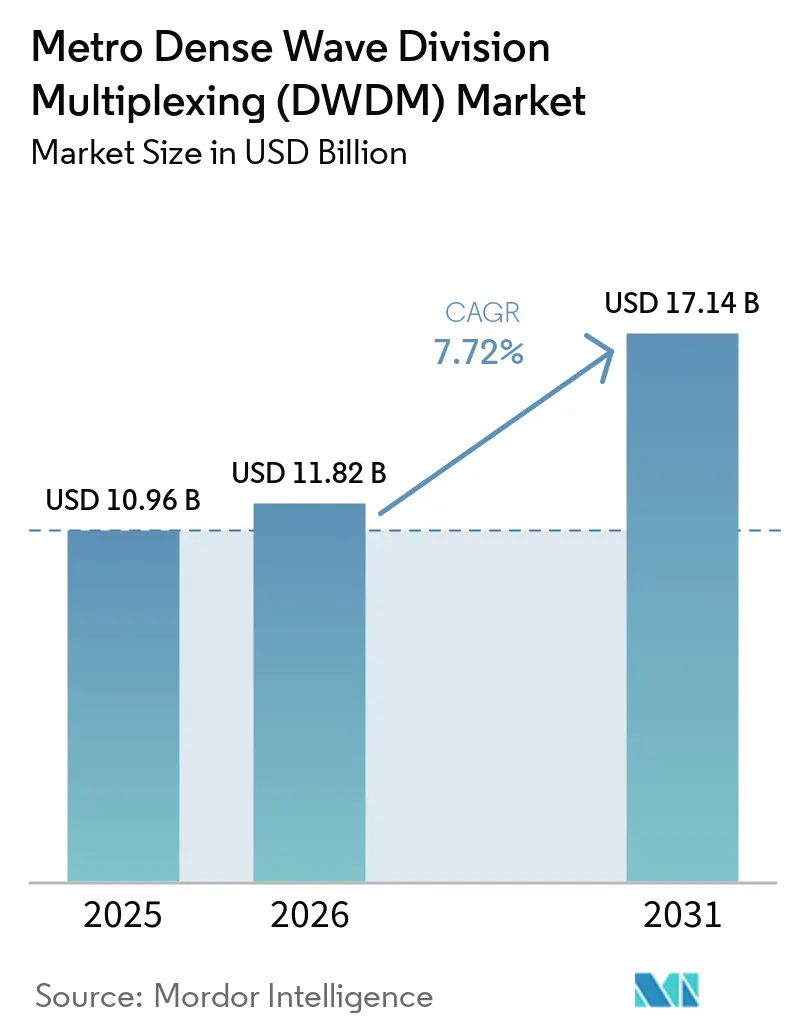
Metro Dense Wave Division Multiplexing (DWDM) Market Analysis by Mordor Intelligence
The Metro Dense Wave Division Multiplexing (DWDM) Market size is expected to grow from USD 10.96 billion in 2025 to USD 11.82 billion in 2026, and is forecast to reach USD 17.14 billion by 2031, at a 7.72% CAGR over 2026-2031. Investment in AI computing is increasing the need for high-capacity links between data centers in the Metro DWDM market. Distributed AI workloads are making low-latency connections between nearby facilities more important. The transition from 10G systems toward 400G and 800G coherent architectures is also supporting equipment replacements. 5G transport buildouts are adding demand for greater capacity in metropolitan networks. At the same time, pluggable optics and disaggregated designs are changing procurement choices and putting pressure on integrated-system pricing.
Key Report Takeaways
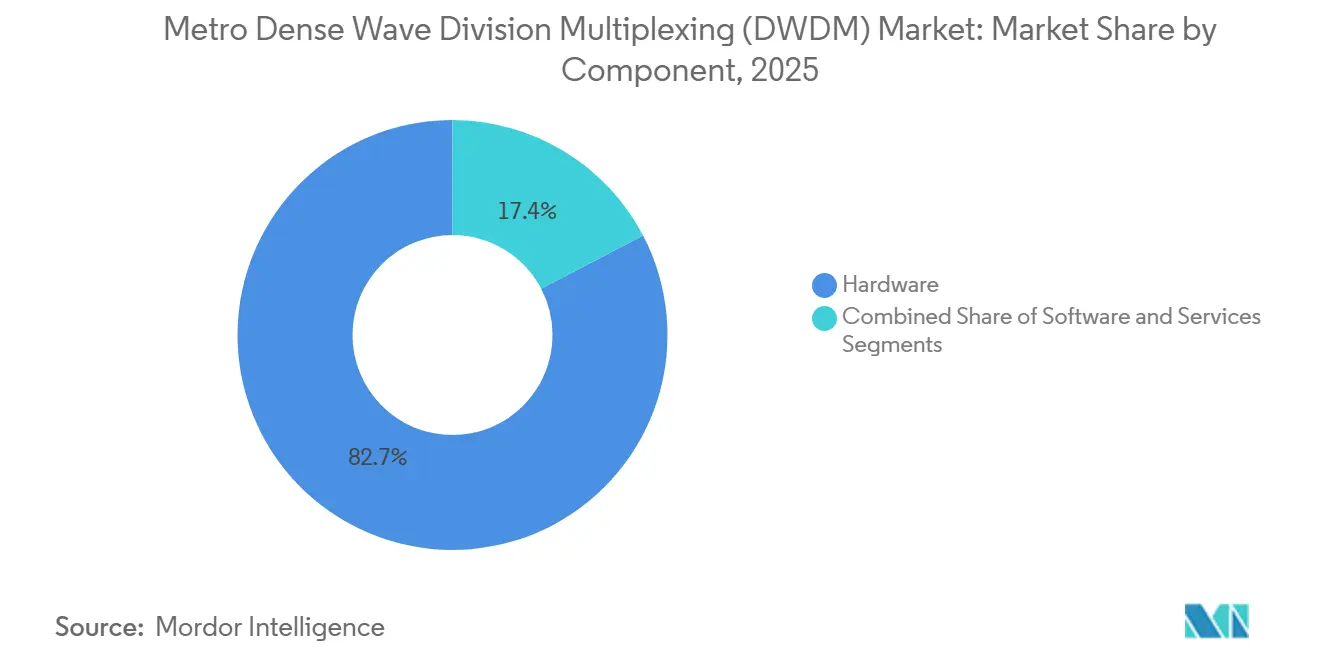
- By component, hardware accounted for 82.65% of the Metro Dense Wave Division Multiplexing (DWDM) Market in 2025, while software is projected to expand at an 11.53% CAGR through 2031.
- By transmission capacity, 400 Gbps accounted for 31.85% of the metro dense wave division multiplexing (DWDM) market in 2025, while above-400 Gbps solutions are projected to register a 12.43% CAGR through 2031.
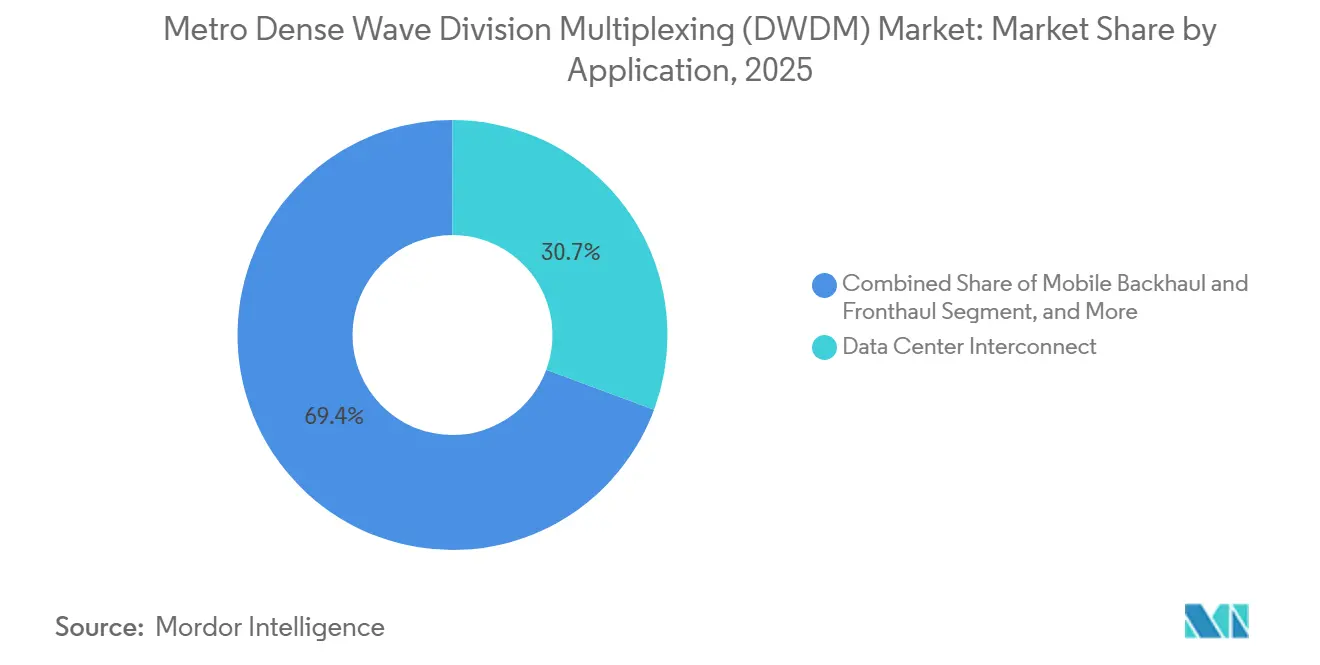
- By application, data center interconnect accounted for 30.65% of the metro dense wave division multiplexing (DWDM) market in 2025 and is projected to advance at an 11.17% CAGR through 2031.
- By end user, communication service providers held 55.85% of the metro DWDM market in 2025, while cloud and data center providers are projected to expand at an 11.29% CAGR through 2031.
- By geography, North America held 35.11% of of the metro DWDM market in 2025, while Asia-Pacific is projected to record an 8.92% CAGR through 2031.
Note: Market size and forecast figures in this report are generated using Mordor Intelligence’s proprietary estimation framework, updated with the latest available data and insights as of January 2026.
Global Metro Dense Wave Division Multiplexing (DWDM) Market Trends and Insights
Drivers Impact Analysis*
| Driver | (~) % Impact on CAGR Forecast | Geographic Relevance | Impact Timeline |
|---|---|---|---|
| Hyperscale and AI Data Center Interconnect Demand | +2.5% | Global, peak in North America and Asia-Pacific | Short term (≤ 2 years) |
| 5G xHaul and Mobile Edge Capacity Expansion | +1.5% | Asia-Pacific core, spillover to Middle East and Africa | Medium term (2-4 years) |
| Migration to 400G, 800G, and 1.6T Coherent Optics | +1.2% | Global | Medium term (2-4 years) |
| Fiber Scarcity and Capacity Scaling on Existing Routes | +0.7% | North America, Europe, dense urban Asia-Pacific | Medium term (2-4 years) |
| IP-over-DWDM and Router-Embedded Coherent Pluggables | +0.5% | Global, led by North America hyperscalers | Short term (≤ 2 years) |
| Metro Edge Sustainability and Power-per-Bit Reduction | +0.3% | Europe, global | Long term (≥ 4 years) |
| Source: Mordor Intelligence | |||
Hyperscale and AI Data Center Interconnect Demand
Distributed AI training is changing the role of the Metro DWDM market from carrier aggregation toward compute interconnection. Hyperscalers are distributing computing capacity across multiple sites because individual locations face power and land constraints. This approach requires low-latency, high-capacity wavelengths between facilities that can be 5-80 km apart. Meta adopted 800ZR+ modules in an IP-over-DWDM configuration for geographically distributed GPU clusters. The deployment shows that the distributed computing clusters require capacity across metropolitan locations. Demand volumes are increasing, but dark fiber remains an alternative for hyperscalers and can limit wavelength-service margins in the Metro DWDM market.
5G xHaul and Mobile Edge Capacity Expansion
5G densification increases transport requirements because networks need more cell sites, tighter fronthaul latency, and higher capacity at each site. The Metro DWDM market benefits where mobile operators combine fronthaul, midhaul, and backhaul into shared transport networks. O-RAN Alliance Working Group 9 specifications define open xHaul transport across these network functions.[1] China had deployed 4.76 million 5G base stations by the end of 2025, creating a large base for continuing midhaul upgrades in major cities. Distributed unit aggregation is concentrating more capacity at fewer metro nodes. That configuration supports upgrades from 100G to 400G coherent transport in existing rings, rather than small additions of lower-speed ports.
Migration to 400G, 800G, and 1.6T Coherent Optics
The Metro DWDM market is undergoing a faster replacement cycle for coherent technology as AI-related connectivity requirements rise. Nokia introduced application-optimized optical offerings that include 1.6T IP-over-DWDM data center interconnect, 2.4T thin-transponder, and 3.2T coherent-lite options. The portfolio uses 4 digital signal processors and combines indium phosphide with silicon photonics. Higher line rates allow operators to add capacity on established fiber routes without equivalent new civil construction. Ciena also presented a 2 nm silicon platform for single-carrier 1600ZR and ZR+ coherent pluggables. Flexible-grid DWDM standards remain relevant because buyers need equipment that can work across evolving optical environments.
Fiber Scarcity and Capacity Scaling on Existing Routes
Limited duct space in dense metropolitan corridors makes more efficient use of existing fiber important to the Metro DWDM market. Urban fiber projects face cost and timing pressures from make-ready work, permits, and rights-of-way coordination.[2] Multi-jurisdictional approval processes can add 6-12 months to those projects. C+L band deployments allow operators to use more spectrum on fiber pairs they already control. This reduces the need for disruptive work along constrained routes. Operators with established duct access can therefore retain an advantage where new entrants cannot easily construct parallel infrastructure.
Restraints Impact Analysis*
| Restraint | (~) % Impact on CAGR Forecast | Geographic Relevance | Impact Timeline |
|---|---|---|---|
| Integration Complexity in Disaggregated Multivendor Networks | -1.1% | Global, most acute in North America and Europe | Medium term (2-4 years) |
| Fiber-Duct and Rights-of-Way Constraints in Dense Urban Corridors | -0.8% | North America, Europe, dense urban Asia-Pacific | Long term (≥ 4 years) |
| Pluggable Optics Cannibalization of Standalone Transport Hardware | -0.6% | Global, led by North America hyperscalers | Short term (≤ 2 years) |
| High Skills Requirement for Optical Planning and Operations | -0.4% | Global, most acute in emerging markets | Medium term (2-4 years) |
| Source: Mordor Intelligence | |||
Integration Complexity in Disaggregated Multivendor Networks
Disaggregated optical networks separate the optical line system from the transponder layer, allowing operators to purchase layers from different suppliers. This flexibility also increases integration work and can slow deployments in the Metro DWDM market. Optical performance must be qualified when wavelengths from one supplier operate across another supplier’s line system. An Optica paper on multivendor IPoDWDM evaluated performance and control-plane validation in these environments.[3] The OpenROADM model provides a framework for interoperability, but controllers may need to manage several model versions. Smaller operators can face greater software and operational burdens due to limited capacity for testing and integration.
Fiber-Duct and Rights-of-Way Constraints in Dense Urban Corridors
Physical limits on urban duct capacity restrict where new fiber can be added for the Metro DWDM market. High-traffic routes often contain aging electrical, gas, and fiber infrastructure that already shares conduits. Research on dense urban deployments identified accurate localization of underground networks as a persistent installation challenge.[4] Ground-penetrating radar surveys can help, but they do not resolve every issue before construction begins. NTT stated that work permits in Japanese urban utility areas may be restricted to the midnight hours. Capacity additions in the most valuable corridors will therefore depend more heavily on coherent upgrades over existing fiber pairs.
*Our forecasts treat driver/restraint impacts as directional, not additive. The impact forecasts reflect baseline growth, mix effects, and variable interactions.
Segment Analysis
By Component: Software Automation Reshapes a Hardware-Dominant Revenue Stack
Hardware accounted for 82.65% of revenue in 2025, making it the leading component category. That position reflected extensive operator investment in coherent line cards, muxponders, transponders, and in-line amplifiers. These systems form the physical layer for transmitting large volumes of traffic over metropolitan fiber routes. Coherent line cards for 400G and 800G transmission lead new hardware procurement. Operators are replacing older 10G and 40G infrastructure with systems that offer substantially improved spectral efficiency. The scale of existing carrier networks means equipment refreshes continue to create hardware demand. Installation and network-management services also accompany many hardware upgrades. These services help operators install, configure, and maintain new optical capacity.
Software is projected to record an 11.53% CAGR through 2031, the highest rate among components in the Metro DWDM market. Software-defined optical platforms enable dynamic wavelength routing across complex transport networks. They also provide automated performance monitoring that can identify operational issues more quickly. Centralized traffic engineering gives network teams more control over available capacity. Ciena highlighted agentic AI network automation in its March 2026 optical portfolio. Nokia’s application-focused solutions likewise reflect the need to align optical systems with specific network uses. Open interfaces increase the importance of software that can operate across equipment layers. As a result, control-plane capabilities can carry more weight in procurement decisions.

By Transmission Capacity: Above-400 Gbps Tiers Define the Next DWDM Refresh Cycle
The 400 Gbps tier held 31.85% of revenue in 2025, the largest share among transmission-capacity categories. Its position reflected the maturity of 400G coherent technology across operator metro cores and data center interconnect applications. The Metro DWDM market size for the 400 Gbps tier benefited from deployments made during the preceding 3 years. This technology offers a proven upgrade path for operators that need greater capacity on established routes. Up-to-100 Gbps systems still operate in legacy access rings and long-tail enterprise networks. The 200 Gbps category serves selected regional requirements where the demand profile remains narrower. Investment is shifting toward higher capacities as traffic loads rise. This leaves 400G as a large installed base and above-400 Gbps as the next investment focus.
Above-400 Gbps solutions are projected to register a 12.43% CAGR through 2031. The category includes 800G and 1.6T architectures used for high-capacity metropolitan and data center deployments. These systems help operators expand traffic capacity without adding the same amount of new fiber infrastructure. Ciena announced 800 Gbps C-band and L-band coherent pluggables with its 2 nm silicon platform. Nokia also announced 1.6T IP-over-DWDM products for data center interconnect deployments. Higher-rate products are becoming increasingly relevant as distributed computing drives more traffic across facilities. Broader 800G deployment also puts 400G pricing under pressure per gigabit. Vendors are accelerating work on 800G and 1.6T products to maintain technology leadership.
By Application: DCI Leads in Both Share and Growth Rate
Data center interconnect held 30.65% of application revenue in 2025, giving it the leading position in the Metro DWDM market. It is also projected to advance at an 11.17% CAGR through 2031. This combination reflects the growing volume of traffic exchanged between data centers. AI workloads require high-capacity links within distributed computing sites and between separate facilities. Operators need transport systems that can deliver predictable capacity across these connections. Purpose-built optical platforms are relevant where cloud providers need low latency and high bandwidth. Ciena’s Waveserver and Nokia’s data center interconnect offerings address this requirement. The resulting procurement pattern gives suppliers a clear reason to prioritize DCI-specific systems.
Mobile backhaul and fronthaul remain the second-largest application area. Their demand is supported by 5G xHaul construction across Asia-Pacific, the Middle East, and Africa. These networks carry traffic between radio sites, processing locations, and core networks. Broadband and access-network aggregation provide another use case as providers consolidate traffic from distributed access points. Other applications include cable multiple-system operator networks and fixed-wireless access aggregation. The Metro DWDM market also supports enterprise transport between campuses and colocation facilities. Such links are relevant for organizations that need private interconnection or access to external computing capacity. Data center interconnect contracts can offer more visible procurement patterns than traditional carrier spending.
By End User: Cloud and Data Center Providers Accelerate as CSPs Anchor Revenue
Communication service providers accounted for 55.85% of revenue in 2025, the largest end-user position. Their installed base includes metro optical rings, enterprise wavelength services, and 5G xHaul transport networks. These operators remain the primary buyers of transport systems as they expand capacity on established routes. Their share reflects this extensive operating footprint. Carrier procurement supports the deployment of coherent systems in regional and metropolitan networks. Providers also need equipment for enterprise services that use dedicated wavelengths. Government and public-sector users increase demand through programs that support optical upgrades in underserved areas. Their role is smaller, but those projects can extend metro infrastructure into new locations.
Cloud and data center providers are projected to expand at an 11.29% CAGR through 2031. Ciena reported optical networking revenue of USD 1.02 billion in fiscal Q1 2026, an increase of 67.9%, and identified demand associated with its optical networking portfolio. Hyperscalers need substantial capacity for links between computing sites. Enterprises also seek wavelength services for private connections to campuses and colocation facilities. AI compute access and latency-sensitive financial applications are driving this enterprise interest. Large institutional buyers influence purchasing priorities because their deployments require substantial capacity. This demand profile increases the importance of data center-focused systems within the Metro DWDM market. It also gives suppliers an incentive to tailor platforms around cloud interconnect requirements.
Geography Analysis
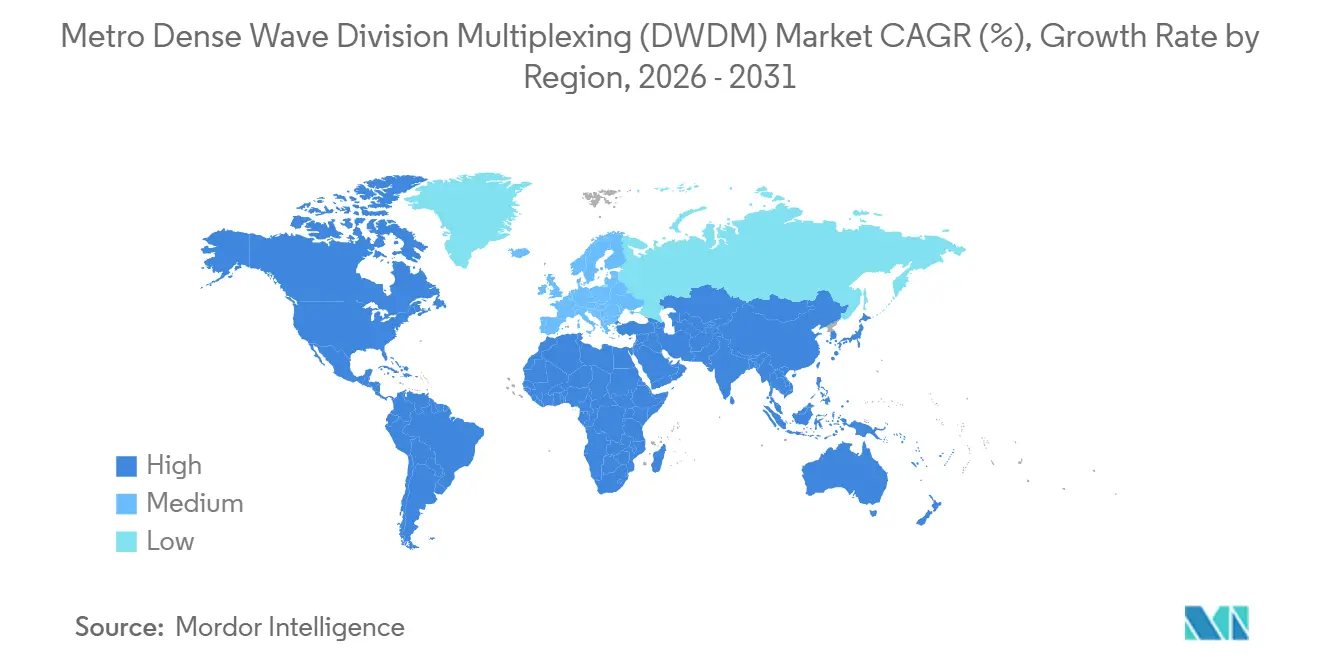
North America held 35.11% of the Metro DWDM market share in 2025. The region benefits from a high concentration of hyperscale data center campuses. The United States is the main source of demand, with data center interconnect serving as a major application. Ciena entered 2026 with approximately USD 5.0 billion in backlog and described itself as essentially sold out, reflecting accumulated customer demand. Canada adds domestic interconnect investment related to data sovereignty requirements. Mexico is benefiting from data center development in Querétaro that is tied to nearshoring activity.
Asia-Pacific is projected to register an 8.92% CAGR through 2031, the fastest rate among geographic areas. China’s 4.76 million 5G base stations deployed by the end of 2025 support ongoing midhaul optical upgrades. India is the fastest-expanding country within the regional Metro DWDM market. Ciena stated that Vodafone Idea deployed WaveLogic 6 Extreme technology in India in March 2026, supporting up to 1.6 Tbps per wavelength. Data center investment, fiberization programs, and mobile-network capacity upgrades support regional demand.
Japan and South Korea continue to need capacity for 5G-Advanced upgrades. Southeast Asia and Australia are replacing legacy SONET and SDH systems with coherent DWDM infrastructure. Europe has mature demand in its Western markets, while Eastern Europe is expanding with support from EU cohesion funding. Infrastructure-sharing obligations under the European Electronic Communications Code are relevant to network planning in Europe. Saudi Arabia and the UAE are adding metro capacity through large infrastructure programs. South Africa and Nigeria lead a developing African market, supported by investments in submarine cable landings.
Competitive Landscape
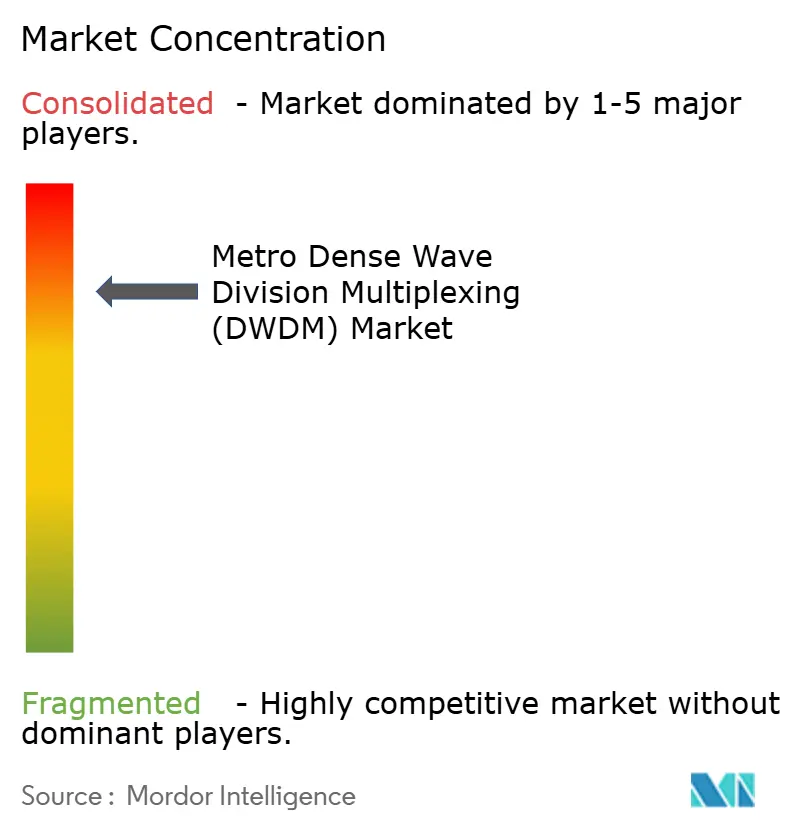
Huawei, Ciena, Nokia (including Infinera), and Cisco (including Acacia) collectively held more than 80% of trailing 4-quarter optical transport revenue through Q2 2026. The Metro DWDM market is therefore consolidated among a small group of leading suppliers. Competition centers on coherent digital signal processor performance, compatibility with open optical architectures, and automation software. Huawei delivered 2.0 Tbps of coherent wavelengths over 80 km at 0.1 W/Gbps, based on the performance reported in the supplied material. Its vertically integrated photonic manufacturing model supports power-efficiency differentiation. Ciena, Nokia, and Cisco are responding with products that combine higher line rates and denser optical infrastructure.
Ciena unveiled hyper-rail photonics in March 2026, with configurations supporting up to 128 fiber pairs in 1 rack. Cisco introduced its Open Transport 3000 Series in March 2026 as a multi-rail open line system. Nokia announced a multi-rail optical line system targeted for commercial availability in the second half of 2026. These moves reflect the priority placed on serving large-scale data center transport deployments. The vendors are also using coherent pluggables to address IP-over-DWDM requirements. Their product strategies seek to reduce power consumption and rack space while raising fiber capacity.
Smartoptics and Ekinops compete in enterprise metro and Tier-2 carrier deployments with simpler disaggregated platforms. Their offerings can appeal to buyers seeking prices below the minimum purchase levels of larger suppliers. Open 800ZR and OpenROADM interoperability requirements shape product design and supplier assessments. An Optica demonstration showed multivendor 800G transmission over 1,602 km using several standards-based optical technologies. This type of testing can reduce integration concerns that have favored fully integrated systems. The Metro DWDM market also has an opening in coherent-lite products for short-reach campus interconnection, where large hyperscalers have not placed volume orders.
Metro Dense Wave Division Multiplexing (DWDM) Industry Leaders
-
Huawei Technologies Co., Ltd.
-
Ciena Corporation
-
Nokia Corporation
-
Cisco Systems, Inc.
-
Ekinops SA
- *Disclaimer: Major Players sorted in no particular order
Recent Industry Developments
- March 2026: Ciena unveiled hyper-rail photonics at OFC 2026, offering amplifier configurations with up to 32× the fiber density of current solutions and supporting 128 fiber pairs in a single rack, with up to 75% power reduction and 85% space reduction. Ciena also announced 800 Gbps C-band and L-band coherent pluggables and a 2 nm silicon platform enabling 1600ZR/ZR+ single-carrier coherent pluggables.
- March 2026: Cisco introduced the Open Transport 3000 Series, a multi-rail open line system that integrates optical components across multiple fiber rails into a single line card, claiming a 75% power reduction and an 80% decrease in rack space. Cisco also enhanced the NCS 1014 to deliver 12.8T capacity in a 1RU line card with 32 OSFP-based ports supporting 800ZR/ZR+ trunks, targeting hyperscaler scale-across deployments.
- March 2026: Nokia announced application-optimized optical solutions at OFC 2026, with new coherent pluggables spanning 1.6T for IP-over-DWDM DCI, 2.4T for thin transponder deployments, and 3.2T coherent lite for short-reach campus applications built on 4 new digital signal processors using indium phosphide and silicon photonics.
- January 2026: Nokia and Constl, a subsidiary of Space World Group, announced a partnership for a pan-India DWDM optical transport network deployment using Nokia's 1830 PSS platform, commencing in Mumbai, and planned to expand nationally to support AI, cloud, and next-generation connectivity requirements.
Global Metro Dense Wave Division Multiplexing (DWDM) Market Report Scope
The Metro Dense Wavelength Division Multiplexing (DWDM) Market revenue is generated through the sale of DWDM hardware, software licenses and subscriptions, and associated deployment, integration, network management, maintenance, and support services provided to communication service providers, cloud and data center providers, enterprises, government organizations, and other end-users.
The metro dense wave division multiplexing (DWDM) market report is segmented by component (hardware, software, and services), transmission capacity (up to 100 Gbps, 200 Gbps, 400 Gbps, and above 400 Gbps), application (data center interconnect, mobile backhaul and fronthaul, broadband and access network aggregation, and other applications), end-user (communication service providers, cloud and data center providers, enterprises, and government and public sector), and geography (North America, South America, Europe, Asia-Pacific, Middle East, and Africa). The market forecasts are provided in terms of value (USD).
| Hardware |
| Software |
| Services |
| Up to 100 Gbps |
| 200 Gbps |
| 400 Gbps |
| Above 400 Gbps |
| Data Center Interconnect |
| Mobile Backhaul and Fronthaul |
| Broadband and Access Network Aggregation |
| Other Applications |
| Communication Service Providers |
| Cloud and Data Center Providers |
| Enterprises |
| Government and Public Sector |
| North America | United States |
| Canada | |
| Mexico | |
| South America | Brazil |
| Argentina | |
| Rest of South America | |
| Europe | Germany |
| United Kingdom | |
| France | |
| Italy | |
| Spain | |
| Rest of Europe | |
| Asia-Pacific | China |
| Japan | |
| South Korea | |
| India | |
| Australia and New Zealand | |
| Rest of Asia-Pacific | |
| Middle East | Saudi Arabia |
| United Arab Emirates | |
| Rest of Middle East | |
| Africa | South Africa |
| Nigeria | |
| Rest of Africa |
| By Component | Hardware | |
| Software | ||
| Services | ||
| By Transmission Capacity | Up to 100 Gbps | |
| 200 Gbps | ||
| 400 Gbps | ||
| Above 400 Gbps | ||
| By Application | Data Center Interconnect | |
| Mobile Backhaul and Fronthaul | ||
| Broadband and Access Network Aggregation | ||
| Other Applications | ||
| By End-User | Communication Service Providers | |
| Cloud and Data Center Providers | ||
| Enterprises | ||
| Government and Public Sector | ||
| By Geography | North America | United States |
| Canada | ||
| Mexico | ||
| South America | Brazil | |
| Argentina | ||
| Rest of South America | ||
| Europe | Germany | |
| United Kingdom | ||
| France | ||
| Italy | ||
| Spain | ||
| Rest of Europe | ||
| Asia-Pacific | China | |
| Japan | ||
| South Korea | ||
| India | ||
| Australia and New Zealand | ||
| Rest of Asia-Pacific | ||
| Middle East | Saudi Arabia | |
| United Arab Emirates | ||
| Rest of Middle East | ||
| Africa | South Africa | |
| Nigeria | ||
| Rest of Africa | ||
Key Questions Answered in the Report
What is the Metro Dense Wave Division Multiplexing (DWDM) market size?
The Metro DWDM market size is estimated at USD 11.82 billion in 2026 and is projected to reach USD 17.14 billion by 2031 at a 7.72% CAGR. The outlook reflects demand for high-capacity metropolitan transport as AI computing and 5G networks increase traffic on existing fiber routes.
What is driving demand for metro DWDM systems?
AI data center interconnect, 5G xHaul expansion, and upgrades to 400G, 800G, and 1.6T coherent technologies are supporting demand. The Metro DWDM market benefits when operators need greater capacity, lower latency, and more efficient use of existing fiber routes.
Which component is expanding the fastest in metro DWDM?
Software is projected to record an 11.53% CAGR through 2031 as operators adopt automation, monitoring, and software-defined optical control. Within the Metro DWDM market, these tools support dynamic wavelength routing and a more centralized approach to traffic engineering.
Which transmission capacity is expected to expand fastest?
Above-400 Gbps solutions are projected to register a 12.43% CAGR through 2031, supported by 800G and 1.6T deployments. The Metro DWDM market uses this equipment where operators and cloud providers need more capacity without matching increases in new fiber construction.
Which application leads metro DWDM demand?
Data center interconnect held 30.65% of application revenue in 2025 and is projected to advance at an 11.17% CAGR through 2031. Distributed AI workloads are increasing the need for high-capacity, low-latency connections between data center locations.
Which region is expected to expand fastest for metro DWDM?
Asia-Pacific is projected to record an 8.92% CAGR through 2031, supported by 5G deployment, data center construction, and fiberization programs. China's large 5G base and continuing network expansion in India contribute to this regional outlook.