Mercury Analyzer Market Size and Share
Market Overview
| Study Period | 2021 - 2031 |
|---|---|
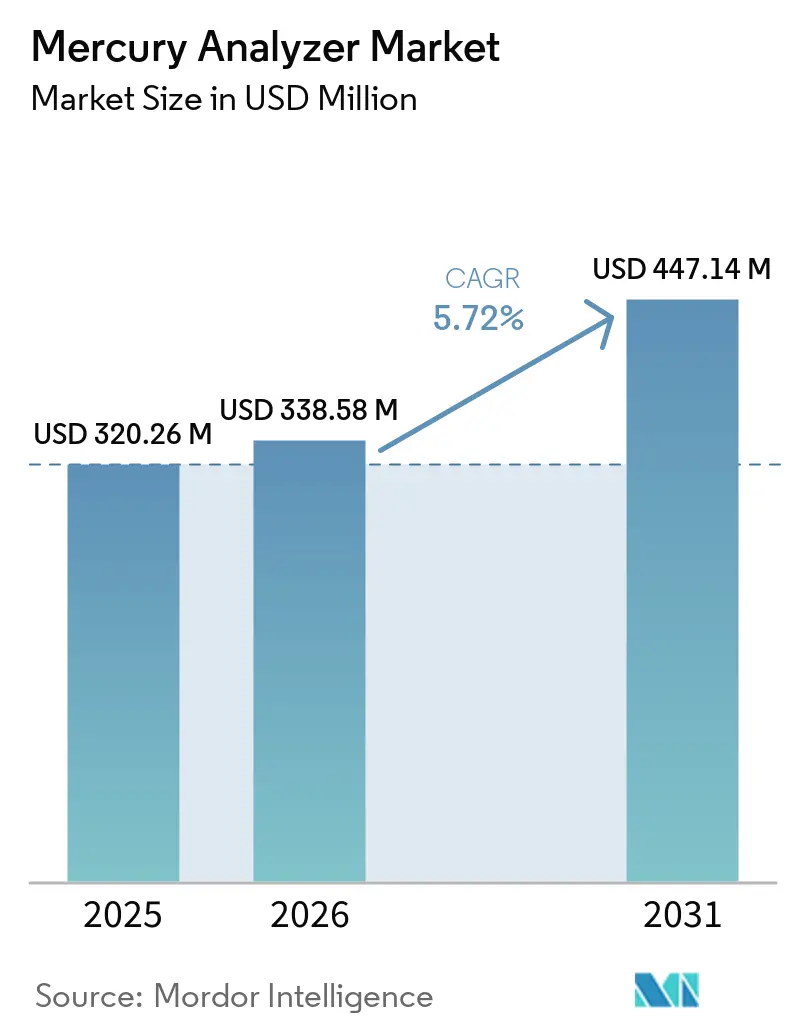
| Market Size (2026) | USD 338.58 Million |
| Market Size (2031) | USD 447.14 Million |
| Growth Rate (2026 - 2031) | 5.72% CAGR |
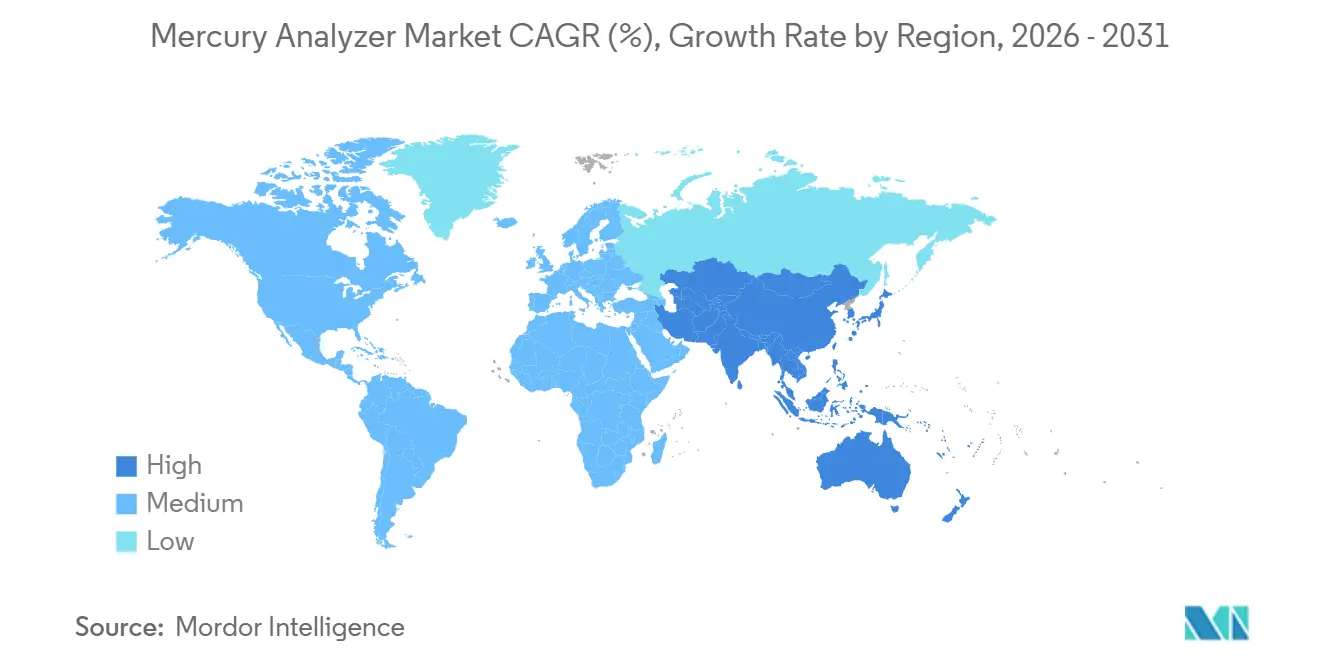
| Fastest Growing Market | Asia Pacific |
| Largest Market | North America |
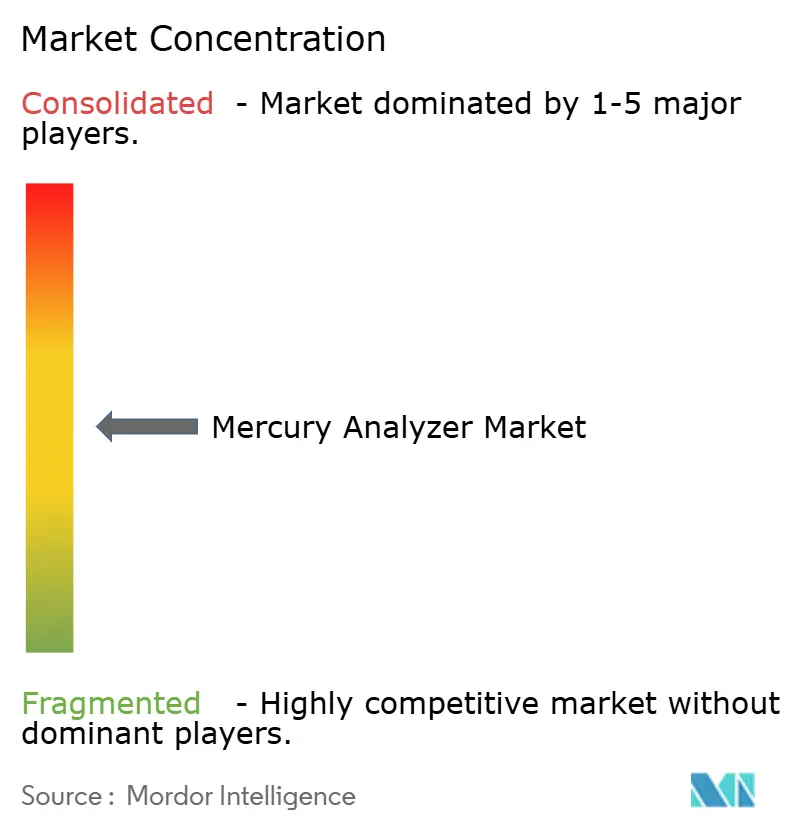
| Market Concentration | Medium |
Major Players
*Disclaimer: Major Players sorted in no particular order Image © Mordor Intelligence. Reuse requires attribution under CC BY 4.0. |
|
Mercury Analyzer Market Analysis by Mordor Intelligence
The Mercury Analyzer Market size is expected to grow from USD 320.26 million in 2025 to USD 338.58 million in 2026 and is forecast to reach USD 447.14 million by 2031 at 5.72% CAGR over 2026-2031. Rising enforcement of ultra-low mercury-emission ceilings in Europe, China, and Japan sustains consistent instrument replacement, while ICH Q3D elemental-impurity limits drive long-term demand from pharmaceutical quality-control laboratories. The adoption of continuous emission monitoring systems (CEMS) at waste-incineration and non-ferrous smelting sites has increased shipments of benchtop and rack-mount analyzers. However, capital-intensive configurations are being replaced by multi-element ICP-MS platforms that consolidate testing for 24 regulated elements. Procurement growth in Asia-Pacific offsets a slowdown among U.S. coal utilities following the February 2026 repeal of strengthened Mercury and Air Toxics Standards, creating a two-speed growth trajectory at the regional level. Overall, advancements in sensitivity, reductions in argon consumption, and turnkey validation packages remain critical factors shaping the mercury analyzer market through 2031.
Key Report Takeaways
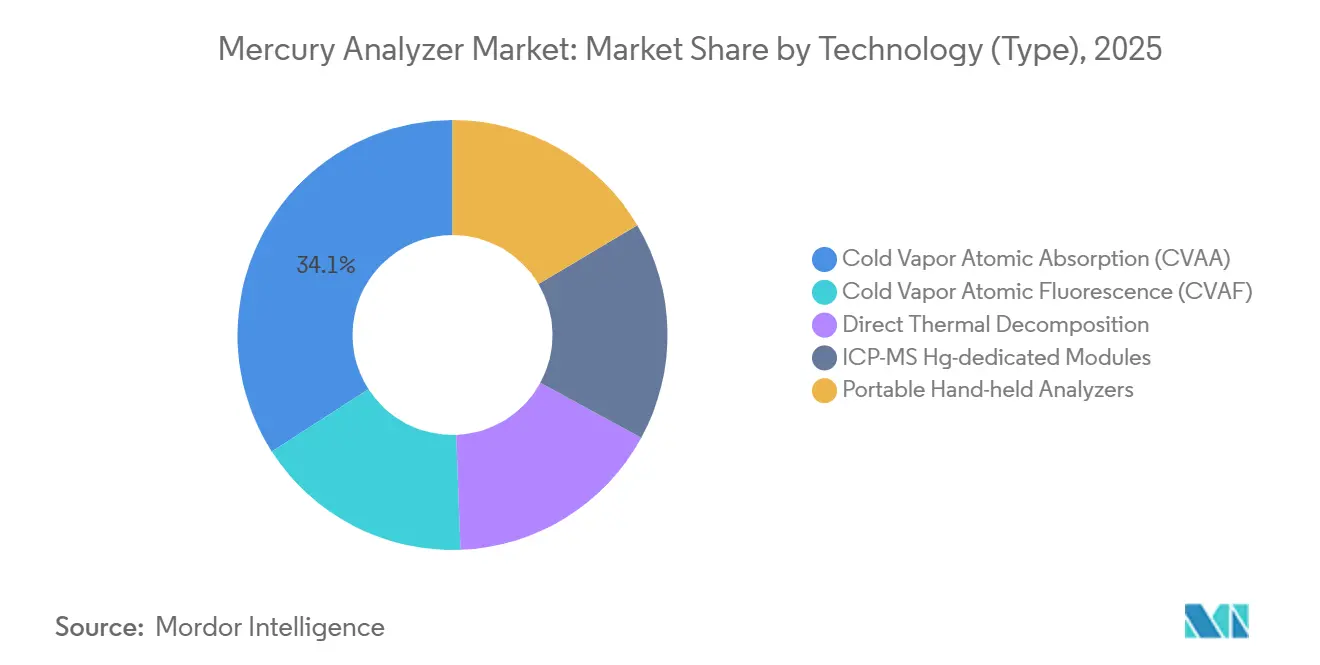
- By technology (type), cold vapor atomic absorption (CVAA) led with 34.11% of the mercury analyzer market share in 2025, while ICP-MS Hg-dedicated modules are projected to expand at a 7.62% CAGR through 2031.
- By configuration, benchtop/rack-mount accounted for 46.77% of the mercury analyzer market share in 2025, while mobile laboratory units are advancing at a 7.71% CAGR through 2031.
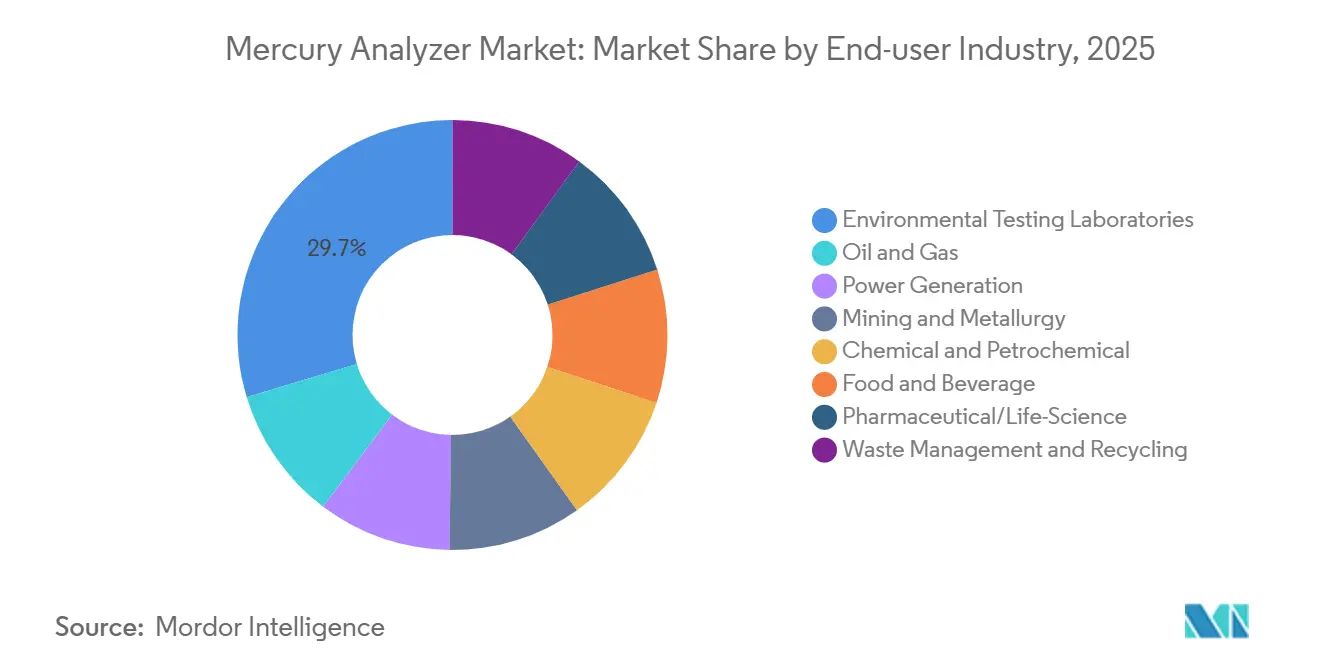
- By end-user industry, environmental testing laboratories captured 29.67% of the mercury analyzer market share in 2025, while waste management and recycling is projected to grow at a 7.82% CAGR through 2031.
- By geography, North America held 30.75% of the mercury analyzer market share in 2025, whereas Asia-Pacific is forecast to climb at a 7.92% CAGR through 2031.
Note: Market size and forecast figures in this report are generated using Mordor Intelligence’s proprietary estimation framework, updated with the latest available data and insights as of January 2026.
Global Mercury Analyzer Market Trends and Insights
Drivers Impact Analysis*
| Driver | (~) % Impact on CAGR Forecast | Geographic Relevance | Impact Timeline |
|---|---|---|---|
| Tightening global mercury-emission limits | +1.8% | Global, with strongest enforcement in EU, China, Japan | Medium term (2–4 years) |
| Minamata Convention national action plans | +1.2% | Global, priority in ASEAN, South America, MEA | Long term (≥4 years) |
| Compliance demand from industrial stack-monitoring | +1.5% | North America, EU, China core; spill-over to India, South Korea | Short term (≤2 years) |
| ICH Q3D and USP <232>/<233> push in pharma QC | +1.0% | Global pharmaceutical hubs: North America, EU, India, China | Medium term (2–4 years) |
| Tariff-driven reshoring of analyzer assembly | +0.3% | United States, with secondary effects in Mexico | Short term (≤2 years) |
| Source: Mordor Intelligence | |||
Tightening Global Mercury-Emission Limits
The European Union enforces a 0.05 mg/Nm³ limit for municipal solid-waste incinerators under the revised Industrial Emissions Directive, effectively requiring real-time mercury detection with data-logging capabilities. China’s GB 13223-2011 standard limits coal-plant stack emissions to 0.03 mg/m³, and inspections under the 14th Five-Year Plan prioritize cement and non-ferrous facilities, driving retrofit orders for cold-vapor and ICP-MS modules[1]Ministry of Ecology and Environment, “14th Five-Year Plan Mercury Control Notice,” mee.gov.cn. Japan enforces limits of 8 µg/Nm³ for coal combustion and 30–50 µg/Nm³ for waste incineration under its Air Pollution Control Law, verified through continuous analyzers integrated into CEMS networks. In contrast, the U.S. EPA’s rollback to 2012 baselines in 2026 delays coal-sector upgrades, widening the demand gap between North America and faster-growing regions like Asia-Pacific and Europe. Vendors that balance high performance with cost-effective ownership are well-positioned to capture market share during this regulatory divergence.
Minamata Convention National Action Plans
Ratification by 148 parties sustains baseline demand for mercury analyzers, as signatories are required to submit triennial implementation updates demonstrating monitoring capacity[2]United Nations Environment Programme, “Minamata Convention Status of Ratifications,” unep.org. Countries such as Australia, Bahrain, and several Southeast Asian economies have allocated budgets for portable cold-vapor and handheld XRF analyzers in their 2025 action plans, supporting field verification of mercury-free gold-mining techniques. Environmental agencies favor rugged, battery-operated units like the Lumex RA-915M for sub-nanogram detection in remote areas, a niche market with limited competition and higher margins. Donor-funded programs expand market opportunities in low-income regions, although uneven budget disbursements create fluctuating shipment volumes. Despite these challenges, the convention’s legal obligations anchor the mercury analyzer market in regions with less stringent industrial standards.
Compliance Demand from Industrial Stack Monitoring
Natural-gas liquefaction plants enforce mercury limits of ≤0.01 µg/Nm³ to protect aluminum cryogenic exchangers from liquid-metal embrittlement. As a result, operators install online analyzers upstream of sorbent beds and adhere to ASTM D6350 and D5954 protocols for calibration. In the U.S., effluent limitation guidelines for flue-gas desulfurization wastewater set a daily maximum of 0.356 ng/L, necessitating the use of cold-vapor atomic fluorescence or ICP-MS with gold stabilization for quantitation. The shift from grab sampling to continuous monitoring raises technical requirements, as automated calibration, 21 CFR Part 11-compliant software, and 24-hour service support become standard purchase conditions. As these requirements expand to include refinery vents and cement kilns, the mercury analyzer market benefits from multi-year service contracts and consumable sales.
ICH Q3D and USP <232>/<233> Push in Pharma QC
ICH Q3D Revision 2 limits mercury exposure to 30 µg/day for oral, 3 µg/day for parenteral, and 1.2 µg/day for inhalation routes, requiring drug manufacturers to validate sub-ppb methods. A 2025 study demonstrated that an Agilent 7800 ICP-MS workflow achieved a 0.014 µg/g limit of quantitation (LOQ) using helium collision-cell technology and gold addition, providing a template for regulatory filings. Excipients suppliers are now required to include element-specific certificates of analysis, driving upstream demand for benchtop analyzers and contract-testing services. While ICP-MS systems, capable of analyzing all 24 elements in a single run, are increasingly favored in high-throughput pharmaceutical labs, dedicated mercury analyzers remain cost-effective for API sites with narrower testing requirements. This pharmaceutical demand stabilizes the mercury analyzer market against cyclical fluctuations in industrial capital expenditures.
Restraints Impact Analysis*
| Restraint | (~) % Impact on CAGR Forecast | Geographic Relevance | Impact Timeline |
|---|---|---|---|
| High cap-ex and maintenance costs | -1.1% | Global, most acute in price-sensitive markets (South America, MEA, ASEAN) | Short term (≤2 years) |
| Substitution by multi-element ICP-MS platforms | -0.9% | North America, EU pharmaceutical and contract-testing hubs | Medium term (2–4 years) |
| Global shortage of low-pressure UV-lamp chips | -0.4% | Global supply chain, component sourcing from Asia | Short term (≤2 years) |
| Source: Mordor Intelligence | |||
High Cap-Ex and Maintenance Costs
Benchtop mercury analyzers are priced between USD 50,000 and USD 150,000, with annual service contracts adding 10–15% to costs. This discourages small laboratories in South America and the Middle-East and Africa from upgrading their equipment. Argon consumption alone can exceed USD 10,000 annually in high-volume workflows, while the need for Milli-Q ultrapure-water infrastructure further increases operational expenses. Budget constraints extend replacement cycles, fuel the refurbished-instrument market, and suppress new-unit sales in cost-sensitive regions, despite tightening regulations.
Substitution by Multi-Element ICP-MS Platforms
Pharmaceutical quality-control laboratories increasingly adopt ICP-MS systems, which cost between USD 150,000 and USD 300,000, as these platforms can analyze arsenic, cadmium, lead, and mercury in a single run, spreading capital costs across broader compliance needs. For example, Shimadzu’s ICPMS-2050 reduces argon consumption by half and doubles sensitivity through redesigned plasma technology, addressing cost concerns that previously favored dedicated mercury analyzers. As validation templates for ICP-MS workflows become more widely available, the replacement cycle for single-analyte models lengthens, limiting growth opportunities for legacy cold-vapor atomic absorption (CVAA) suppliers in the mercury analyzer market.
*Our forecasts treat driver/restraint impacts as directional, not additive. The impact forecasts reflect baseline growth, mix effects, and variable interactions.
Segment Analysis
By Technology: CVAF Sensitivity Anchors Ultra-Trace Applications
Cold vapor atomic absorption accounted for 34.11% of the mercury analyzer market share in 2025 as environmental laboratories relied on established EPA Method 245.7 workflows. CVAF technology extends detection capabilities to 0.02 ng/L with a five-order dynamic range, making it critical for EPA Method 1631 water monitoring. Direct thermal decomposition continues to be the primary method for solid-matrix analyses, such as coal and ore assays. ICP-MS modules dedicated to mercury analysis, growing at a 7.62% CAGR through 2031, are increasingly adopted by pharmaceutical facilities due to their ability to analyze all 24 ICH Q3D elements, thereby broadening the mercury analyzer market across diverse testing applications.
Automation now plays a pivotal role in technology selection. Shimadzu’s LC-ICP-MS package, for example, enables simultaneous analysis of methylmercury and inorganic mercury in a single chromatographic run, allowing food safety laboratories to meet EU seafood regulations without requiring additional instruments. Vendors offering bundled solutions, including method files, interference libraries, and gold-stabilization kits, are reducing deployment times, which is becoming a critical factor for competitive differentiation.


By Configuration: Mobile Units Rise with Field Compliance
Benchtop and rack-mounted systems accounted for 46.77% of the mercury analyzer market share in 2025, supported by features such as autosampler throughput and 21 CFR Part 11 compliance software, which are essential for regulated laboratories. Portable instruments dominate artisanal mining checkpoints but offer lower sensitivity, limiting their overall market share. However, mobile laboratory units are projected to grow at a 7.71% CAGR through 2031 as LNG operators and waste incinerator auditors increasingly deploy van-mounted CVAF or ICP-MS systems for on-site analysis, bypassing delays caused by sample holding times.
European waste management companies are retrofitting continuous emissions monitoring systems (CEMS) under the 0.05 mg/Nm³ regulation, while third-party testing providers lease mobile labs to multiple facilities, optimizing capital expenditure through shared service schedules. This trend is driving a bifurcation in the market: high-volume central laboratories are investing in robotic autosamplers, while distributed compliance networks are favoring mobile solutions, further segmenting the mercury analyzer market.
By End-user Industry: Waste Management Surges on CEMS Mandate
Environmental testing laboratories accounted for 29.67% of market demand in 2025, supported by the Minamata Convention reporting requirements and ambient air monitoring. The waste management and recycling segment is projected to grow at a 7.82% CAGR through 2031, driven by EU mandates requiring continuous mercury analyzers integrated with plant control systems in incinerators. The oil and gas industry is adopting online detection systems with 0.01 µg/Nm³ sensitivity to protect cryogenic assets, while pharmaceutical manufacturers are increasingly using ICP-MS systems for elemental impurity certification. The mercury analyzer market is evolving along two primary tracks: dedicated cold-vapor systems for environmental and industrial applications, and multi-element ICP-MS platforms for life sciences.
Geography Analysis
North America held 30.75% of the mercury analyzer market share in 2025, supported by a legacy fleet of coal-plant CEMS and a concentrated pharmaceutical industry. However, growth in the region is slowing as utilities delay upgrades following the 2026 EPA rule reversal. While Canada’s alignment with the Minamata Convention and Mexico’s pharmaceutical outsourcing provide some stability, they are insufficient to offset the decline in U.S. demand.
The Asia-Pacific region is the fastest-growing market, with a projected 7.92% CAGR through 2031. This growth is driven by China’s 0.03 mg/m³ stack emission limit under GB 13223-2011 and Japan’s 8 µg/Nm³ coal emission cap, both of which necessitate ongoing retrofits. India’s generic drug exports rely on ICP-MS systems to meet U.S. and EU regulatory requirements, while ASEAN countries are incorporating portable analyzers into World Bank–funded environmental projects, further expanding the mercury analyzer market footprint.
Europe maintains premium pricing due to the 0.05 mg/Nm³ incinerator emission ceiling, with Germany, France, and the United Kingdom leading in shipments. Russia, constrained by sanctions, is sourcing domestic and Asian alternatives. Meanwhile, South America and the Middle-East and Africa remain price-sensitive markets, relying on refurbished units and donor-funded initiatives.

Competitive Landscape
The mercury analyzer market is moderately fragmented. Key players such as Thermo Fisher, PerkinElmer, HORIBA, Teledyne, and Analytik Jena leverage their broad product portfolios to cross-sell mercury analysis modules alongside ICP-MS and atomic absorption platforms. Specialized companies like Tekran and Lumex dominate the ambient air and portable instrument segments. Shimadzu’s ICPMS-2050 exemplifies cost-efficient innovation by reducing argon consumption and automating hydrogen reaction modes. Chinese manufacturers, such as HaIGuang, are targeting sub-USD 50,000 price points but face challenges in establishing service networks in regulated pharmaceutical markets. Ecosystem lock-in strategies, including consumable bundles and 21 CFR Part 11 compliance software, continue to influence buyer loyalty in the mercury analyzer market.
Mercury Analyzer Industry Leaders
-
Thermo Fisher Scientific Inc.
-
PerkinElmer
-
Teledyne Technologies Incorporated
-
Analytik Jena GmbH+Co. KG
-
Milestone Srl
- *Disclaimer: Major Players sorted in no particular order

Recent Industry Developments
- May 2025: Heidelberg Materials Romania implemented Milestone Srl's DMA-80 evo direct mercury analyzer at its Fieni cement plant to enhance mercury monitoring in raw materials and fuels. The system was selected for its capability to deliver rapid (under 6 minutes), direct analysis of solid and liquid samples without requiring chemical pretreatment, while ensuring compliance with EPA 7473 standards.
- February 2024: Lumex Instruments launched the Light 915M2 mercury analyzer, marking a notable development in analytical technology. The device provided researchers, environmental scientists, and laboratory professionals with accurate and real-time analysis capabilities for detecting mercury levels in various samples.


Global Mercury Analyzer Market Report Scope
A mercury analyzer is an instrument designed for the precise detection and measurement of mercury concentrations in solid, liquid, and gas samples. These devices play a critical role in environmental monitoring, industrial quality control, and ensuring regulatory compliance. Common types include direct mercury analyzers (DMA), which do not require sample digestion, and portable analyzers suitable for field applications.
The Mercury Analyzer Market is segmented into technology (type), configuration, end-user industry, and geography. By technology (type), the market is segmented into cold vapor atomic absorption (CVAA), cold vapor atomic fluorescence (CVAF), direct thermal decomposition, ICP-MS Hg-dedicated modules, and portable hand-held analyzers. By configuration, the market is segmented into benchtop/rack-mount, portable/hand-held, and mobile laboratory units. By end-user industry, the market is segmented into environmental testing laboratories, oil and gas, power generation, mining and metallurgy, chemical and petrochemical, food and beverage, pharmaceutical/life-science, and waste management and recycling. The report also covers the market size and forecasts for mercury analyzer in 17 countries across major regions. For each segment, the market sizing and forecasts have been done on the basis of value (USD).
| Cold Vapor Atomic Absorption (CVAA) |
| Cold Vapor Atomic Fluorescence (CVAF) |
| Direct Thermal Decomposition |
| ICP-MS Hg-dedicated Modules |
| Portable Hand-held Analyzers |
| Benchtop/Rack-mount |
| Portable/Hand-held |
| Mobile Laboratory Units |
| Environmental Testing Laboratories |
| Oil and Gas |
| Power Generation |
| Mining and Metallurgy |
| Chemical and Petrochemical |
| Food and Beverage |
| Pharmaceutical/Life-Science |
| Waste Management and Recycling |
| Asia-Pacific | China |
| Japan | |
| India | |
| South Korea | |
| ASEAN Countries | |
| Rest of Asia-Pacific | |
| North America | United States |
| Canada | |
| Mexico | |
| Europe | Germany |
| United Kingdom | |
| France | |
| Italy | |
| Spain | |
| Russia | |
| Rest of Europe | |
| South America | Brazil |
| Argentina | |
| Rest of South America | |
| Middle-East and Africa | Saudi Arabia |
| South Africa | |
| Rest of Middle- East and Africa |
| By Technology (Type) | Cold Vapor Atomic Absorption (CVAA) | |
| Cold Vapor Atomic Fluorescence (CVAF) | ||
| Direct Thermal Decomposition | ||
| ICP-MS Hg-dedicated Modules | ||
| Portable Hand-held Analyzers | ||
| By Configuration | Benchtop/Rack-mount | |
| Portable/Hand-held | ||
| Mobile Laboratory Units | ||
| By End-user Industry | Environmental Testing Laboratories | |
| Oil and Gas | ||
| Power Generation | ||
| Mining and Metallurgy | ||
| Chemical and Petrochemical | ||
| Food and Beverage | ||
| Pharmaceutical/Life-Science | ||
| Waste Management and Recycling | ||
| By Geography | Asia-Pacific | China |
| Japan | ||
| India | ||
| South Korea | ||
| ASEAN Countries | ||
| Rest of Asia-Pacific | ||
| North America | United States | |
| Canada | ||
| Mexico | ||
| Europe | Germany | |
| United Kingdom | ||
| France | ||
| Italy | ||
| Spain | ||
| Russia | ||
| Rest of Europe | ||
| South America | Brazil | |
| Argentina | ||
| Rest of South America | ||
| Middle-East and Africa | Saudi Arabia | |
| South Africa | ||
| Rest of Middle- East and Africa | ||


Key Questions Answered in the Report
What is the size of the Mercury Analyzer Market?
The Mercury Analyzer Market stands at USD 338.58 million in 2026 and is projected to reach USD 447.14 million by 2031.
Which region will grow fastest through 2031?
Asia-Pacific is projected to post a 7.92% CAGR through 2031 because of stringent stack-monitoring rules in China and Japan.
Which technology (type) segment shows the highest growth rate?
ICP-MS Hg-dedicated modules are expected to expand at 7.62% CAGR through 2031 as pharma labs consolidate elemental testing.
Why are mobile laboratory units gaining popularity?
Oil and gas and waste incinerator operators favor mobile labs for on-site mercury compliance where sample transport is risky or delayed.
Page last updated on:


