
Merchant Payment Market Size and Share
Market Overview
| Study Period | 2020 - 2031 |
|---|---|
| Market Size (2026) | USD 46.90 Trillion |
| Market Size (2031) | USD 63.40 Trillion |
| Growth Rate (2026 - 2031) | 6.20 % |
| Fastest Growing Market | South America |
| Largest Market | Asia-Pacific |
| Market Concentration | Low |
Major Players *Disclaimer: Major Players sorted in no particular order Image © Mordor Intelligence. Reuse requires attribution under CC BY 4.0. | |
Merchant Payment Market Analysis by Mordor Intelligence
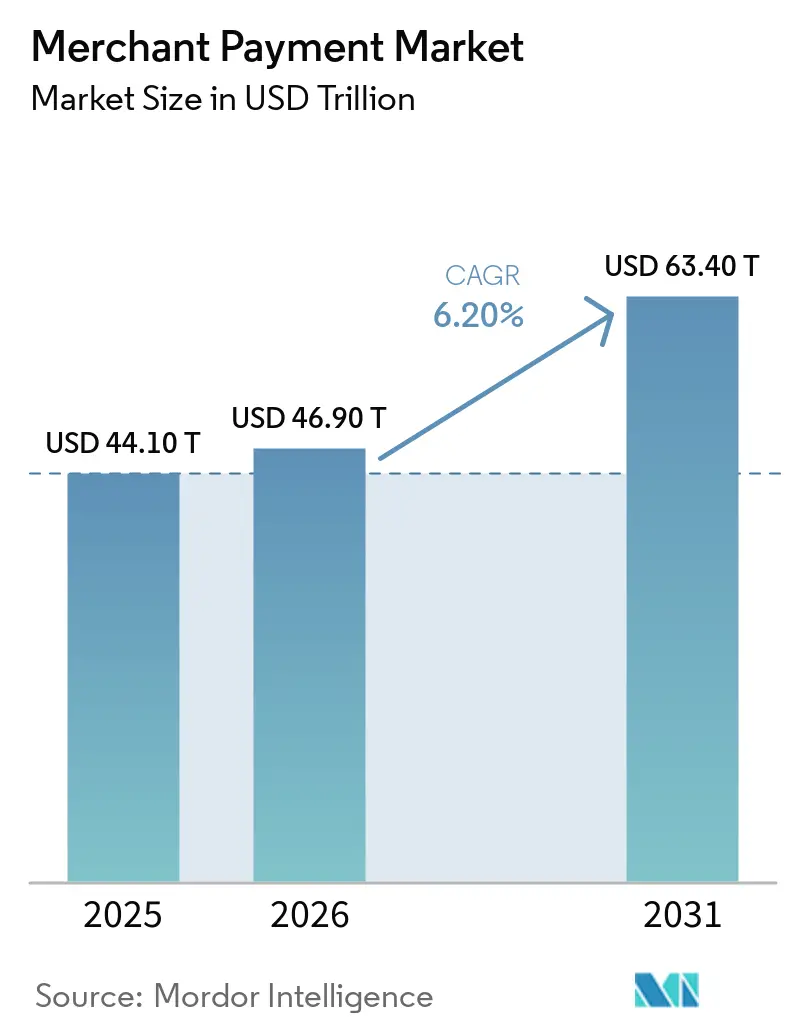
The merchant payment market size was valued at USD 44.1 trillion in 2025 and estimated to grow from USD 46.9 trillion in 2026 to reach USD 63.4 trillion by 2031, at a CAGR of 6.2% during the forecast period (2026-2031). The merchant payment market is changing as merchants accept cards, digital wallets, and account-to-account transfers within the same checkout environment. This shift raises the importance of acceptance systems that can manage several payment methods and reconcile them across online and physical channels. Competitive strategies now center on simpler merchant onboarding, data-led routing, fraud controls, and local payment options. The merchant payment market also faces pressure from lower interchange fees and rising scam exposure, which can limit processor returns even as transaction volumes rise.
Key Report Takeaways
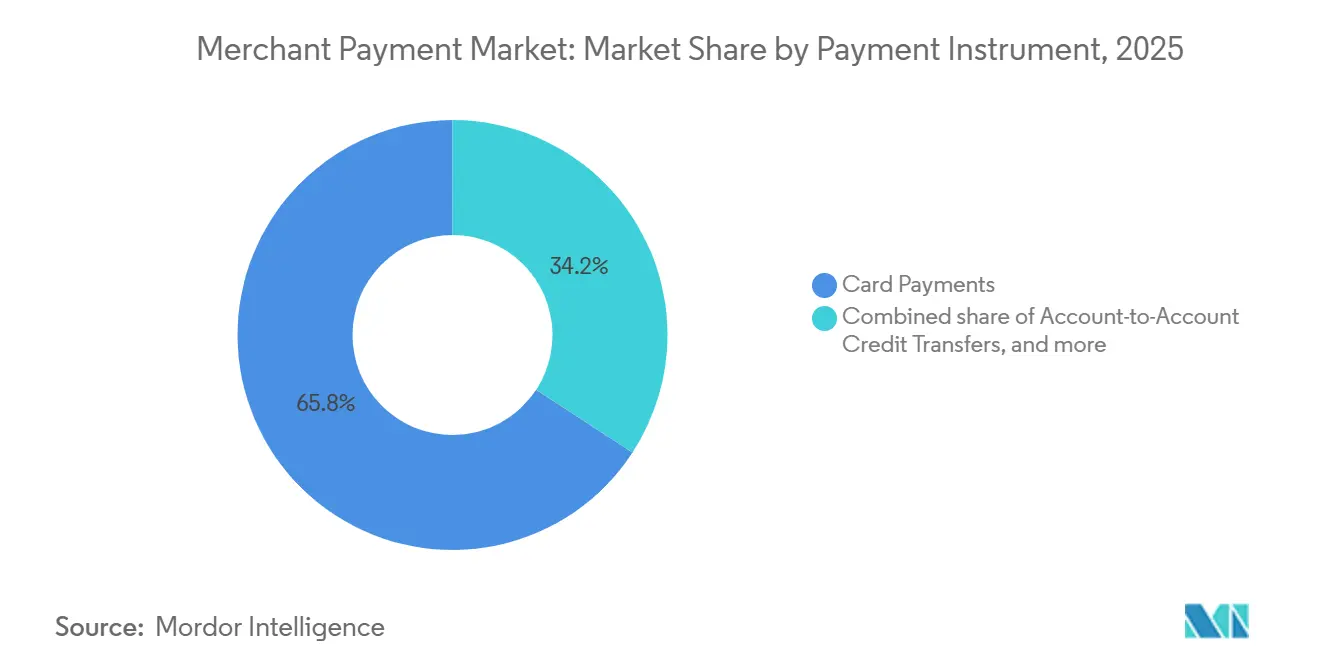
- By payment instrument, cards captured 65.8% of the merchant payment market share in 2025, while account-to-account credit transfers are projected to grow at 11.5% CAGR through 2031.
- By payer type, consumers accounted for 79.6% of the merchant payment market share in 2025, while business payers are projected to grow at 8.8% CAGR through 2031.
- By payment pattern, one-off payments captured 75.4% of the merchant payment market share in 2025, while recurring payments are projected to grow at 8.5% CAGR through 2031.
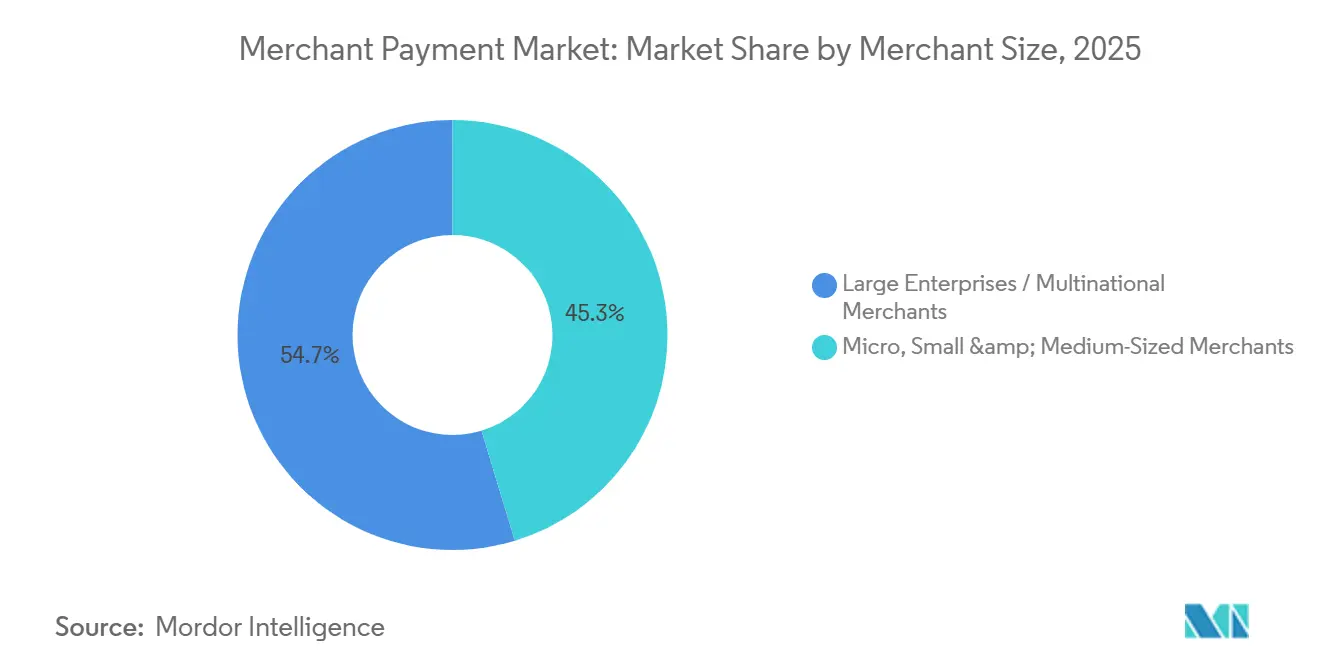
- By merchant size, large enterprises and multinational merchants captured 54.7% of the merchant payment market share in 2025, while micro and small and medium-sized enterprises are projected to grow at 7.2% CAGR through 2031.
- By end-user industry, retail and general merchandise captured 32.3% of the merchant payment market share in 2025, while media, entertainment, telecommunications, and digital content are projected to grow at 9.1% CAGR through 2031.
- By geography, Asia-Pacific captured 36.5% of the merchant payment market share in 2025, while South America is projected to grow at 8.3% CAGR through 2031.
Note: Market size and forecast figures in this report are generated using Mordor Intelligence’s proprietary estimation framework, updated with the latest available data and insights as of January 2026.
Global Merchant Payment Market Trends and Insights
Drivers Impact Analysis*
| Driver | (~) % Impact on CAGR Forecast | Geographic Relevance | Impact Timeline |
|---|---|---|---|
| E-Commerce and Omnichannel Payment Acceptance | +1.8% | Global, concentrated in North America, Europe, and Asia-Pacific e-commerce hubs | Short term (≤ 2 years) |
| Digital Wallet, QR, and Contactless Acceptance | +1.5% | Asia-Pacific, with expansion into the Middle East, Africa, and South America | Short term (≤ 2 years) |
| Real-Time and Account-to-Account Payments | +1.2% | Europe, South America, and the Asia-Pacific | Medium term (2-4 years) |
| Embedded Payments Through Platforms and Vertical Software | +1% | North America and the European Union, with early gains in the Asia-Pacific platforms | Medium term (2-4 years) |
| Cross-Border Acceptance and Local Payment Methods | +0.8% | Global, with the greatest effect in cross-border e-commerce corridors | Long term (≥ 4 years) |
| Payment Optimization, Fraud Prevention, and Intelligent Routing | +0.7% | Global, with regulatory influence from the European Union and the United States | Short term (≤ 2 years) |
| Source: Mordor Intelligence | |||
E-Commerce and Omnichannel Merchant Payment Acceptance
E-commerce growth and the convergence of online and physical retail are increasing merchant demand for integrated payment acceptance across checkout, refunds, returns, and exchanges. Digital wallets account for 66% of e-commerce transaction value and 38% of point-of-sale volume, highlighting the shift toward wallet-based payments[1]. The increasing importance of convenient returns, with 54% of consumers considering ease of returns when selecting merchants, is also encouraging merchants to connect payment data across channels. PCI DSS v4.0 enforcement has further increased the focus on secure and tokenized payment processing, supporting investment in integrated payment infrastructure. These developments are driving demand for unified acceptance platforms that simplify reconciliation, refunds, reporting, and customer transaction management across digital and physical channels.
Expansion of Digital Wallet, QR, and Contactless Merchant Acceptance
The rapid adoption of digital wallets, QR payments, and contactless transactions, particularly across Asia-Pacific, is expanding the range of payment methods merchants need to support. In 2025, 70% of consumers in Asia-Pacific preferred QR payments, while QR transactions are projected to represent 30% of digital payments in the region in 2026. The decline in reliance on physical wallets, with more than 36% of Singaporean shoppers reporting that they no longer carry one, is further accelerating digital payment adoption[2]. Partnerships between card networks and local wallets are enabling merchants to support domestic and international wallet payments through a more unified acceptance infrastructure. Consequently, merchants are investing in flexible payment acceptance solutions that accommodate local wallet, QR, and contactless preferences without requiring separate operating systems.
Growth of Real-Time and Account-to-Account Merchant Payments
The growing availability of real-time account-to-account payment infrastructure is encouraging merchants to adopt faster and potentially lower-cost alternatives to conventional card payments. India’s Unified Payments Interface processed more than 13 billion transactions monthly in 2026 and had more than 350 million active users, demonstrating the scale achievable through account-to-account payment ecosystems. The European Union’s Instant Payments Regulation, with key euro-area requirements applying from October 2025, is also expanding access to instant credit transfers[3]. In Brazil, merchants using Pix recorded average revenue growth of 16% and customer-base growth of 25% within six months, demonstrating the commercial benefits of account-to-account payments. These developments are driving merchants and payment platforms to integrate real-time payment methods alongside cards to reduce payment friction, improve collection efficiency, and reach digitally active consumers.
Embedded Payments Through Platforms, Marketplaces, and Vertical Software
Embedded payments are increasing the role of platforms, marketplaces, and vertical software providers in merchant payment acceptance. Toast’s combined annual run rate for subscription and payment services exceeded USD 2 billion in Q1 2026, growing 30% year over year, highlighting the increasing importance of payments within software-led merchant ecosystems. Payment data generated through embedded acceptance can also support adjacent services such as merchant lending, creating additional value for platforms and their customers. Shopify’s USD 4.2 billion in Capital originations during 2025, generated directly from merchant payment flows, demonstrates how payment relationships can extend into financial services[4]. As platforms combine software, payments, and financing, merchants are increasingly adopting integrated solutions that consolidate operational and financial services within a single platform.
Restraints Impact Analysis*
| Restraint | (~) % Impact on CAGR Forecast | Geographic Relevance | Impact Timeline |
|---|---|---|---|
| Merchant Fee Compression and Payment Economics | -1.8% | Global, with the highest near-term effect in North America, Australia, and the European Union | Short term (≤ 2 years) |
| Fraud, Chargebacks, and Real-Time Payment Scam Exposure | -1.4% | Global, with significant exposure in South America, Europe, and North America | Short term (≤ 2 years) |
| Regulatory Fragmentation and Data-Localization Requirements | -1.1% | Global, with higher impact in Europe, Asia-Pacific, and emerging markets with differing payment regulations | Medium term (2–5 years) |
| Legacy Payment Infrastructure and Merchant Reconciliation Complexity | -0.9% | Global, particularly relevant in emerging markets and fragmented retail ecosystems | Medium term (2–5 years) |
| Source: Mordor Intelligence | |||
Merchant Fee Compression and Payment Economics
Interchange regulation is putting pressure on merchant payment revenues as regulators and card networks reduce the fees associated with card transactions. Visa and Mastercard’s proposed USD 38 billion settlement in June 2026 would reduce average credit-card interchange by 10 basis points for five years and cap standard consumer credit-card rates at 1.25% for eight years. Australia’s Reserve Bank also announced lower domestic debit and consumer credit interchange caps from October 2026, alongside new caps for foreign-card interchange. The United Kingdom Payment Systems Regulator’s PS26/1 further requires greater card-scheme fee transparency, with substantive requirements taking effect from July 2027. These measures can compress payment providers’ blended take rates and margins, increasing reliance on value-added services such as fraud prevention, payment routing, reconciliation, and analytics to offset lower revenue per transaction.
Fraud, Chargebacks, and Real-Time Payment Scam Exposure
The rapid adoption of real-time payments is increasing fraud and scam exposure because completed account-to-account transfers can be difficult to reverse. Fraudulent instant-payment transactions in the European Economic Area increased 175% year over year, highlighting the growing risks associated with payment finality. Merchants therefore face greater pressure to identify suspicious transactions, particularly smaller and repeated fraudulent payments that can accumulate into material losses. Providers must strengthen transaction monitoring, authorization controls, dispute management, and refund processes across both card and real-time payment channels. Rising fraud-management requirements increase operating costs for merchants and payment providers and can slow adoption where businesses perceive real-time payment risks as outweighing the benefits.
*Our forecasts treat driver/restraint impacts as directional, not additive. The impact forecasts reflect baseline growth, mix effects, and variable interactions.
Segment Analysis
By Payment Instrument: Card Dominance Moderates as Account-to-Account Rails Accelerate
Cards held 65.8% of merchant payment volume in 2025 because card acceptance infrastructure remained widely available. Card rewards and loyalty programs also continued to support consumer use of credit cards. Account-to-account credit transfers are forecast to grow at 11.5% CAGR through 2031. This faster rate reflects the ability of account-to-account payments to avoid interchange costs. The merchant payment market size for card acceptance remains substantial, but growth is shifting toward alternatives that can be offered at checkout.
Direct debit, e-money, and stored-value wallets serve different payment needs. Recurring billing platforms use direct debit to reduce dispute exposure. E-money methods remain important in closed-loop payment settings, including African mobile money and Asian super-apps. The Instant Payments Regulation expanded instant credit-transfer access across 27 European Union member states from October 2025. The merchant payment market industry is adapting as bank infrastructure and payment orchestration services make these alternatives easier to present at checkout.
By Payer Type: Business Payments Digitize at Structurally Higher Velocity
Consumer payers held 79.6% of merchant payment volume in 2025, reflecting long-established consumer checkout systems. Consumer-led retail payments will continue to account for a large volume of merchant transactions. Business payers are forecast to grow at 8.8% CAGR through 2031. This growth indicates that digital payment tools are becoming more important for merchants serving enterprise buyers. The merchant payment market requires payment capabilities that can address both consumer and business collections.
Business-to-business transactions on Brazil’s Pix network reached 263 million in December 2025, up 50.3% from December 2024. Monthly business-to-business transfer value reached BRL 1.5 trillion (USD 240 billion) in December 2025. This activity shows the use of instant-payment infrastructure for commercial collections. Merchants increasingly need invoice, Automated Clearing House, and virtual-card capabilities alongside consumer checkout functions. The merchant payment market industry is responding as vertical platforms embed these functions instead of directing business flows through consumer application programming interfaces.
By Payment Pattern: Recurring Revenue Models Reshape Merchant Payment Infrastructure
One-off payments accounted for 75.4% of merchant payment volume in 2025 and remained the largest payment pattern by value. Recurring payments are forecast to grow at 8.5% CAGR through 2031. This expansion is linked to subscriptions across media, software as a service, healthcare, and utilities. Subscription revenue rose 12.6% in 2025 across the merchant and subscriber base covered by Recurly’s report. The merchant payment market size for recurring collections is therefore increasing faster than that of one-off collections.
Annual-plan subscribers generated 50% to 60% more revenue per user than monthly-plan subscribers in the same Recurly research. Mastercard found that 44% of United States consumers spent more on subscriptions in 2025, averaging USD 1,887 annually. Average monthly churn reached 20%, which increases the need for effective billing retries and collection processes. Pix Automático reached 1.9 million monthly transactions by March 2026 after its June 2025 launch. Stripe and Adyen have announced product roadmap investment in adaptive subscription billing, with enterprise early-access programs expected before the end of 2026.
By Merchant Size: Enterprise Scale Anchors Volume While Micro and Small Business Adoption Drives Growth
Large enterprises and multinational merchants captured 54.7% of the merchant payment market share in 2025. High-frequency retailers, airlines, hospitality groups, and global e-commerce operators accounted for much of this volume. Enterprise merchants accepted more than 5 e-commerce payment methods on average in 2026. Small and medium-sized businesses accepted 4.2 payment methods on average. This difference shows the wider acceptance capability available to larger merchants.
Micro, small, and medium-sized enterprises are projected to grow at 7.2% CAGR through 2031, above the overall merchant payment market rate. Safaricom’s merchant base across Lipa Na M-PESA and Pochi grew from 1.8 million to 3.1 million in 1 fiscal year, a 71.4% increase. This example shows how mobile money acceptance can bring cash-dependent micro-businesses into formal digital payments. It also illustrates the potential for acceptance systems that address smaller merchants. Payment providers can support this shift through tools designed for low-cost and simple acceptance.
By End-User Industry: Retail Anchors Volume While Digital Content Subscriptions Drive Growth
Retail and general merchandise held 32.3% of the merchant payment market share in 2025. Physical retail and e-commerce both rely on extensive card payment infrastructure. Retail remains a major source of transaction volume for the merchant payment market. Merchants in this sector require payment systems that work in stores and online. They also need acceptance methods that support returns and customer service.
Media, entertainment, telecommunications, and digital content are projected to grow at 9.1% CAGR through 2031, the fastest rate among the listed end-user industries. Subscription activity in streaming, gaming, and digital publishing supports this performance, and Netflix reported USD 45.2 billion in revenue during 2025, a 16% year-over-year increase. Restaurants, food service, travel, and transport are adopting SoftPOS and smart point-of-sale terminals that allow checkout to move closer to the customer. Healthcare merchants are also moving from checks and paper invoices toward recurring Automated Clearing House and card-on-file workflows. Financial services and bill-pay merchants use direct debit and account-to-account transfers, where loyalty rewards create less resistance to consumer switching.
Geography Analysis
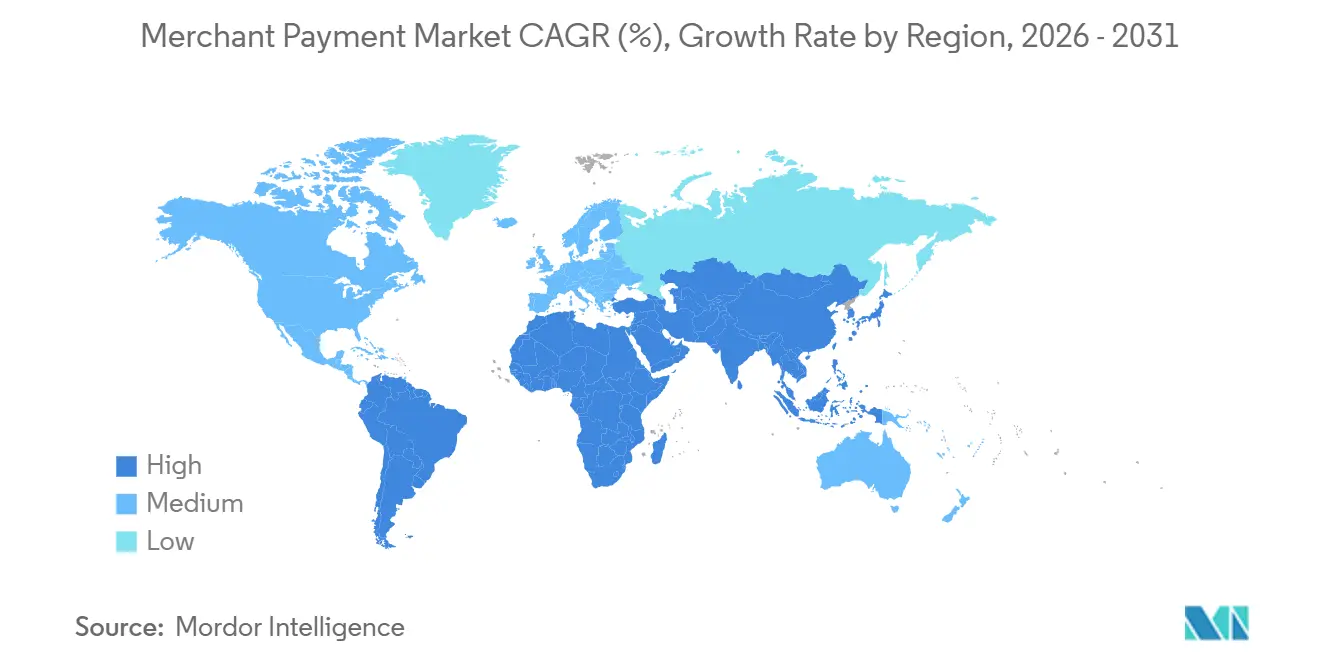
Asia-Pacific held 36.5% of merchant payment volume in 2025. China’s wallet-based commerce, India’s Unified Payments Interface, and Southeast Asia’s QR payment systems support this position. India processed more than 13 billion Unified Payments Interface transactions per month in 2026 across more than 350 million active users. Digital wallets represented 77% of the Asia-Pacific e-commerce payment value in China. In Singapore, 36% of shoppers no longer carry a physical wallet, while PayPay exceeded 70% e-commerce coverage in Japan.
South America is projected to grow at 8.3% CAGR through 2031, making it the fastest-growing geography in the merchant payment market. Pix represented 55% of all payment transactions in Brazil by the end of 2025, while combined credit and debit cards represented 26%. EBANX projected that Pix will account for 45% of Brazil’s online sales by the end of 2026 and 50% by 2028. Argentina’s Mercado Pago, Mexico’s SPEI and OXXO Pay, and Colombia’s PSE extend real-time payment access across the region. Pix fraud losses rose 70% to BRL 4.9 billion (USD 0.88 billion), creating demand for anti-fraud payment technology.
Europe combines gradual card-market change in Western Europe with faster account-to-account adoption in Central and Eastern Europe. Fee parity under the Instant Payments Regulation removed the earlier EUR 2.19 (USD 2.37) premium on instant payments from October 2025. North America is developing its dual-rail instant-payment infrastructure, while mobile money merchant acceptance is expanding in the Middle East and Africa. Safaricom processed USD 525.6 billion in financial-service transactions in the year to March 2026, and MTN MoMo merchant payment value rose 14.5% to USD 12.7 billion in H1 2026.
Competitive Landscape
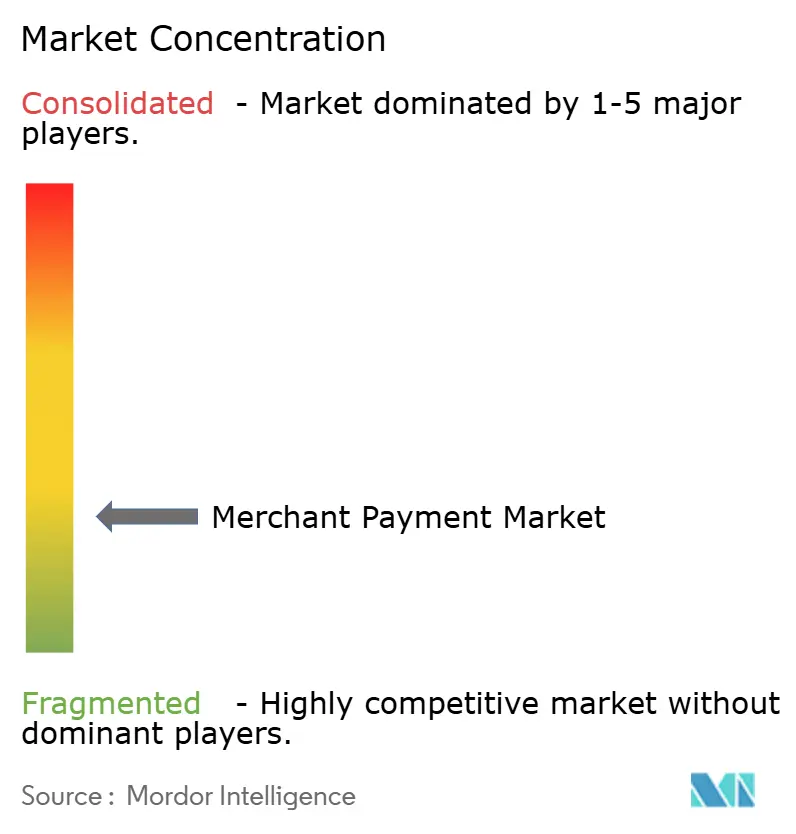
The merchant payment market is fragmented among small and micro-merchants. Global Payments completed its USD 24.25 billion acquisition of Worldpay in January 2026. The combined business processes USD 3.7 trillion in annual volume for more than 6 million merchants across 175 countries. This transaction created the largest pure-play merchant acquirer and changed competitive positioning among major acquirers. Fiserv recorded 5% GAAP revenue growth in Merchant Solutions during 2025, while Clover's gross payment volume grew 10% excluding gateway conversions.
Fiserv expanded its Mastercard Commerce Hub integration to offer multichannel merchant services through one platform. The company targets enterprise merchants that might otherwise split volume among Adyen, Stripe, and Global Payments Worldpay. Adyen processed EUR 803.8 billion (USD 940.4 billion) in H1 2026, up 24% year over year, and reported EUR 1,302.9 million (USD 1,524.4 million) in net revenue, up 19%. Its single-platform model continues to attract enterprise merchants seeking authorization optimization across regions. Stripe processed USD 1.9 trillion in 2025, up 34% year over year. Software-led providers are competing with established acquirers by integrating acceptance, billing, fraud management, and merchant data tools.
Razorpay launched Vulcan in June 2026, an artificial intelligence payments foundation model trained on 4 billion transactions. The product combines transaction routing, fraud detection, and checkout personalization. Visa launched Intelligent Authorisation in Europe with partners including Worldline and Elavon to improve routing optimization and fraud alerts. Worldline is selling non-core operations in India, New Zealand, Australia, and parts of Europe to fund the modernization of its core platform. Opportunities remain in cross-border acceptance of emerging-market payment methods, unified reconciliation for multi-rail deployments, and real-time settlement, where fraud reversibility remains unresolved.
Merchant Payment Industry Leaders
-
Fiserv, Inc.
-
JPMorgan Chase & Co.
-
Worldpay, Inc
-
Global Payments Inc.
-
Adyen N.V.
- *Disclaimer: Major Players sorted in no particular order
Recent Industry Developments
- September 2026: Worldline launched a payment handler for the Universal Commerce Protocol (UCP), developed with Google, enabling merchants to accept AI-initiated (agentic) purchases from multiple platforms through a unified setup on its Global Collect cross-border platform, positioning Worldline as one of the first European acquirers to support agentic commerce.
- September 2026: Mastercard launched Wallet Pay, a new service enabling over 3.7 billion Mastercard credentials to connect to digital wallets globally, with early partnerships including TenPay Global (Tencent) to enable international wallets at tens of millions of Weixin Pay merchant locations in mainland China, broadening cross-border QR interoperability.
- August 2026: Worldline finalized the divestment of its 51% stake in ANZ Worldline Payment Solutions to ANZ Bank for an enterprise value of approximately EUR 107 million (USD 116 million), completing its strategic exit from the Australian market while retaining a technology and software services agreement with ANZ.
- June 2026: Mastercard's Scam Merchant Monitoring Program (SMMP) became enforceable globally for all card-not-present merchants, introducing a combined refund-and-chargeback trigger of 5% of total transactions over a rolling 30-day window, adding a third card-network monitoring overlay to the existing Excessive Chargeback Program and Excessive Fraud Merchant programs.
Global Merchant Payment Market Report Scope
| Card Payments |
| Account-to-Account Credit Transfers |
| Direct Debit and Other Merchant Pull |
| E-money and Stored-Value |
| Other Merchant Instruments |
| Consumer |
| Business |
| One-Off Payments |
| Recurring Payments |
| Micro, Small & Medium-Sized Merchants |
| Large Enterprises / Multinational Merchants |
| Retail & General Merchandise |
| Restaurants & Food Service |
| Travel, Lodging & Hospitality |
| Transport, Fuel, Mobility & Logistics |
| Healthcare |
| Media, Entertainment, Telecom & Digital Content |
| Financial Services, Insurance & Bill-Pay Merchants |
| Education, Government & Utilities |
| Professional, Wholesale, B2B & Other Commercial |
| North America | United States |
| Canada | |
| Mexico | |
| South America | Brazil |
| Argentina | |
| Rest of South America | |
| Europe | United Kingdom |
| Germany | |
| France | |
| Italy | |
| Spain | |
| Rest of Europe | |
| Asia-Pacific | China |
| Japan | |
| India | |
| South Korea | |
| Australia | |
| Indonesia | |
| Thailand | |
| Malaysia | |
| Singapore | |
| Vietnam | |
| Rest of Asia-Pacific | |
| Middle East and Africa | Saudi Arabia |
| United Arab Emirates | |
| Turkey | |
| South Africa | |
| Egypt | |
| Rest of Middle East and Africa |
| By Payment Instrument | Card Payments | |
| Account-to-Account Credit Transfers | ||
| Direct Debit and Other Merchant Pull | ||
| E-money and Stored-Value | ||
| Other Merchant Instruments | ||
| By Payer Type | Consumer | |
| Business | ||
| By Payment Pattern | One-Off Payments | |
| Recurring Payments | ||
| By Merchant Size | Micro, Small & Medium-Sized Merchants | |
| Large Enterprises / Multinational Merchants | ||
| By End-User Industry | Retail & General Merchandise | |
| Restaurants & Food Service | ||
| Travel, Lodging & Hospitality | ||
| Transport, Fuel, Mobility & Logistics | ||
| Healthcare | ||
| Media, Entertainment, Telecom & Digital Content | ||
| Financial Services, Insurance & Bill-Pay Merchants | ||
| Education, Government & Utilities | ||
| Professional, Wholesale, B2B & Other Commercial | ||
| By Geography | North America | United States |
| Canada | ||
| Mexico | ||
| South America | Brazil | |
| Argentina | ||
| Rest of South America | ||
| Europe | United Kingdom | |
| Germany | ||
| France | ||
| Italy | ||
| Spain | ||
| Rest of Europe | ||
| Asia-Pacific | China | |
| Japan | ||
| India | ||
| South Korea | ||
| Australia | ||
| Indonesia | ||
| Thailand | ||
| Malaysia | ||
| Singapore | ||
| Vietnam | ||
| Rest of Asia-Pacific | ||
| Middle East and Africa | Saudi Arabia | |
| United Arab Emirates | ||
| Turkey | ||
| South Africa | ||
| Egypt | ||
| Rest of Middle East and Africa | ||
Key Questions Answered in the Report
What is the projected size of the merchant payment market by 2031?
The merchant payment market is projected to reach USD 63.4 trillion by 2031, growing at a 6.2% CAGR from 2026.
Which payment method holds the largest share of merchant transactions?
Cards held 65.8% of merchant payment volume in 2025, supported by widespread acceptance infrastructure and card-reward programs.
Which merchant payment method is growing the fastest?
Account-to-account credit transfers are projected to grow at 11.5% CAGR through 2031 as merchants seek alternatives to interchange-based card payments.
Which region leads merchant payment activity?
Asia-Pacific held 36.5% of merchant payment volume in 2025, supported by digital wallets, QR payments, and India’s Unified Payments Interface.
What is the fastest-growing geographic area for merchant acceptance?
South America is projected to grow at 8.3% CAGR through 2031, with Brazil’s Pix network supporting the region’s payment activity.
What challenges affect payment acceptance providers?
Interchange fee restrictions, fraud, chargebacks, and scams on real-time payment systems are increasing the need for fraud controls and more diversified service revenue.