
Merchant Cash Advance Market Size and Share
Market Overview
| Study Period | 2020 - 2031 |
|---|---|
| Market Size (2026) | USD 46.10 Billion |
| Market Size (2031) | USD 68.10 Billion |
| Growth Rate (2026 - 2031) | 8.10 % |
| Fastest Growing Market | Asia-Pacific |
| Largest Market | North America |
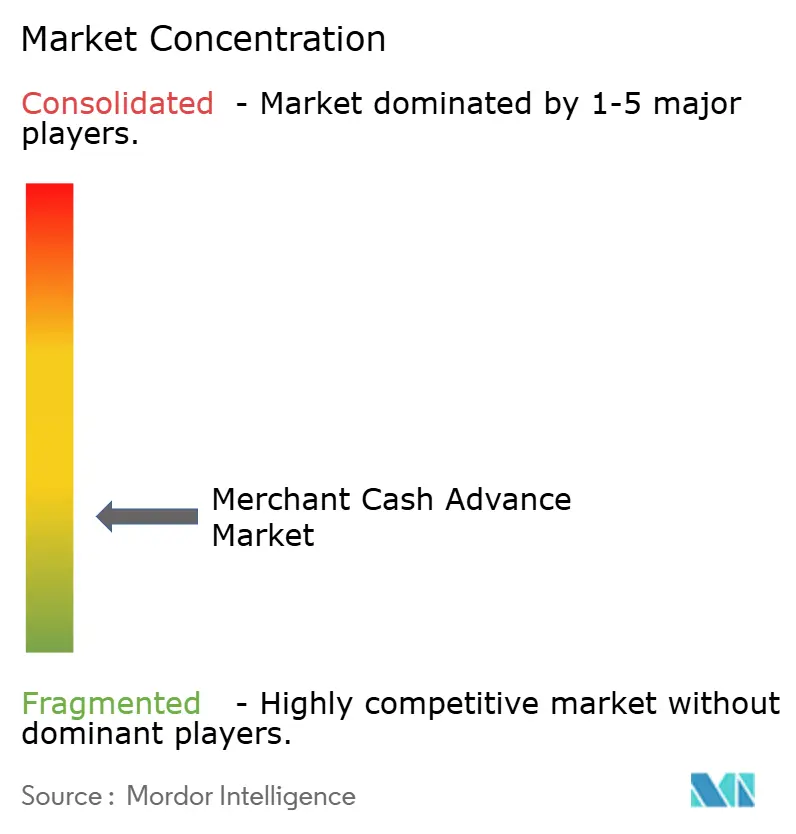
| Market Concentration | Low |
Major Players *Disclaimer: Major Players sorted in no particular order Image © Mordor Intelligence. Reuse requires attribution under CC BY 4.0. | |
Merchant Cash Advance Market Analysis by Mordor Intelligence
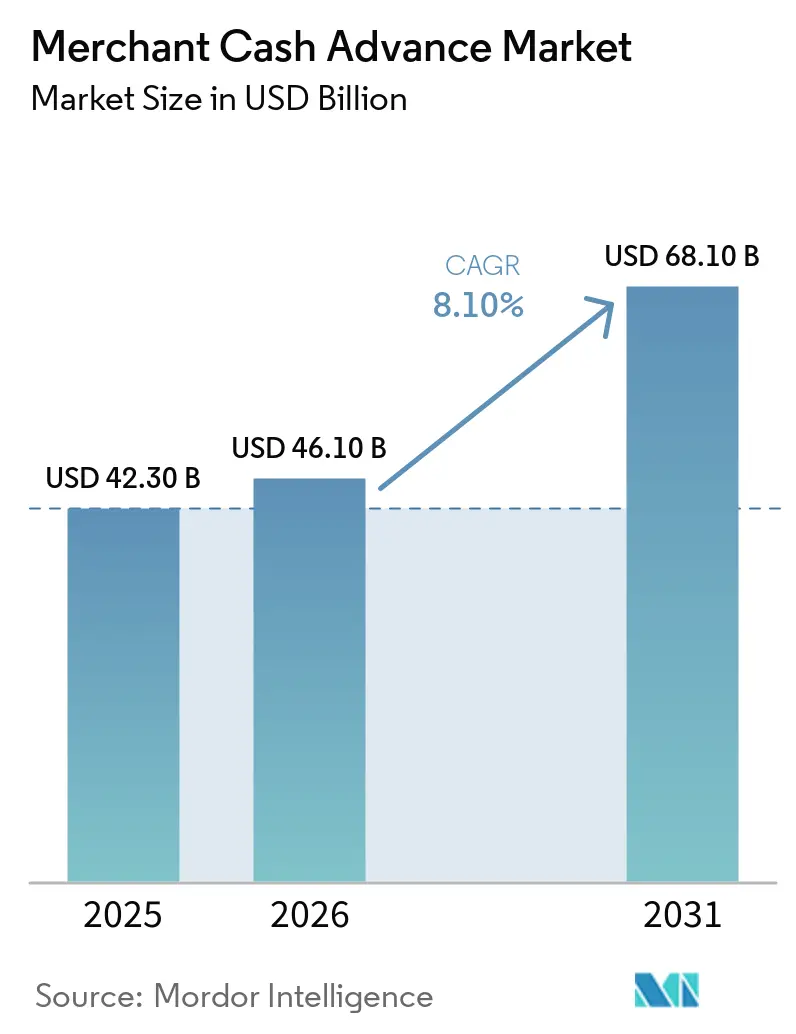
The Merchant Cash Advance Market size was valued at USD 42.30 billion in 2025 and is estimated to grow from USD 46.10 billion in 2026 to reach USD 68.10 billion by 2031, at a CAGR of 8.10% during the forecast period (2026-2031).
Merchant cash advances fit businesses whose sales change during the year because repayments move with card settlements instead of following a fixed monthly schedule. The Federal Reserve found that 1 in 3 financing applicants had a funding gap in 2025, while use of online fintech lenders increased to 29% from 17% in 2020. This gap supports demand for financing that does not depend on collateral or a long credit record. Payment platforms are also changing how providers reach merchants because they can use existing transaction data to make pre-approved offers. Regulatory disclosures and scrutiny of financing costs remain important limits on adoption, particularly for smaller broker networks.
Key Report Takeaways
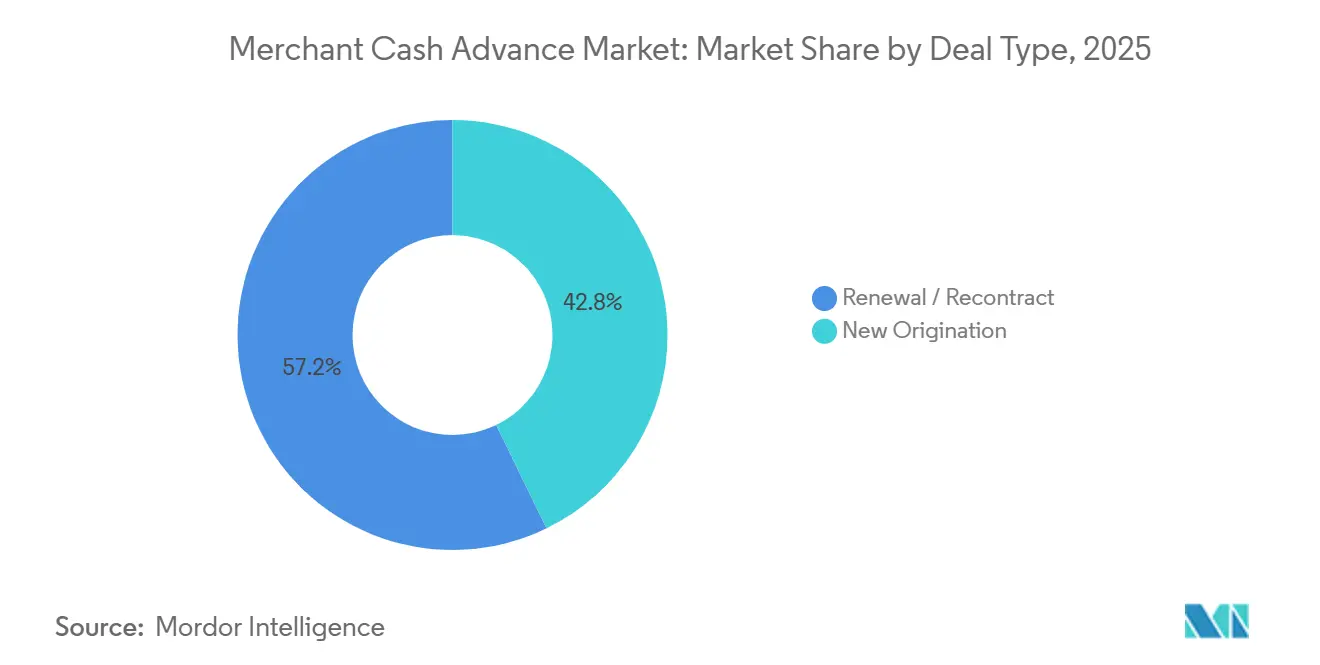
- By deal type, renewal and recontract deals captured 57.2% of the merchant cash advance market share in 2025, while new originations are projected to grow at a 9.7% CAGR through 2031.
- By enterprise size, micro and small enterprises held 72.1% of the merchant cash advance market share in 2025 and are projected to grow at an 8.9% CAGR through 2031.
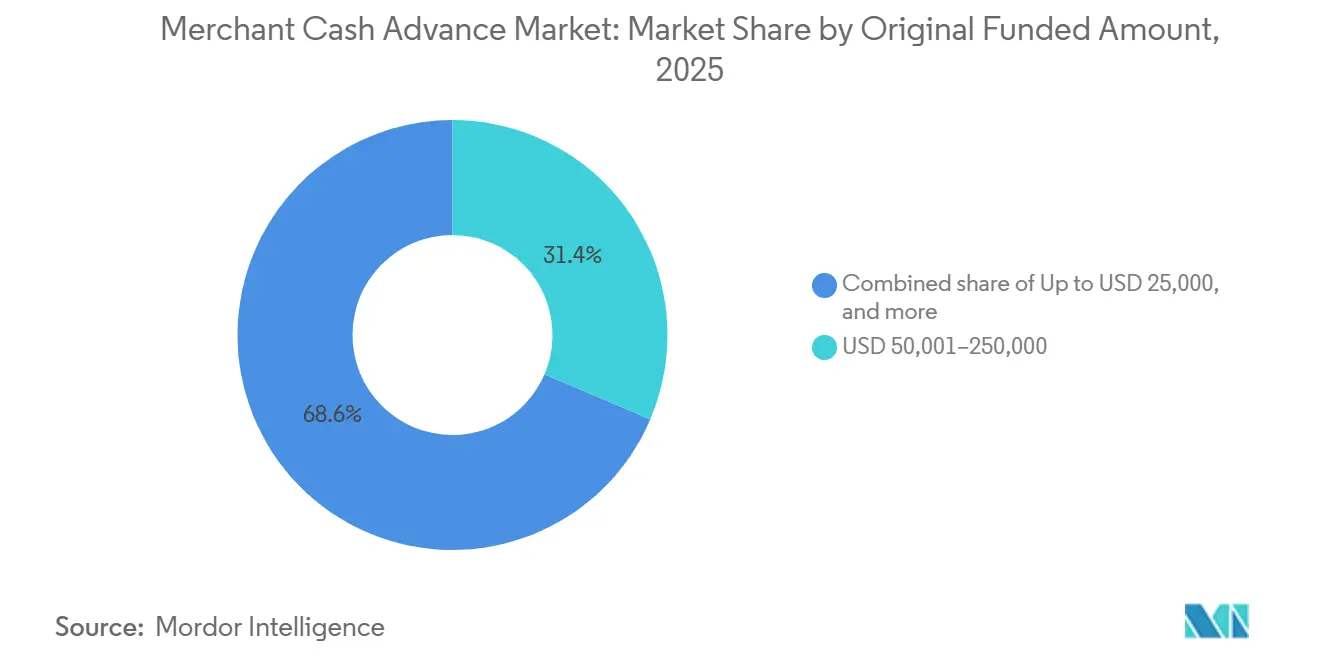
- By original funded amount, the USD 50,001-250,000 band accounted for 31.4% of the merchant cash advance market size in 2025, while advances up to USD 25,000 are forecast to expand at a 10.4% CAGR through 2031.
- By end-user industry, retail and e-commerce captured 24.7% of the merchant cash advance market size in 2025 and is projected to grow at a 9.6% CAGR through 2031.
- By geography, North America accounted for 81.3% of the merchant cash advance market size in 2025, while Asia-Pacific is forecast to grow at a 12.7% CAGR through 2031.
Note: Market size and forecast figures in this report are generated using Mordor Intelligence’s proprietary estimation framework, updated with the latest available data and insights as of January 2026.
Global Merchant Cash Advance Market Trends and Insights
Drivers Impact Analysis*
| Driver | (~) % Impact on CAGR Forecast | Geographic Relevance | Impact Timeline |
|---|---|---|---|
| Fast Funding for Merchants with Uneven Cash Flows | +1.4% | Global, concentrated in North America and the Asia-Pacific | Short term (≤ 2 years) |
| Growth in Digital Card and Merchant Payment Transactions | +1.8% | Global, particularly Asia-Pacific, with spillover to the Middle East and Africa | Medium term (2-4 years) |
| Embedded Offers Through Payment and POS Platforms | +1.5% | North America and Europe, with early gains in Southeast Asia | Medium term (2-4 years) |
| Small-Business Gaps in Conventional Credit | +1.3% | Global | Long term (≥ 4 years) |
| Real-Time Transaction-Based Underwriting and Automated Decisioning | +1.0% | North America and Asia-Pacific | Medium term (2-4 years) |
| Digital Merchant Acquiring and Alternative Working-Capital Financing | +0.8% | Asia-Pacific, with spillover to the Middle East, Africa, and South America | Long term (≥ 4 years) |
| Source: Mordor Intelligence | |||
Fast Working-Capital Funding for Merchants with Uneven Cash Flows
Seasonal sales patterns in food service, retail, and hospitality create funding needs that fixed loan repayments may not suit. A merchant cash advance adjusts remittances to daily card receipts, which helps businesses manage periods when revenue is lower. Operating expenses were the leading reason for financing among 56% of small-business applicants in the 2025 survey. This use case makes the merchant cash advance market relevant for routine cash-flow planning rather than only emergency funding. Renewal and recontract activity held a 57.2% share in 2025, showing that many merchants return after completing an advance cycle. Standardized disclosure rules in 10 United States states may also help merchants compare products more clearly before accepting an offer.
Growth in Digital Card and Merchant Payment Transactions
More card and digital-wallet payments provide the transaction records used to assess a merchant's cash flow. Visa processed 257.5 billion transactions in fiscal 2025, which was 10% higher than the prior year[1]. Visa Direct processed 12.6 billion transactions in the same year, up 27%, which points to faster growth in real-time payment activity. These payment records can support faster underwriting and more informed pricing for the merchant cash advance market. Retailers and e-commerce sellers usually have frequent settlements and detailed sales records, which support pre-approved financing offers. Growing digital merchant acquiring also broadens the potential borrower base in Asia-Pacific, the Middle East, Africa, and South America.
Embedded MCA Offers Through Payment and POS Platforms
Payment and point-of-sale platforms are moving financing offers into the systems that merchants already use every day. Shopify Capital originated USD 4.2 billion in merchant cash advances in 2025, up from USD 3 billion in 2024. The company uses a merchant's store transaction history to present offers through the Shopify dashboard. This approach reduces separate application steps and can lower customer acquisition costs for the provider. It also puts broker-dependent funders at a disadvantage when platforms reach the merchant before a broker does. QashierLoans, launched in Singapore in June 2025, disbursed more than USD 10 million to over 100 small and medium-sized enterprises using point-of-sale data and daily sales deductions[2].
Continued Small-Business Access Gaps in Conventional Credit
Bank credit remains difficult to obtain for many smaller businesses, particularly those that lack collateral or several years of financial records. The Federal Reserve reported that 22% of applicants received no financing in 2025 and that credit availability remained difficult for more than 1 in 4 small firms. Personal guarantees were used by 59% of small-business borrowers with outstanding debt, and 51% pledged business assets as security. These requirements are harder for younger and smaller businesses to meet. Automated underwriting based on payment and bank-statement data can make lower-value advances more economical to process. The merchant cash advance industry, therefore, remains closely linked to gaps in traditional small-business financing.
Restraints Impact Analysis*
| Restraint | (~) % Impact on CAGR Forecast | Geographic Relevance | Impact Timeline |
|---|---|---|---|
| High Financing Costs and Limited Pricing Transparency | -1.2% | Global, concentrated in North America | Short term (≤ 2 years) |
| Scrutiny of Contracts, Disclosures, and Receivables-Purchase Structures | -0.9% | North America, with early influence in Europe and the Asia-Pacific | Medium term (2-4 years) |
| Repayment Stacking and Merchant Cash-Flow Compression | -0.7% | Global | Short term (≤ 2 years) |
| Dependence on Transaction Data and Payment-Platform Access | -0.5% | Global | Long term (≥ 4 years) |
| Source: Mordor Intelligence | |||
High Effective MCA Financing Costs and Limited Pricing Transparency
High financing costs and unclear pricing remain barriers for merchants considering an advance. The Federal Reserve reported that 60% of businesses using online lenders experienced higher-than-expected costs, compared with 37% at small banks and 32% at large banks. This difference points to the importance of clear pricing information, not only the absolute cost of financing. California's SB 362, effective January 1, 2026, requires providers to disclose the annualized cost again when a charge, pricing metric, or financing amount is presented to a prospective recipient. These rules increase compliance work during sales interactions and in automated application flows. Providers with built-in disclosure processes can manage this burden more easily than smaller independent sales organizations, while repayment stacking can further strain merchant cash flow.
Regulatory Scrutiny of MCA Contracts, Disclosures, and Receivables-Purchase Structures
The legal distinction between a loan and a purchase of future receivables continues to shape the merchant cash advance market. Texas House Bill 700 took effect in September 2025 and covers sales-based commercial financing below USD 1 million[3]. The law requires disclosure of total repayment, fees, and broker compensation, while it does not establish an annual percentage rate or finance-charge cap. Texas rules published in 2026 require providers and brokers to register through the Nationwide Multistate Licensing System by December 31, 2026. The Consumer Financial Protection Bureau's May 2026 final rule excluded merchant cash advances from Section 1071 small-business data collection requirements, providing greater clarity around this product category. Providers also depend on continued access to merchant transaction data, so platform access remains a long-term operating risk.
*Our forecasts treat driver/restraint impacts as directional, not additive. The impact forecasts reflect baseline growth, mix effects, and variable interactions.
Segment Analysis
By Deal Type: Renewals Support Volume and New Originations Change Customer Acquisition
Renewal and recontract deals captured 57.2% of market volume in 2025. This share shows the value of repeat relationships in the merchant cash advance market. Merchants often return to a provider before a prior advance has been fully remitted when the product has met working-capital needs. New originations are projected to grow at a 9.7% CAGR from 2026 to 2031. Embedded offers inside payment platforms make the first financing interaction easier because merchants do not need to complete a separate application. These offers use payment history already available to the platform to assess the merchant. Shopify Capital's USD 4.2 billion in 2025 originations illustrate the scale that can be reached through a platform with an existing merchant base.
Independent sales organizations and brokers remain important for merchants outside platform ecosystems. State commercial-financing rules in California, New York, and Texas require disclosure of broker compensation, which can affect broker fee structures. New platform-linked originations can involve smaller advances and transaction-verified customers. Broker-sourced advances can have larger average funded amounts, but merchants may also face greater repayment-stacking risk. Direct platform distribution gives a provider early access to the merchant relationship. The merchant cash advance market is therefore shifting toward direct distribution through payment platforms. Providers seeking new customers need deeper platform connections rather than a larger broker network alone.
By Enterprise Size: Micro and Small Firms Remain the Main Demand Base
Micro and small enterprises held 72.1% of market volume in 2025 and are forecast to grow at an 8.9% CAGR through 2031. The combination of the largest share and the highest growth rate makes this group central to the merchant cash advance market. Small firms can struggle to meet bank requirements for collateral, personal guarantees, and long operating histories. This makes speed and simpler qualification requirements important product features. Their financing needs also tend to be closely tied to day-to-day operating expenses. Medium-sized and large enterprises represent the remaining volume. Their growth is slower because they can access revolving credit, Small Business Administration-backed lending, and commercial paper more readily.
Transaction-based underwriting supports advances below USD 25,000 by reducing manual review needs. Providers can use point-of-sale transaction feeds, bank-statement application programming interfaces, and current revenue data to assess smaller merchants. This process lets funders evaluate recent sales activity instead of relying only on conventional financial records. QashierLoans used proprietary point-of-sale data to provide more than USD 10 million to over 100 Singapore-based small and medium-sized enterprises after its June 2025 launch. California SB 362 and New York's Commercial Finance Disclosure Law require disclosure practices that apply across enterprise sizes. Clearer comparisons can be particularly useful for smaller merchants that have fewer resources to evaluate financing options. These conditions keep micro and small businesses at the center of the merchant cash advance industry.
By Original Funded Amount: Mid-Tier Advances Lead While Smaller Advances Grow Faster
The USD 50,001-250,000 funded-amount band accounted for 31.4% of market volume in 2025. This band aligns with common small and medium-sized enterprise needs for seasonal inventory, equipment, and staffing. It offers a balance between merchant demand and the returns needed by funders. Advances up to USD 25,000 are forecast to grow at a 10.4% CAGR through 2031. Smaller advances can address near-term operating needs without requiring a larger facility. Point-of-sale and e-commerce platforms can approve and disburse these smaller advances with limited manual involvement. The USD 25,001-50,000 band serves businesses that have moved beyond very small advances but may not yet qualify consistently for the mid-tier range.
Funders assess each funded amount range differently because merchant revenue patterns and repayment capacity vary by ticket size. Smaller advances are better suited to automated review because each decision must be made efficiently. Mid-tier advances can support recurring operating needs that are larger than a short-term liquidity gap. Providers need enough transaction history to assess repayment from future receivables. The availability of recent payment information is important across all ticket sizes. Advances above USD 500,000 overlap with revenue-based lending and asset-backed working-capital products. This range is served by a narrower group of specialists where relationship-based assessment remains important.
By End-User Industry: Retail and E-Commerce Lead Demand and Growth
Retail and e-commerce captured 24.7% of end-user industry volume in 2025 and are projected to grow at a 9.6% CAGR through 2031. Frequent card acceptance and daily settlement cycles give funders consistent data for underwriting. Seasonal inventory purchases also create recurring working-capital needs for these merchants. This data can also help providers time offers around sales activity. Restaurants, food services, and hospitality form the second-largest end-user group. Thin operating margins and seasonal demand make variable remittance structures relevant for these businesses. Healthcare and personal care providers also use this financing, where insurance reimbursements create revenue delays of 30 to 90 days.
Construction, contractors, and building services can have higher single-advance default risk because their cash receipts depend on project completion and milestone payments. This can limit volume even where the sector has significant working-capital needs. Professional services, transportation and logistics, and manufacturing are gradually increasing digital payment acceptance. More electronic payments can make transaction-based underwriting more practical in these sectors. Industry-specific payment patterns affect how funders assess repayment risk. Specialized offers can be structured around healthcare reimbursement cycles or construction payroll needs. These niche approaches provide room for providers that can use sector-specific payment information instead of relying on general underwriting models.
Geography Analysis
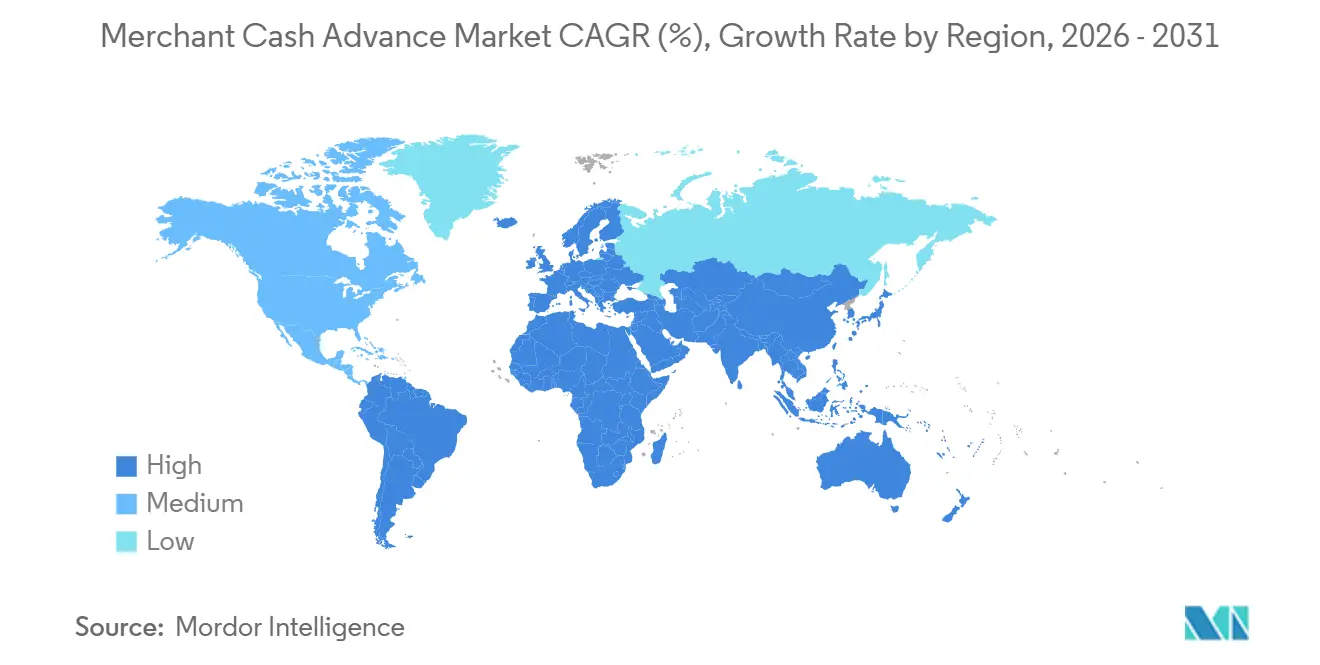
North America accounted for 81.3% of the global merchant cash advance market size in 2025. The region has established independent sales organizations and broker networks, widespread card acceptance, and access to institutional syndication capital. The United States remains the center of origination activity. Canada is developing as the next-tier market through the expansion of embedded revenue-based financing programs for more than 202,000 small and medium-sized businesses in March 2026. Mexico offers a longer-term opportunity as digital payments increase among informal merchants. The region's established payments environment supports both broker-led and platform-led origination. Multi-state United States disclosure requirements are changing how independent sales organization networks manage compliance and are favoring providers that can automate these workflows.
Asia-Pacific is forecast to grow at a 12.7% CAGR from 2026 to 2031, the fastest rate among the regions. India's Unified Payments Interface processed 24,162 crore transactions in fiscal year 2025-26, representing 30% year-on-year growth. This payment infrastructure creates a substantial real-time transaction record for merchant underwriting. Southeast Asian providers are expanding platform-based origination, including Qashier's point-of-sale-based lending in Singapore. These payment rails can make sales-based remittances easier to administer for merchants and providers. China's merchant financing ecosystem is primarily embedded within Alibaba, Tencent, and JD Finance platforms. This distribution approach continues to influence newer platform entrants across Southeast Asia.
Europe has a meaningful share of activity outside North America, with the United Kingdom as the region's most established revenue-based financing market. The United Kingdom has an established fintech environment and a mature revenue-based financing ecosystem. CrediNord secured more than EUR 10 million (USD 11.1 million) in June 2026 to expand embedded financing through the myPOS network in Europe, starting in the Netherlands. YouLend's partnership with REA Card extends revenue-based financing to offline retail merchants in Germany using point-of-sale data. These examples show the use of merchant payment data in European financing offers. South America remains at an earlier stage, while Brazil and Argentina offer potential because of informal merchant activity and expanding card acceptance. The Middle East and Africa have longer-term potential as the United Arab Emirates and Saudi Arabia's payment infrastructure and fintech investment programs create more merchant transaction data.
Competitive Landscape
The merchant cash advance market is fragmented among specialist funders, but competition is increasingly divided between data-native platforms and broker-led originators. CAN Capital, Credibly, Fora Financial, Kapitus, National Funding, and Forward Financing compete through pricing, decision speed, and independent sales organization reach. Payment processors can offer financing directly to merchants using their transaction information. This threatens the traditional customer-acquisition role of broker networks. Platform programs can make offers within the same environment where merchants manage payments and sales. Shopify Capital illustrates this model through USD 4.2 billion in 2025 originations delivered through its existing merchant platform. The merchant cash advance market is consequently rewarding providers that control a direct merchant relationship and have current sales data.
Institutional funding is becoming more important to competitive positioning in 2026. Providers with access to durable funding can support a larger volume of merchant advances. This affects both the scale of origination and the ability to compete on financing terms. It can also reduce reliance on a provider's own balance sheet for new funding. Wayflyer and affiliates of Fortress Investment Group announced a 3-year USD 1.5 billion forward-flow agreement in July 2026. The agreement provides Wayflyer with a total committed deployment capacity of USD 4.5 billion over 24 months. This arrangement shows how alternative small-business lenders can use institutional partnerships to support their lending capacity.
Compliance capability is also becoming a competitive requirement. California SB 362, New York's Commercial Finance Disclosure Law, and Texas House Bill 700 require providers to manage disclosure and registration duties across jurisdictions. Automated compliance processes can reduce the operating burden compared with manual methods. This capability becomes more valuable as providers operate across a larger number of states. In the merchant cash advance market, these processes can support consistent disclosures across distribution channels. There is also room for products designed around healthcare billing cycles, construction payroll bridges, and other sector-specific cash-flow patterns. Cost simulation tools can help merchants understand repayment obligations before accepting funding. Open-banking tools could eventually help merchants that use several payment providers share transaction data more easily.
Merchant Cash Advance Industry Leaders
-
Block, Inc.
-
Shopify Inc.
-
PayPal Holdings Inc.
-
American Express Company
-
Stripe, Inc.
- *Disclaimer: Major Players sorted in no particular order
Recent Industry Developments
- July 2026: Wayflyer and funds managed by affiliates of Fortress Investment Group announced a three-year, USD 1.5 billion forward-flow agreement under which Fortress will purchase credit assets originated through the Wayflyer platform, giving the Irish fintech total committed deployment capacity of USD 4.5 billion over 24 months. The deal is among the largest institutional capital commitments to non-bank alternative small and medium-sized enterprise lending on record.
- June 2026: Stewards reported that its business model includes the origination and funding of merchant cash advances and related financing solutions for small and medium-sized businesses, supported by direct marketing, referral networks, broker relationships, and strategic partnerships. The development reflects the continued institutionalization and multi-channel distribution of MCA funding.
- January 2026: California's SB 362 came into effect, requiring merchant cash advance and commercial financing providers to re-disclose the annualized cost metric whenever a charge, pricing metric, or financing amount is stated during the application process, materially increasing real-time compliance requirements for sales teams and automated origination workflows.
Global Merchant Cash Advance Market Report Scope
| New Origination |
| Renewal / Recontract |
| Micro and Small Enterprises |
| Medium-Sized Enterprises |
| Large Enterprises |
| Up to USD 25,000 |
| USD 25,001–50,000 |
| USD 50,001–250,000 |
| USD 250,001–500,000 |
| Above USD 500,000 |
| Retail and E-Commerce |
| Restaurants, Food Services and Hospitality |
| Healthcare and Personal Care Services |
| Construction, Contractors and Building Services |
| Professional and Business Services |
| Transportation, Logistics and Automotive Services |
| Manufacturing and Wholesale |
| Travel, Leisure and Entertainment |
| Other Merchant Businesses |
| North America | United States |
| Canada | |
| Mexico | |
| South America | Brazil |
| Argentina | |
| Rest of South America | |
| Europe | United Kingdom |
| Germany | |
| France | |
| Italy | |
| Spain | |
| Rest of Europe | |
| Asia-Pacific | China |
| Japan | |
| India | |
| South Korea | |
| Australia | |
| Indonesia | |
| Thailand | |
| Malaysia | |
| Singapore | |
| Vietnam | |
| Rest of Asia-Pacific | |
| Middle East and Africa | Saudi Arabia |
| United Arab Emirates | |
| Turkey | |
| South Africa | |
| Egypt | |
| Rest of Middle East and Africa |
| By Deal Type | New Origination | |
| Renewal / Recontract | ||
| By Enterprise Size | Micro and Small Enterprises | |
| Medium-Sized Enterprises | ||
| Large Enterprises | ||
| By Original Funded Amount | Up to USD 25,000 | |
| USD 25,001–50,000 | ||
| USD 50,001–250,000 | ||
| USD 250,001–500,000 | ||
| Above USD 500,000 | ||
| By End-User Industry | Retail and E-Commerce | |
| Restaurants, Food Services and Hospitality | ||
| Healthcare and Personal Care Services | ||
| Construction, Contractors and Building Services | ||
| Professional and Business Services | ||
| Transportation, Logistics and Automotive Services | ||
| Manufacturing and Wholesale | ||
| Travel, Leisure and Entertainment | ||
| Other Merchant Businesses | ||
| By Geography | North America | United States |
| Canada | ||
| Mexico | ||
| South America | Brazil | |
| Argentina | ||
| Rest of South America | ||
| Europe | United Kingdom | |
| Germany | ||
| France | ||
| Italy | ||
| Spain | ||
| Rest of Europe | ||
| Asia-Pacific | China | |
| Japan | ||
| India | ||
| South Korea | ||
| Australia | ||
| Indonesia | ||
| Thailand | ||
| Malaysia | ||
| Singapore | ||
| Vietnam | ||
| Rest of Asia-Pacific | ||
| Middle East and Africa | Saudi Arabia | |
| United Arab Emirates | ||
| Turkey | ||
| South Africa | ||
| Egypt | ||
| Rest of Middle East and Africa | ||
Key Questions Answered in the Report
What is the projected size of the merchant cash advance market by 2031?
The merchant cash advance market is projected to reach USD 68.1 billion by 2031, growing at an 8.1% “growing at a CAGR of 8.1% from 2026 to 2031.
Which deal type leads merchant cash advance financing?
Renewal and recontract deals led with 57.2% of market volume in 2025, while new originations are forecast to grow at 9.7% CAGR through 2031.
Why do small businesses use merchant cash advances?
Businesses use them for working capital when sales vary, since remittances can adjust with daily card receipts and conventional credit remains difficult for many small firms.
Which business size uses merchant cash advances most?
Micro and small enterprises held 72.1% of market volume in 2025 and are forecast to grow at 8.9% CAGR through 2031.
Which region is growing fastest for merchant cash advances?
Asia-Pacific is forecast to grow at 12.7% CAGR through 2031, supported by expanding digital payment activity and platform-based financing.
What factors limit adoption of merchant cash advances?
Higher-than-expected financing costs, pricing transparency concerns, repayment stacking, regulation, and dependence on transaction-data access can limit adoption.