MEMS Market Size and Share
Market Overview
| Study Period | 2020 - 2031 |
|---|---|
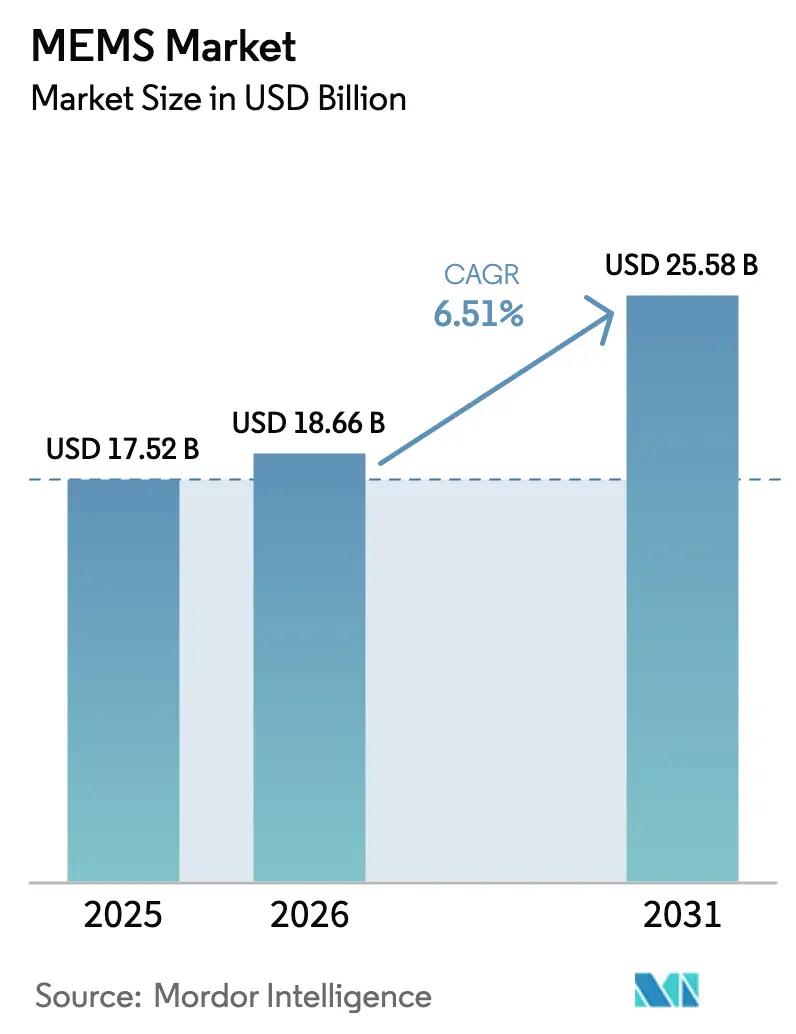
| Market Size (2026) | USD 18.66 Billion |
| Market Size (2031) | USD 25.58 Billion |
| Growth Rate (2026 - 2031) | 6.51% CAGR |
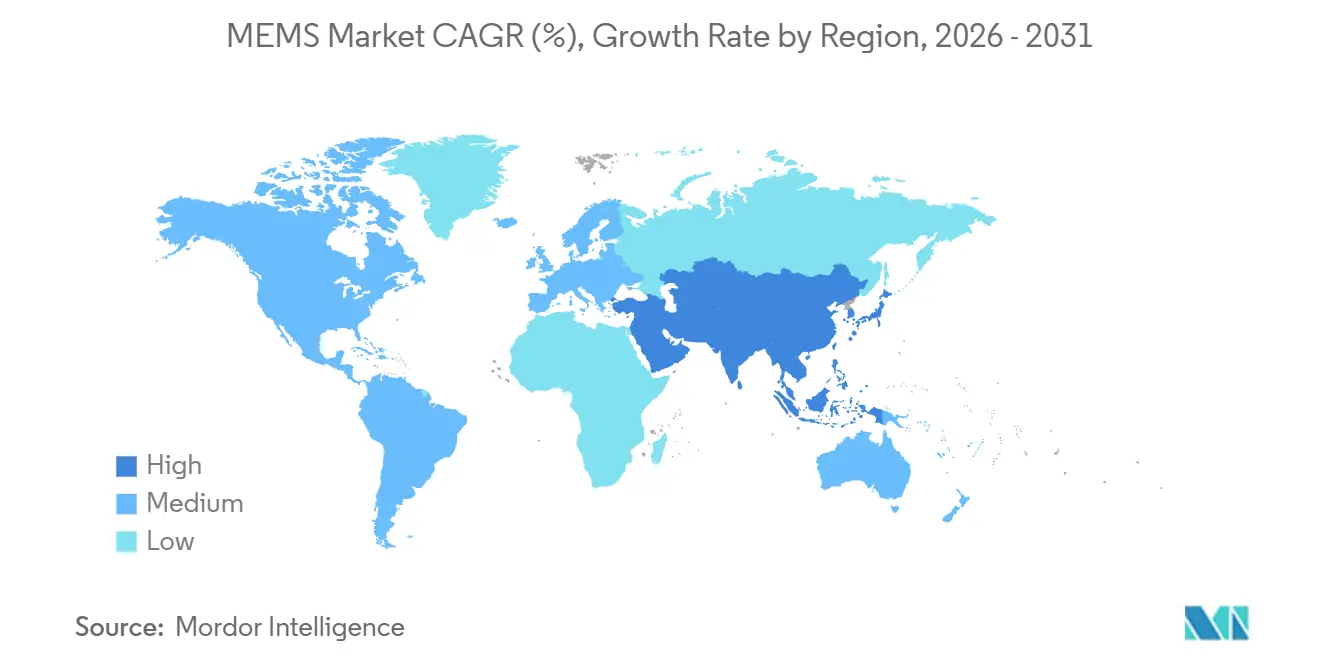
| Fastest Growing Market | Asia Pacific |
| Largest Market | Asia Pacific |
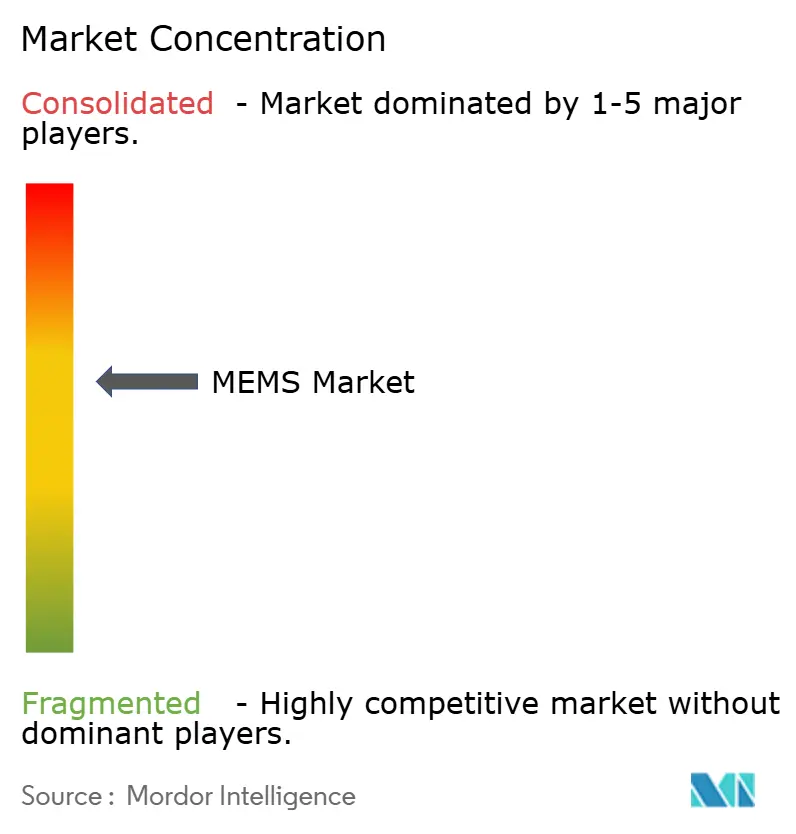
| Market Concentration | Medium |
Major Players *Disclaimer: Major Players sorted in no particular order Image © Mordor Intelligence. Reuse requires attribution under CC BY 4.0. | |
MEMS Market Analysis by Mordor Intelligence
The MEMS Market size is expected to grow from USD 17.52 billion in 2025 to USD 18.66 billion in 2026 and is forecast to reach USD 25.58 billion by 2031 at 6.51% CAGR over 2026-2031. Smartphones, wearables, electric vehicles, and point-of-care diagnostics drive volume shipments, while the transition to 300 mm wafer manufacturing steadily lowers die costs. Rapid 5G roll-outs expand demand for RF-MEMS filters and switches that offer lower insertion loss, and edge-AI gateways now specify multi-sensor clusters to reduce cloud latency. Continuous glucose monitors, lab-on-chip cartridges, and piezo-MEMS speakers exemplify how adjacent healthcare and audio segments create new revenue streams. Growth nonetheless faces challenges from foundry capacity constraints, high upfront capital expenditures, and rising royalty costs for RF-MEMS intellectual property.
Key Report Takeaways
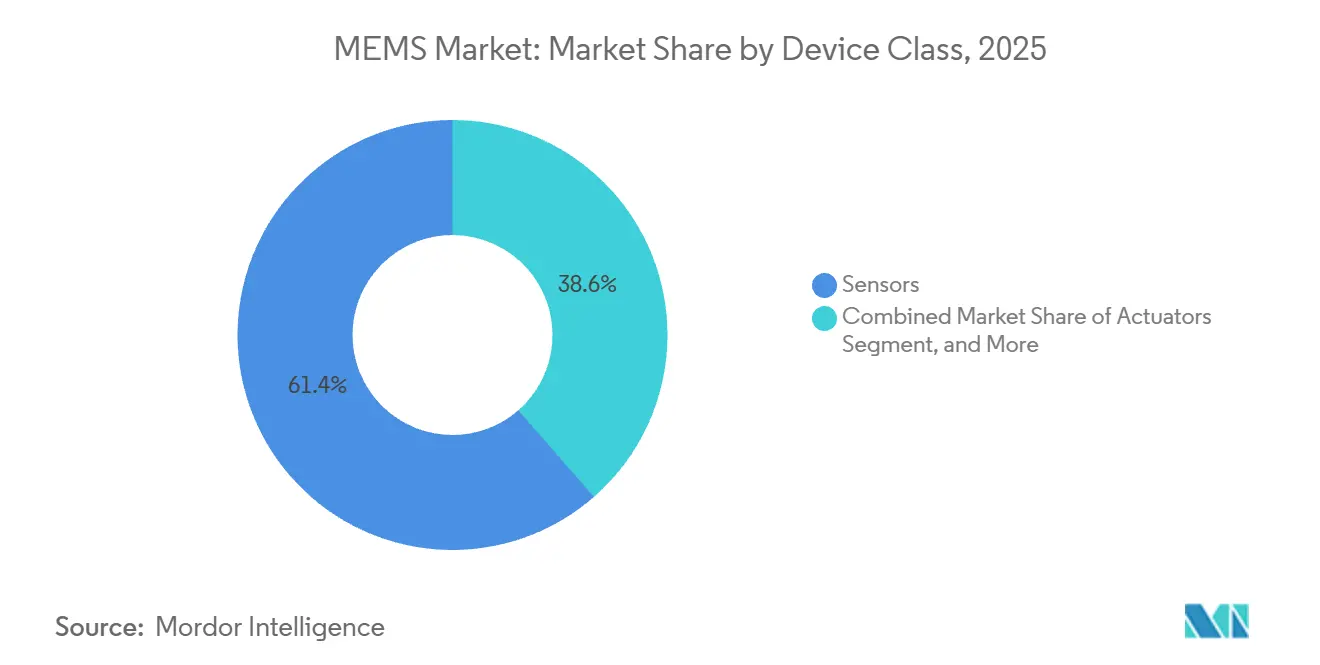
- By device class, sensors led with 61.43% of MEMS market share in 2025; microfluidic chips are forecast to advance at a 7.23% CAGR through 2031.
- By application, consumer electronics held 38.37% of the MEMS market size in 2025, while healthcare and medical devices are set to expand at a 7.53% CAGR through 2031.
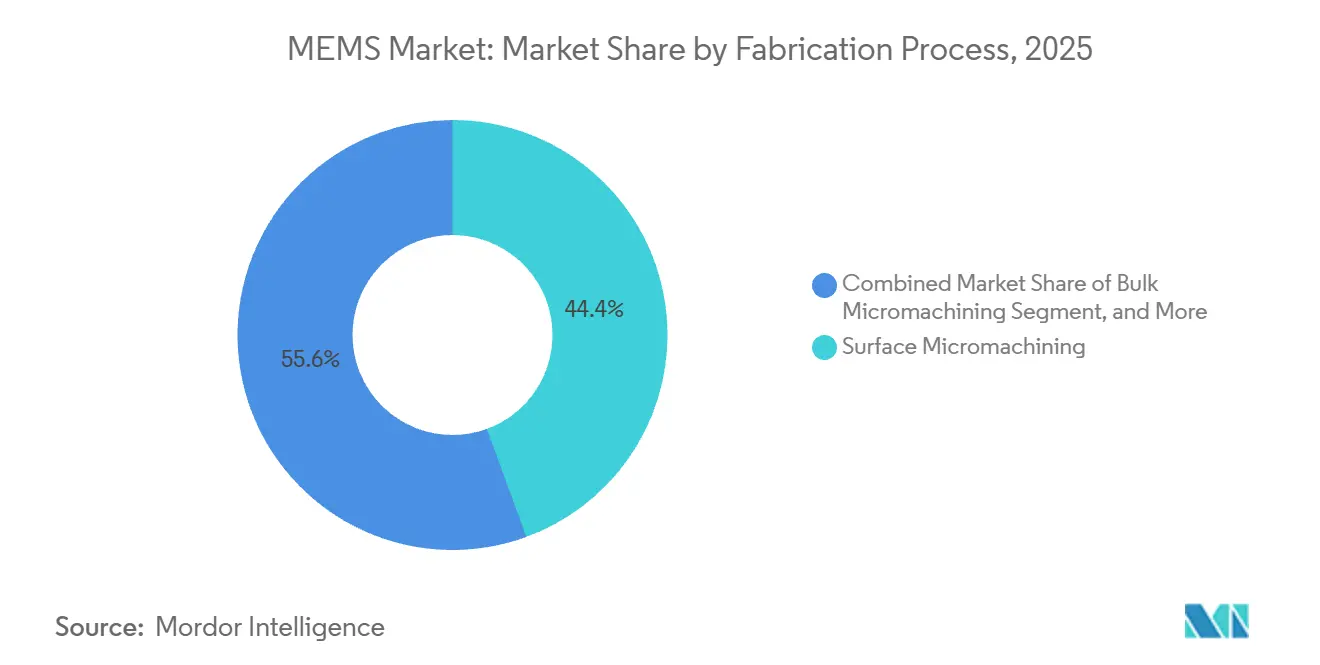
- By fabrication process, surface micromachining captured 44.42% revenue share in 2025; LIGA is projected to grow at a 7.12% CAGR through 2031.
- By material, silicon accounted for 72.37% of the MEMS market share in 2025, whereas polymers are expected to rise at an 8.12% CAGR over the forecast period.
- By geography, the Asia Pacific region dominated with 52.31% of the 2025 revenue and is poised to sustain a 7.13% CAGR through 2031.
Note: Market size and forecast figures in this report are generated using Mordor Intelligence’s proprietary estimation framework, updated with the latest available data and insights as of January 2026.
Global MEMS Market Trends and Insights
Drivers Impact Analysis*
| Driver | (~) % Impact on CAGR Forecast | Geographic Relevance | Impact Timeline |
|---|---|---|---|
| Sensor proliferation in IoT edge nodes | +1.2% | Global, with APAC and North America leading deployments | Medium term (2-4 years) |
| Expanding MEMS content per EV for ADAS safety | +1.5% | North America, Europe, China | Medium term (2-4 years) |
| 5G adoption boosting RF-MEMS filters and switches | +1.0% | Global, concentrated in APAC telecom infrastructure | Short term (≤2 years) |
| Transition to 300 mm wafer-level MEMS manufacturing | +0.9% | APAC core (Taiwan, Japan), spill-over to North America | Long term (≥4 years) |
| Growth of microfluidic bio-MEMS for point-of-care diagnostics | +0.8% | North America and Europe, expanding to MEA | Medium term (2-4 years) |
| Ultra-low-power piezo-MEMS speakers for hearables | +0.6% | Global, led by consumer-electronics hubs in APAC | Short term (≤2 years) |
| Source: Mordor Intelligence | |||


Sensor Proliferation in IoT Edge Nodes
Edge gateways now embed five to eight MEMS devices compared with two to three just three years ago, enabling on-device vibration analysis, gas detection, and temperature monitoring. Qualcomm’s 2025 IoT services suite pairs MEMS accelerometers with machine-learning models that cut false alarms by 40%. Sub-USD 20 sensor nodes built around RISC-V microcontrollers lower adoption barriers. Smart-agriculture deployments illustrate scale benefits as soil-moisture and weather sensors relay filtered data locally before cloud upload. Fragmented firmware standards still slow system integration and extend product-qualification cycles.
Expanding MEMS Content per EV for ADAS Safety
Level-3 autonomous sedans now integrate 18-22 MEMS devices, up from 12 in conventional cars, to comply with ISO 26262 functional-safety mandates. TDK’s IAM-20685 module embeds a self-test circuit that flags drift in 10 ms, satisfying Tier-1 fail-operational requirements. Electromechanical brake-by-wire systems require high-precision pressure sensors sampling at 1 kHz, while China’s 2026 tire-pressure mandate adds 25 million units of annual demand. Regional fabrication concentration in Germany and Japan, however, exposes automakers to supply-chain disruptions.
5G Adoption Boosting RF-MEMS Filters and Switches
Qorvo’s RF-MEMS switch achieves 0.3 dB insertion loss at 28 GHz, doubling coverage radius versus PIN-diode designs. Broadcom shipped 50 million tunable capacitors for smartphone antenna matching in 2025. Murata’s acquisition of filter IP shortens boards by 40%. IEEE’s 2025 reliability protocol addresses contact fatigue after 10 billion cycles.[1]IEEE Standards Association, “IEEE Std 2888-2025,” standards.ieee.org Price-sensitive markets in India and Southeast Asia still favor conventional filters, tempering near-term RF-MEMS penetration.
Transition to 300 mm Wafer-Level MEMS Manufacturing
Silex’s Jarfalla fab now etches 300 mm wafers, cutting die costs by 30-40% and enabling the production of 120 million inertial sensors per year. GlobalWafers committed USD 500 million to expand the SOI supply in Missouri. TSMC added MEMS to its 28nm platform, providing wearables with access to logic and sensors on a single die. Retooling a 200 mm line can exceed USD 200 million, deterring smaller foundries and leaving niche devices on legacy substrates. Standardized design rules remain elusive, extending development cycles by up to nine months.
Restraints Impact Analysis*
| Restraint | (~) % Impact on CAGR Forecast | Geographic Relevance | Impact Timeline |
|---|---|---|---|
| High up-front capex for specialty process lines | -0.7% | Global, acute in regions with limited government subsidies | Long term (≥4 years) |
| Lack of foundry-grade design rules and standards | -0.5% | Global, particularly affecting smaller foundries and fabless startups | Medium term (2-4 years) |
| Supply risk for Sc-doped AlN and other niche materials | -0.4% | Global, concentrated in North America and Europe aerospace programs | Medium term (2-4 years) |
| RF-MEMS IP thickets escalating royalty costs | -0.3% | Global, most severe in North America and Europe | Short term (≤2 years) |
| Source: Mordor Intelligence | |||
High Up-Front Capex for Specialty Process Lines
Outfitting a single 200 mm bay with deep-reactive ion-etch and wafer-bond tools cost Rogue Valley Microdevices USD 180 million in 2025. Unlike CMOS fabs that amortize spend across diverse chips, a MEMS line supports narrow families, limiting diversification. CHIPS and European Chips Acts channel subsidies to established players, yet startups still face eight-figure entry costs. Requalifying automotive or medical processes can take 18 months, so foundries resist modifications, slowing innovation.
Lack of Foundry-Grade Design Rules and Standards
SEMI’s 2025 survey found that 62% of fabless MEMS startups required at least two mask revisions, compared to 18% for CMOS peers.[2]SEMI, “MEMS and Sensors Industry Group Report 2025,” semi.org Proprietary trench-depth and stress-gradient rules require designers to relayout when switching suppliers, resulting in non-recurring engineering charges of up to USD 500,000 per device. The MEMS Industry Group’s reference flows remain voluntary, resulting in inconsistent yield benchmarking. The absence of standardized test structures obscures the true die yield and complicates cost comparisons.
*Our forecasts treat driver/restraint impacts as directional, not additive. The impact forecasts reflect baseline growth, mix effects, and variable interactions.
Segment Analysis
By Device Class: Sensors Anchor Revenue While Microfluidics Surge
Sensors dominated the MEMS market with a 61.43% share in 2025, as inertial modules shipped in billion-unit volumes for smartphones and vehicles. Microfluidic chips drive the fastest 7.23% CAGR because decentralized diagnostics rely on disposable cartridges that compress test cycles from days to minutes. Unit economics favor sensor volumes, yet margins on lab-on-chip consumables remain high, enticing diversified suppliers to add microfluidic foundry capacity. Actuators such as ink-jet heads see mature replacement cycles that limit growth, while MEMS oscillators benefit from 5G timing-synch requirements. Emerging power harvesters stay niche because conversion efficiencies sit below 10%, but adoption rises in remote industrial nodes where battery swaps are costly.
The expanding microfluidic segment widens the addressable healthcare customer base. Abbott’s Illinois facility expansion underlines cartridge demand as emergency departments adopt bedside blood-gas tests. Regulatory pathways under FDA 510(k) clearance shorten time-to-market for incremental bio-MEMS, reinforcing incumbent advantages. Meanwhile, commoditization pressures sensors, pushing vendors toward on-chip fusion and machine learning to justify pricing. The contrast illustrates how the MEMS market bifurcates into volume-driven sensors and high-margin, application-specific microfluidics, each demanding distinct fabrication roadmaps.


By Sensor and Actuator Type: Inertial Dominance Meets Microphone Innovation
Inertial sensors held a 42.53% share in 2025 as accelerometers and gyros underpin phone screen rotation, fitness tracking, and automotive stability control. MEMS microphones are projected to post an 8.31% CAGR as voice assistants migrate from flagship to mid-tier devices, with 70 dB signal-to-noise ratios enabling far-field commands. Pressure sensors maintain a steady demand for tire-pressure monitoring systems and ventilators, while RF-MEMS components continue to rise with the adoption of 5G, yet remain cost-sensitive. Optical MEMS address projection and LiDAR niches where performance premiums offset lower volumes.
GoerTek shipped 1.2 billion microphones in 2025, challenging Knowles in terms of cost and miniaturization. Average selling prices for consumer accelerometers slipped below USD 0.50, prompting suppliers to embed sensor-fusion engines for differentiation. RF-MEMS suppliers face royalty stacking as Qorvo and Broadcom defend patent estates, raising barriers for new entrants. The mix of commodity inertial devices and high-value microphones underscores the MEMS market’s segmentation and varying innovation levers.
By Application: Healthcare Outpaces Consumer Electronics
Consumer electronics accounted for 38.37% of 2025 revenue, driven by persistent demand for smartphones and wearables. Healthcare and medical devices are forecast to grow 7.53% through 2031 as continuous glucose monitors, insulin pumps, and diagnostic cartridges shift care from hospitals to homes. Automotive EV platforms integrate 18-22 MEMS units for ADAS, battery, and cabin monitoring, creating a stable medium-term growth pillar. Industrial robotics harness vibration sensors for predictive maintenance that cuts downtime, whereas 5G infrastructure requires RF-MEMS filters and oscillators for agile base stations.
Apple’s announced integration of glucose sensing into Apple Watch expands MEMS bio-sensor penetration beyond diabetic populations. Medtronic’s MiniMed pump validates the accuracy of pressure sensors in closed-loop insulin delivery. Meanwhile, telecom demand may flatten after macro-cell coverage targets are met, redirecting RF-MEMS growth toward in-building repeaters for enterprises. The application view shows healthcare overtaking consumer as sensor content per device climbs and reimbursement models embrace preventive monitoring.
By Fabrication Process: Surface Micromachining Leads, LIGA Gains Traction
Surface micromachining accounted for 44.42% of 2025 revenue, as it leverages CMOS tools, co-integrating MEMS and logic to reduce board area. Deep-reactive ion etch remains indispensable for gyroscopes needing 50-100 µm trenches, while bulk micromachining underpins pressure-sensor diaphragms. LIGA, projected to grow at a 7.12% CAGR through 2031, leverages X-ray lithography to deliver sub-micron metal structures critical for RF-MEMS switches cycling billions of times. Silicon-on-insulator substrates reduce parasitics in timing devices yet carry 3-5x wafer premiums.
TDK’s roadmap favors surface-micromachined accelerometers with on-chip filters, trimming external components by 30%. LIGA's reliance on synchrotron facilities concentrates production at limited sites, posing supply risk but offering unmatched tolerances. Atomic-layer deposition of scandium-doped aluminum nitride promises superior piezoelectric coupling, though throughput limits adoption to high-value segments. Process diversity reflects how MEMS market size optimization weighs cost, performance, and equipment accessibility.
By Material: Silicon Dominance Faces Polymer Disruption
Silicon retained 72.37% MEMS market share in 2025 thanks to mature bulk and surface micromachining that reuses CMOS infrastructure. Polymers exhibit the fastest 8.12% CAGR as roll-to-roll fabrication enables disposable microfluidic cartridges and flexible wound-monitoring patches. Piezoelectrics such as aluminum nitride empower speakers and RF filters, while compound semiconductors target high-temperature aerospace sensors. Metals remain essential for electrodes, yet gold contact degradation drives research into ruthenium coatings.
Scandium-doped aluminum nitride, which increases piezoelectric coefficients by 50%, faces supply bottlenecks because only three sputtering-target vendors meet aerospace purity standards. Polymer MEMS leverage SU-8 and PDMS for low-cost single-use tests, a key advantage as healthcare shifts toward at-home diagnostics. Lead-based piezoelectrics confront looming European REACH restrictions, steering development toward lead-free alternatives. Material choices thus evolve in response to regulatory, performance, and cost constraints, reshaping supplier strategies within the broader MEMS industry.
Geography Analysis
Asia Pacific led with 52.31% of 2025 revenue and will advance at a 7.13% CAGR through 2031. China’s tire-pressure mandate adds 25 million pressure sensors annually,[3]Ministry of Industry and Information Technology, “Automotive Regulations,” miit.gov.cn while Japan and Taiwan specialize in piezoelectric thin films and 28 nm MEMS-logic co-integration, respectively. South Korea’s vertically integrated microphone supply to global smartphone brands shortens lead times and reinforces regional dominance. India and Southeast Asia represent fast-growing, price-sensitive markets that increasingly adopt mid-tier devices with inertial sensors but defer premium features such as always-on voice activation.
North America contributed roughly 23% of 2025 turnover, underpinned by automotive, defense, and medical clusters. CHIPS Act subsidies of USD 52 billion earmark funds for domestic MEMS lines, with Rogue Valley Microdevices securing USD 75 million to expand Oregon capacity. FDA 510(k) pathways enable 12-month commercialization cycles for medical MEMS, accelerating revenue visibility. High labor costs still drive high-volume smartphone sensors offshore, but specialty devices and defense inertial units remain local for security reasons.
Europe held about 18% share, anchored by Germany’s automotive sensor triad of Bosch, Infineon, and Continental. The EUR 43 billion European Chips Act funds 300 mm upgrades at X-FAB, supporting sub-USD 2 accelerometer goals for ADAS. France’s STMicroelectronics supplies multi-sensor modules to global wearables, while the U.K.’s Cambridge cluster incubates optical MEMS startups for LiDAR and augmented-reality displays. Regulatory frameworks under RoHS and REACH raise qualification hurdles for lead-based and certain polymer materials, shaping supplier material roadmaps. South America, Middle East, and Africa collectively account for under 7%, driven by Brazil’s automotive demand, UAE smart-city projects, and South Africa’s mining sensors, yet growth is constrained by import tariffs and infrastructure gaps.

Competitive Landscape
The MEMS arena exhibits a moderate concentration, with the five largest vendors controlling slightly more than 60% of the aggregate revenue across inertial sensors and microphones. Bosch, STMicroelectronics, TDK InvenSense, Knowles, and GoerTek hold the commanding positions because they operate proprietary process flows, enjoy long automotive and smartphone design wins, and maintain global sales channels. Outside these leaders, dozens of mid-tier specialists focus on optical micro-mirrors, RF-MEMS switches, and microfluidic cartridges, creating a long competitive tail where market share is diffuse. This bifurcation leaves room for niche innovators even as scale economics favor established brands.
Technology strategy has become the core differentiator. Bosch and STMicroelectronics leverage full vertical integration, running captive 200 mm and 300 mm fabs that secure supply and enable rapid design tweaks for Tier-1 customers. In contrast, fabless challengers such as xMEMS and USound outsource production to specialty foundries, concentrating R&D on piezoelectric transducer design and speeding up time-to-market. Patent density, particularly in RF-MEMS, heightens entry barriers; overlapping switch and tunable-capacitor portfolios force smaller entrants to license or pivot away from contested sub-segments. Participation in IEEE and ISO working groups further advantages incumbent contributors who shape reliability and test protocols to align with their fabrication strengths.
Regional dynamics inject additional complexity. Chinese suppliers such as AAC Technologies and GoerTek combine low-cost labor with state subsidies, enabling aggressive pricing that has already eroded Western share in microphones. European firms pursue consolidation and joint ventures to fund 300 mm transitions, while U.S. players tap CHIPS Act grants to localize automotive and defense production. Venture funding gravitates toward healthcare bio-MEMS and solid-state speakers where clear white-space exists and regulatory moats discourage fast followers. Overall, the landscape balances cost-driven commodity segments against application-specific niches, maintaining competitive tension that keeps innovation pace brisk and margins mixed.
MEMS Industry Leaders
Robert Bosch GmbH
Broadcom Inc.
STMicroelectronics N.V.
Texas Instruments Inc.
Qorvo Inc.
- *Disclaimer: Major Players sorted in no particular order

Recent Industry Developments
- December 2025: STMicroelectronics announced a EUR 200 million (USD 233.57 million) expansion of its Agrate Brianza MEMS fab to add 300 mm capacity for automotive inertial sensors.
- November 2025: Qorvo completed the USD 125 million acquisition of Nextivity’s RF-repeater business, integrating MEMS-based tunable filters for enterprise 5 G coverage.
- October 2025: xMEMS launched its Sycamore piezo-MEMS speaker, achieving 15 dB higher output per milliwatt and winning a true-wireless-earbud design for 2026.
- September 2025: Bosch Sensortec introduced the BMA530 accelerometer with an integrated machine-learning core that cuts system power 40% in wearables.


Research Methodology Framework and Report Scope
Market Definitions and Key Coverage
Our study treats the micro-electro-mechanical systems (MEMS) market as revenue generated from newly manufactured sensors, actuators, oscillators, and micro-fluidic chips that integrate mechanical structures with on-chip electronics and are supplied in first-level packages to equipment makers across consumer, automotive, industrial, medical, telecom, and aerospace domains.
Scope exclusion: refurbished devices, wafer-level foundry services billed to IDMs, and standalone semiconductor discretes are left outside this valuation.
Segmentation Overview
- By Device Class
- Sensors
- Actuators
- Oscillators and Timing
- Microfluidic Chips
- Power / Motion Micro-Generators
- By Sensor / Actuator Type
- Inertial Sensors
- Pressure Sensors
- RF MEMS
- Optical MEMS
- Environmental Sensors
- MEMS Microphones
- Micro-Bolometers and IR Detectors
- Ink-Jet Heads
- Other Sensor / Actuator Types
- By Application
- Consumer Electronics
- Automotive
- Industrial and Robotics
- Healthcare and Medical Devices
- Telecom Infrastructure
- Aerospace and Defense
- Other Applications
- By Fabrication Process
- Bulk Micromachining
- Surface Micromachining
- Deep-Reactive Ion Etch (DRIE)
- Silicon-on-Insulator (SOI) MEMS
- LIGA / X-ray Lithography
- Advanced 3-D-Printed MEMS
- By Material
- Silicon
- Polymers
- Piezoelectric (AlN, PZT)
- Metals
- Compound Semiconductors
- Quartz and Glass
- By Geography
- North America
- United States
- Canada
- Mexico
- South America
- Brazil
- Argentina
- Rest of South America
- Europe
- Germany
- United Kingdom
- France
- Italy
- Spain
- Russia
- Rest of Europe
- Asia Pacific
- China
- Japan
- South Korea
- India
- Australia
- New Zealand
- Rest of Asia Pacific
- Middle East
- United Arab Emirates
- Saudi Arabia
- Turkey
- Rest of Middle East
- Africa
- South Africa
- Nigeria
- Kenya
- Rest of Africa
- North America
Detailed Research Methodology and Data Validation
Primary Research
Mordor analysts spoke with wafer-fab managers, automotive Tier-1 sensor integrators, smartphone sourcing teams, and medical-device designers across Asia, Europe, and North America. These conversations validated average selling prices, attach-rate trajectories, and lead-time assumptions while highlighting regional demand pulses that raw shipment data alone would miss.
Desk Research
We begin by downloading production and trade codes for pressure and inertial sensors from UN Comtrade, US Census, Eurostat PRODCOM, and China Customs, which help us anchor volume baselines by region. Statistics from SEMI's MEMS & Sensors Industry Group, Japan Electronics & Information Technology Association, and the US National Institute of Standards & Technology provide fab capacity, die size migration, and typical yields. Company 10-Ks together with patent abstracts (Questel) let us map technology adoption curves and price erosion. Additional context is gathered through press releases and academic papers indexed on IEEE Xplore for emerging piezo-MEMS. The sources cited are illustrative; many other documents were consulted for clarity and cross-checks.
Market-Sizing & Forecasting
A top-down reconstruction starts with regional output of smartphones, cars, industrial robots, and connected medical devices; unit counts are multiplied by application-level MEMS penetration factors, which are then aligned with customs shipment values. Selected bottom-up roll-ups, such as sampled accelerometer ASP multiplied by estimated volumes for five leading suppliers, serve as reasonableness checks. Key variables in our model include handset production runs, ADAS fitment rates, average MEMS content per electric vehicle, industrial automation spend, and wafer yield trends. Forecasts employ multivariate regression blended with scenario analysis to translate those drivers into five-year revenue curves, and gaps in device class data are bridged using normalized industry ratios.
Data Validation & Update Cycle
Every model iteration passes a two-layer analyst review where anomalies are flagged against external benchmarks and prior editions. Reports refresh annually, and interim spot updates are triggered when quarterly earnings, policy shifts, or supply shocks materially move any core input.
Why Mordor's MEMS Market Baseline Stands Decisively Reliable
Published figures often diverge because each publisher chooses its own device list, price stack, and refresh rhythm. By locking scope to first-sale packaged components and refreshing with live production statistics, Mordor delivers a baseline users can retrace with public data and a few expert calls.
Key gap drivers include whether services revenue is bundled, how aggressively future handset cycles are projected, and the lag between source data cut-off and publication. Our team's annual refresh and mixed-method pricing temper the extremes seen elsewhere.
Benchmark comparison
| Market Size | Anonymized source | Primary gap driver |
|---|---|---|
| USD 17.5 B (2025) | Mordor Intelligence | - |
| USD 16.7 B (2024) | Global Consultancy A | Excludes oscillators, limited geographic split, two-year data lag |
| USD 18.7 B (2024) | Research Publisher B | Includes foundry services and packaging fees |
| USD 26.1 B (2024) | Industry Insight C | Counts refurbished units and broader semiconductor sensor family |
Taken together, the comparison shows that once like-for-like scope filters are applied, our measured midpoint offers decision-makers a balanced, transparent starting point that is readily updated as fresh production and pricing signals emerge.


Key Questions Answered in the Report
What is the current value of the MEMS market?
The MEMS market size is USD 18.66 billion in 2026 and is forecast to reach USD 25.58 billion by 2031.
How fast is the market expanding?
Revenue is projected to grow at a 6.51% CAGR during 2026-2031.
Which device class generates the most revenue?
Sensors lead with 61.43% MEMS market share in 2025, thanks to inertial modules in smartphones and vehicles.
Which application segment is growing fastest?
Healthcare and medical devices are expected to expand at a 7.53% CAGR as continuous glucose monitors and lab-on-chip diagnostics scale.
Why are 300 mm wafers important for MEMS?
Moving to 300 mm substrates reduces per-die cost by 30-40% and boosts annual capacity, critical for meeting automotive and smartphone volumes.
Who are the leading players?
Bosch, STMicroelectronics, TDK InvenSense, and Knowles collectively hold more than 60% share in inertial sensors and microphones.
Page last updated on:


