
Market Overview
| Study Period | 2020 - 2031 |
|---|---|
| Market Size (2026) | USD 8.16 Billion |
| Market Size (2031) | USD 15.43 Billion |
| Growth Rate (2026 - 2031) | 13.58 % |
| Fastest Growing Market | Africa |
| Largest Market | Asia Pacific |
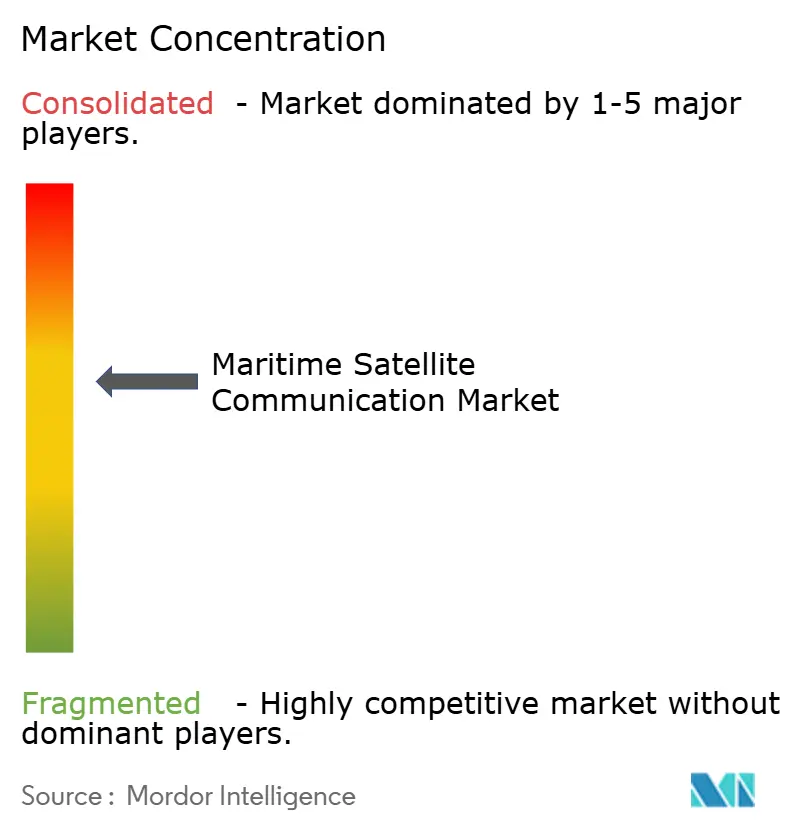
| Market Concentration | Medium |
Major Players *Disclaimer: Major Players sorted in no particular order Image © Mordor Intelligence. Reuse requires attribution under CC BY 4.0. | |
Maritime Satellite Communication Market Analysis by Mordor Intelligence
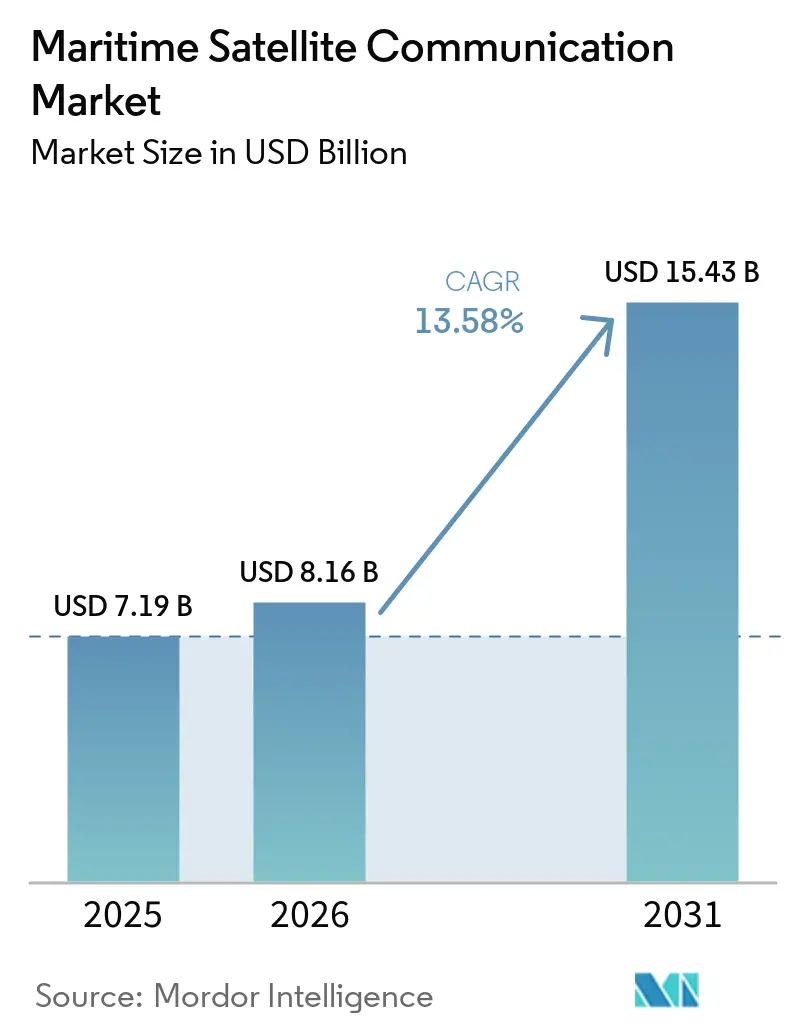
The Maritime Satellite Communication Market size is projected to expand from USD 7.19 billion in 2025 and USD 8.16 billion in 2026 to USD 15.43 billion by 2031, registering a CAGR of 13.58% between 2026 to 2031. Rising regulatory reporting, low-latency LEO capacity, and crew-welfare mandates are moving connectivity from a cost center to an operational pillar of fleet efficiency. Vessel operators now bundle fuel-emissions telemetry, AI route optimization, and passenger internet on the same link, accelerating hardware refresh cycles and service-layer innovation. Price disruption from Starlink and OneWeb is forcing incumbents to defend share by offering turnkey cybersecurity and analytics, while flat-panel antennas are shrinking form-factor barriers for fishing, leisure, and coastal craft. At the same time, hybrid VSAT-5G hand-off solutions are lowering near-shore airtime expenses, and classification societies are certifying integrated SATCOM-plus-software suites that satisfy IMO carbon-intensity rules.
Key Report Takeaways
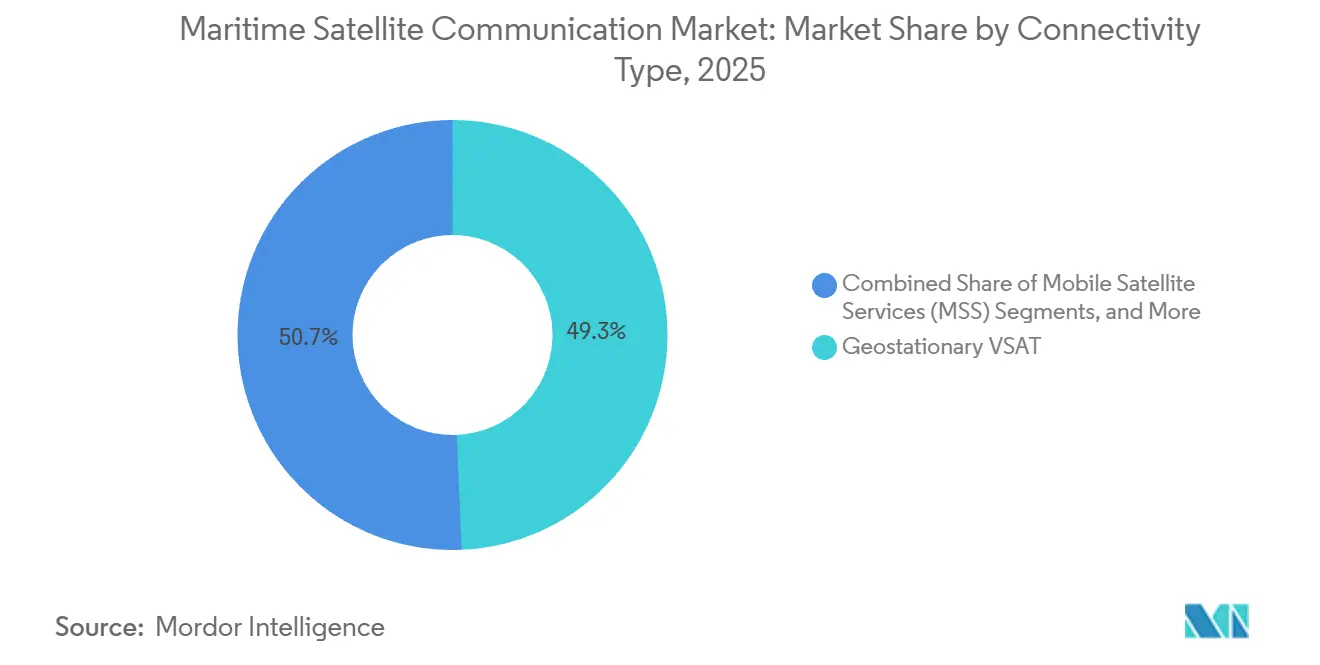
- By connectivity type, geostationary VSAT led with 49.32% revenue share in 2025; non-GEO broadband is advancing at a 14.12% CAGR to 2031.
- By frequency band, Ku-Band accounted for 38.63% of the maritime satellite communication market share in 2025, while Ka-Band is forecast to grow at a 14.23% CAGR through 2031.
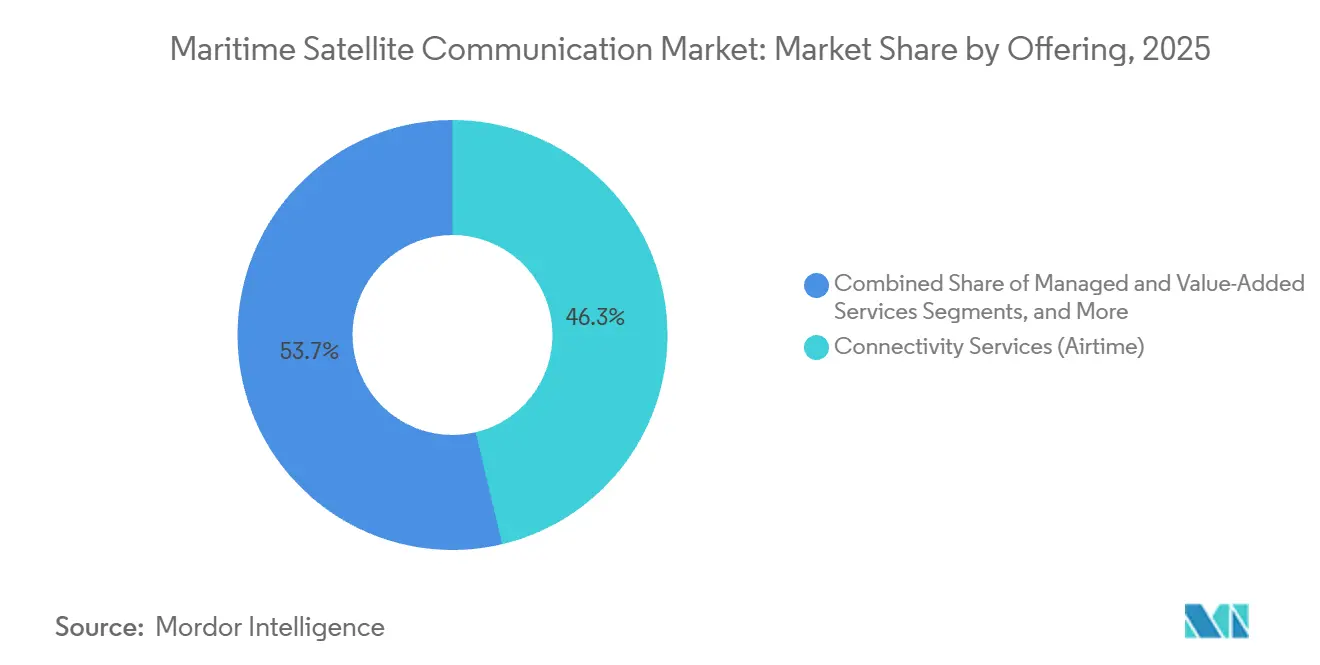
- By offering, connectivity services held 46.28% of the maritime satellite communication market size in 2025, and managed services are expanding at a 15.32% CAGR to 2031.
- By end user, merchant cargo and tanker vessels commanded 29.47% revenue share in 2025; passenger vessels recorded the highest 16.72% CAGR through 2031.
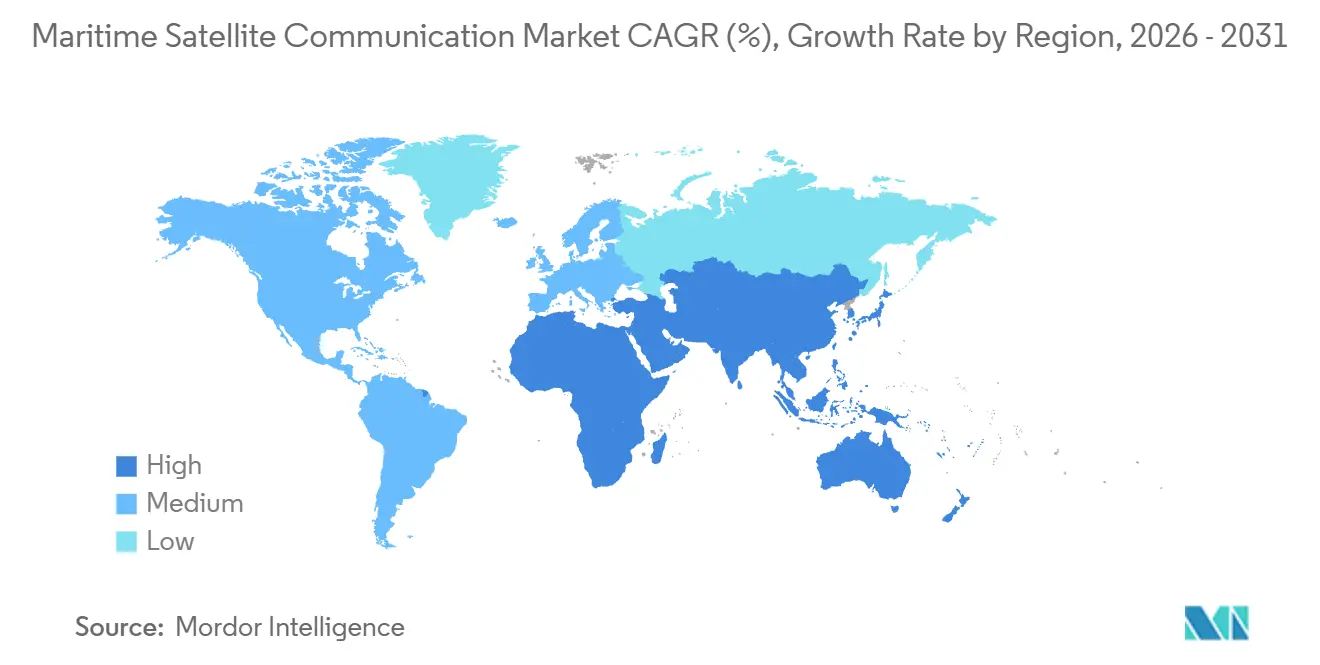
- By geography, the Asia Pacific contributed 32.71% of the revenue in 2025, whereas Africa is poised for the fastest growth of 14.83% CAGR during the forecast horizon.
Note: Market size and forecast figures in this report are generated using Mordor Intelligence’s proprietary estimation framework, updated with the latest available data and insights as of January 2026.
Market Trends and Insights
Drivers Impact Analysis of Maritime Satellite Communication Market*
| Driver | (~) % Impact on CAGR Forecast | Geographic Relevance | Impact Timeline |
|---|---|---|---|
| Growing Crew Welfare Mandates and Onboard Digitalization | +2.8% | Global, early adoption in Europe and North America | Medium term (2-4 years) |
| Emergence of LEO Constellations Disrupting Bandwidth Economics | +3.2% | Global, accelerated in Asia Pacific and North America | Short term (≤ 2 years) |
| IMO Decarbonization Data-Reporting Requirements | +2.1% | Global, driven by IMO MEPC resolutions | Long term (≥ 4 years) |
| Hybrid VSAT-5G Coastal Hand-Off Architectures | +1.4% | North America, Europe, coastal Asia Pacific | Medium term (2-4 years) |
| AI-Driven Route Optimization Platforms Embedding SATCOM | +1.9% | Global, concentrated in merchant cargo and tanker segments | Medium term (2-4 years) |
| Rising Defence Demand for Resilient Maritime SATCOM | +1.7% | North America, Europe, Middle East | Long term (≥ 4 years) |
| Source: Mordor Intelligence | |||


Growing Crew Welfare Mandates And Onboard Digitalization
Amendments to the Maritime Labour Convention, ratified in 2024, oblige shipowners to provide reasonable internet access, making broadband a compliance item rather than a perk.[1]International Labour Organization, “Maritime Labour Convention Amendments 2024,” ilo.org Seafarer surveys in 2025 ranked Wi-Fi among the top three retention factors, linking connectivity directly to crew turnover costs. Operators now merge welfare and operational data over a single high-capacity Ka-Band link, prompting shipyards to pre-install flat-panel antennas on newbuilds. The shift is most visible in long-haul container and tanker tonnage, where rotations last eight months, and mental-health benefits translate into safety gains. Overall, crew mandates underpin steady demand for bandwidth, insulating the maritime satellite communication market from price volatility.
Emergence Of LEO Constellations Disrupting Bandwidth Economics
Starlink Maritime delivers sub-40 ms latency and speeds up to 220 Mbps, commoditizing raw bandwidth and forcing GEO incumbents to pivot toward service layers. OneWeb’s global footprint and flat-rate packages remove per-megabyte overage fees, while Project Kuiper is slated to enter trials in 2026, intensifying price pressure. Vessel operators embrace LEO for real-time video, cloud dashboards, and remote piloting, yet phased-array antennas raise capital hurdles and create a niche for hybrid GEO-LEO terminals. As multi-orbit modems mature, the maritime satellite communication market is migrating to flexible architectures that select the optimal link per application. SCPC technology accounted for 60.5% of the satellite modem market in 2024, prized for guaranteed bandwidth in mission-critical links. The immediate result is double-digit traffic growth, especially on cruise, offshore energy, and research vessels.
IMO Decarbonization Data-Reporting Requirements
The IMO Data Collection System and CII grading compel ships above 5,000 GT to transmit fuel consumption and voyage emissions daily.[2] International Maritime Organization, “IMO Data Collection System for Fuel Oil Consumption,” imo.org Continuous telemetry demands encrypted satellite links, turning connectivity into a prerequisite for port clearance and insurance underwriting. Shipowners integrate weather, sea-state, and fuel-flow data with AI route planners, cutting fuel 8%-12% and improving their CII grade. Classification societies now certify SATCOM-plus-analytics packages that consolidate compliance and efficiency. Consequently, decarbonization regulation provides a durable volume floor for the maritime satellite communication market.
Hybrid VSAT-5G Coastal Hand-Off Architectures
Dual-mode terminals switch to 5G within 12 nautical miles of shore, lowering airtime costs by up to 70% and freeing satellite capacity for blue-water legs. FCC spectrum allocations and European port 5G corridors hasten adoption, especially among ferries and offshore supply vessels. Integrated vendors bundle Ku-Band VSAT, 5G radios, and SD-WAN controllers, delivering a single invoice and seamless performance. Regional spectrum fragmentation, however, requires multi-band support and diverse authentication protocols. Overall, coastal hand-off expands addressable demand without eroding satellite revenue, reinforcing the maritime satellite communication market.
Restraints Impact Analysis of Maritime Satellite Communication Market*
| Restraint | (~) % Impact on CAGR Forecast | Geographic Relevance | Impact Timeline |
|---|---|---|---|
| High CAPEX for Flat-Panel Antennas | −1.8% | Global, acute for small fleets in Africa and South America | Short term (≤ 2 years) |
| Cybersecurity Compliance Burden for Small Fleets | −1.2% | North America and Europe | Medium term (2-4 years) |
| Spectrum Coordination Congestion in Ku/Ka | −0.9% | Global, bottlenecks in Asia Pacific and Europe | Long term (≥ 4 years) |
| Export-Control Limits on Advanced Modems | −0.7% | Middle East, Africa, select Asia Pacific markets | Medium term (2-4 years) |
| Source: Mordor Intelligence | |||
High CAPEX For Flat-Panel Antennas
Electronically steered antennas cost USD 15,000-50,000 per unit, representing up to 25% of some small-vessel annual budgets. Early models also suffered performance degradation in rough seas, leading operators to defer purchases until second-generation units emerged. Leasing programs bundle hardware and airtime to soften upfront spending but lock customers into multi-year terms that lengthen payback periods. The gap creates a two-tier connectivity landscape, where large fleets enjoy multi-gigabit LEO links and small craft remain on narrowband L-Band. Unless hardware prices fall sharply, CAPEX friction will temper adoption velocity in the maritime satellite communication market.
Cybersecurity Compliance Burden For Small Fleets
USCG rules and IACS requirements mandate network segmentation, encryption, and continuous monitoring, adding USD 10,000-30,000 in hardware and audit costs per vessel. For operators on thin margins, these expenses can exceed annual connectivity fees, deterring them from upgrading. Managed-service providers offer turnkey compliance, but outsourcing concentrates risk and introduces vendor lock-in. Cyber rules nevertheless remain non-negotiable for port access, prompting some owners to delay nonessential digitalization until subsidized options become available. Over the medium term, compliance outlays may weigh on the maritime satellite communication market, especially in fragmented coastal trades.
*Our forecasts treat driver/restraint impacts as directional, not additive. The impact forecasts reflect baseline growth, mix effects, and variable interactions.
Maritime Satellite Communication Market Segment Analysis
By Connectivity Type:
LEO Gains Share As GEO Defends Installed BaseRevenue from non-GEO broadband is expanding at 14.12% CAGR, underscoring the speed with which operators are migrating to low-latency solutions. The maritime satellite communication market size attached to geostationary VSAT remains sizable because 49.32% of 2025 connectivity revenue flowed through established GEO contracts. Yet LEO newcomers are eroding price points, prompting GEO providers to fold cybersecurity and analytics into long-term bundles. Hybrid modems that mesh LEO and GEO on a single enclosure blur segmentation boundaries and future-proof fleet investments. SpaceX’s direct-to-cell capability, entering trials in 2026, could siphon narrowband spending by allowing smartphones to connect to satellites without specialized terminals.
Continued MEO investment by SES offers mid-latency alternatives where polar coverage or guaranteed uptime is critical. ITU spectrum rulings have lessened interference worries and bolstered low-orbit deployment plans. Overall, the maritime satellite communication market sees connectivity choice shifting from orbit-centric to performance-centric procurement, with service quality, SLA uptime, and cybersecurity overtaking raw bandwidth in contract criteria.


By Frequency Band:
Ka-Band Ascends As Flat Panels ProliferateKa-Band revenue is projected to grow 14.23% CAGR, the highest among bands, as lightweight flat-panel antennas dominate new installations. Ku-Band retains a 38.63% slice of maritime satellite communication market share due to a vast installed reflector base and plentiful GEO capacity. Yet Ku filings are waning while Ka and emerging Q/V bands attract fresh satellite investment. Renesas beamforming chips have cut Ka-terminal power use 40% and pushed unit pricing below USD 20,000, driving mid-size merchant adoption.
Flat-panel gain constraints favor higher frequencies, anchoring Ka-Band’s growth narrative. L-Band maintains a vital safety niche for GMDSS and IoT, but limited throughput caps its commercial upside. Regulatory moves to authorize maritime 5G-satellite hybrids in the 27.5-28.35 GHz slice further brighten Ka prospects.[3]Federal Communications Commission, “Maritime 5G Spectrum Allocation,” fcc.gov Consequently, frequency strategy now hinges on matching antenna economics with application bandwidth, locking Ka-Band into pole position within the maritime satellite communication market.
By Offering:
Managed Services Outpace Airtime As Cyber And Analytics Add ValueManaged and value-added services are growing at a 15.32% CAGR, reflecting an industry shift from selling megabytes to selling outcomes. Although connectivity plans still accounted for 46.28% of 2025 revenue, commodity pricing prompted providers to incorporate cybersecurity, CII reporting, and AI routing into bundled contracts. KVH’s connectivity-as-a-service model waives terminal CAPEX in exchange for multi-year fees, inflating lifetime value while raising switching barriers. The maritime satellite communication market size tied to hardware alone is flattening as amortized subscription models reclassify capital outlays as operating costs.
Service portfolios now range from 24/7 SOC monitoring to telemedicine links. Certification by DNV and Lloyd’s Register lends credibility and eases compliance headaches for operators. However, deep integration can handcuff owners if performance disappoints, and termination penalties often exceed USD 50,000 per vessel. The commerce prize, therefore, belongs to vendors that pair open architectures with tangible ROI metrics.
By End-User Vertical:
Cruise Connectivity Surges As Passengers Demand Gigabit Wi-FiPassenger vessels are forecast to post a 16.72% CAGR, the fastest within end users, as cruise lines monetize high-speed internet packages and leverage free Wi-Fi as a booking incentive. Merchant cargo and tanker ships still represent the largest slice of the maritime satellite communication market, contributing 29.47% of the revenue in 2025, as they dominate global tonnage and must meet IMO reporting rules. Offshore energy platforms integrate SATCOM with edge computing to predict equipment failures, resulting in tangible downtime savings. Fishing and aquaculture adopt low-bandwidth L-Band IoT to validate quota and deter illegal catch, while superyacht owners specify Ka-Band flat panels for entertainment and remote work.
Defence procurement remains robust as navies pursue anti-jamming resilience. Multi-orbit terminals ordered by the U.S. Navy and NATO allies are expected to trickle down to commercial production volumes, reducing per-unit costs and broadening uptake. Overall, usage diversity protects the maritime satellite communication market from cyclical shocks in any single shipping segment.
Geography Analysis
APAC Maritime Satellite Communication Market
The Asia Pacific contributes 32.71% of the 2025 revenue, reflecting its concentration in shipbuilding, container traffic, and fishing operations. Chinese, Japanese, and South Korean yards pre-wire new hulls with Ka-Band flat panels to meet charterer connectivity clauses. Belt-and-Road port digitalization in Southeast Asia embeds satellite-based manifest and AIS requirements, expanding regional demand. Japan’s autonomous coastal corridor tests lean on low-orbit backhaul for HD video and LiDAR streams. India’s Sagarmala expansion is adding AIS and SATCOM mandates for coastal cargo vessels, reinforcing volume.
Africa Maritime Satellite Communication Market
Africa is the fastest-growing region, with a 14.83% CAGR, as Nigeria, Kenya, and South Africa digitalize their ports with satellite container tracking, financed by multilateral lenders. South-Atlantic fisheries deploy L-Band IoT to enforce quotas, yet CAPEX hurdles constrain the adoption of flat-panel technology. North Africa’s offshore oil reactivation in Egypt and Libya injects high-throughput VSAT spending.
Europe, the Americas and Middle East Maritime Satellite Communication Market
North America and Europe sustain steady growth on the back of stringent cyber mandates and early hybrid VSAT-5G rollouts. The U.S. Gulf of Mexico 5G trials and EU Connecting Europe Facility grants incentivize terminal upgrades. Middle-East energy majors equip tankers with multi-orbit links to oversee cargo integrity through chokepoints. South America’s deep-water oil in Brazil and Guyana deploys GEO-HTS, while Argentina’s fisheries migrate to Ku for electronic documentation. Together, these dynamics keep geographic demand broad and resilient for the maritime satellite communication market.

Regulatory Landscape
Maritime satellite communication is governed by a combination of maritime safety obligations and telecom spectrum rules that shape equipment selection, service eligibility, and network design. On the maritime side, the International Maritime Organization is expanding the compliance perimeter for digital safety communications: at MSC 111 (May 2026), the IMO adopted SOLAS amendments that introduce the VHF Data Exchange System (VDES) into SOLAS and require coastal states to disseminate Maritime Safety Information through all operational Recognised Mobile Satellite Services, with both sets of amendments entering into force on January 1, 2028. These actions complement existing mandates that elevate secure connectivity for operational reporting, including IMO emissions data transmission requirements for ships above 5,000 GT.
Value Chain Analysis
The maritime SATCOM value chain runs from satellite operators and spectrum coordination through service providers and system integrators to onboard hardware, installation, and managed operations. Capacity is supplied by GEO operators and emerging NGSO constellations, then packaged by maritime service providers (for example, Inmarsat/Viasat, Eutelsat OneWeb partners, Marlink, Speedcast, and KVH) into airtime plans, bonded multi-orbit services, and managed cybersecurity or compliance tooling. Hardware OEMs (antennas, modems, and below-deck networking) and maritime installers complete the onboard stack, with shipyards increasingly pre-wiring connectivity on newbuilds to meet charterer and crew-welfare requirements.
Competitive Landscape
The top five providers, Inmarsat, Viasat, Speedcast, Marlink, and KVH, held roughly 55-60% global revenue in 2025, signaling moderate concentration. Starlink Maritime’s flat-rate offer is fragmenting share, compelling incumbents to differentiate through managed services and uptime SLAs. Viasat’s acquisition of Inmarsat’s government unit and Eutelsat’s merger with OneWeb create vertically integrated giants controlling satellite capacity and service layers.
Technology is the weapon of choice. Intellian’s multi-band flat panel and Iridium’s compact Certus 9704 terminal target opposite ends of the vessel spectrum, from large cargo ships to small fishing boats. Hybrid GEO-LEO modems and 5G satellite edge devices are forming new competitive arenas, where smaller specialists, such as Tototheo Maritime, are carving out niches. Regulatory tightening around cybersecurity pushes providers to bundle SOC oversight, further blurring lines between connectivity and IT outsourcing.
Service lock-in, driven by subscription bundles and proprietary analytics, raises switching costs and extends the average customer life. Conversely, over-the-air firmware and open-API designs offer a countertrend toward interoperability, giving fleet managers leverage in negotiations. Against this backdrop, price competition in raw bandwidth coexists with premium pricing for integrated solutions, shaping profit pools across the maritime satellite communication market.
Maritime Satellite Communication Industry Leaders
Inmarsat Group Limited
Marlink SAS
KVH Industries Inc.
Speedcast International
NSSL Global Ltd.
- *Disclaimer: Major Players sorted in no particular order
Maritime Satellite Communication Market Companies Covered in this Report
- Inmarsat Group Limited
- Marlink SAS
- KVH Industries Inc.
- Speedcast International
- NSSL Global Ltd.
- Cobham Satcom
- Iridium Communications Inc.
- Thuraya Telecommunications Co.
- Hughes Network Systems LLC
- Viasat Inc.
- Eutelsat Group (incl. OneWeb)
- SES S.A.
- Intelsat S.A.
- SpaceX Starlink
- Telesat Corp.
- ORBCOMM Inc.
- Satcom Global Ltd.
- Intellian Technologies Inc.
- Kymeta Corporation

Market Opportunities and Future Outlook
A key whitespace is the enterprise-managed, multi-orbit layer that abstracts away underlying satellite networks and delivers predictable performance, cybersecurity, and fleetwide policy control across mixed vessel classes. Activity in 2026 shows service providers productizing this layer: Marlink introduced Sealink Multi-LEO (March 2026) to pool data allowances across Starlink and OneWeb under a single subscription construct, and TUI Cruises commissioned Mein Schiff Flow with a hybrid platform combining Starlink LEO, GEO VSAT, and MSS backup managed by Marlink (June 2026). These moves support opportunities for vendors that can standardize network bonding, application-aware routing, and fleet pooling across LEO/GEO/MSS while keeping terminals and shipboard IT interoperable.
Recent Industry Developments in Maritime Satellite Communication Market
- July 2026: Inmarsat Maritime (a Viasat company) and Hapag-Lloyd announced a fleetwide rollout of the NexusWave managed bonded connectivity service following successful trials. The arrangement reinforces bonded multi-network architectures as the procurement model for large merchant fleets and strengthens the role of managed services such as performance management and cybersecurity.
- June 2026: Eutelsat and AST Networks expanded their partnership through a multi-year, multi-million-dollar agreement to scale OneWeb LEO services within ASTs maritime solutions. The deal adds distribution momentum for OneWeb capacity in the maritime channel and supports packaged services that include private networking and flexible data management. It also intensifies competition for incumbent GEO providers by widening access to LEO-based offers through integrators.
- December 2024: KVH Industries and Vroon completed deployment of a Starlink/VSAT hybrid solution across a substantial regional fleet, combining KVH TracPhone V7-HTS terminals with Starlink High Performance Terminals. The rollout demonstrates operational adoption of hybrid connectivity to balance throughput, redundancy, and cost across fleet profiles.


Maritime Satellite Communication Market Report Scope and Research Methodology
Market Definition and Coverage
This market is defined as revenue generated from satellite connectivity used at sea, including ship-borne communication equipment, airtime, and managed value-added services that enable voice, data, and video links for vessels.
Scope exclusions: We exclude military tactical satellite communications that run only on classified networks and are not sold in the commercial maritime channel.
Segments Covered in This Report
- By Connectivity Type
- Mobile Satellite Services (MSS)
- Geostationary VSAT
- Non-GEO Broadband (LEO/MEO)
- By Frequency Band
- L-Band
- S-Band
- C-Band
- Ku-Band
- Ka-Band
- By Offering
- Hardware and Terminals
- Connectivity Services (Airtime)
- Managed and Value-Added Services
- By End-User Vertical
- Merchant Cargo and Tanker
- Offshore Energy and Support Vessels
- Passenger (Cruise and Ferry)
- Fishing and Aquaculture
- Leisure and Yachts
- Government and Defence
- By Geography
- North America
- United States
- Canada
- Mexico
- South America
- Brazil
- Argentina
- Rest of South America
- Europe
- Germany
- United Kingdom
- France
- Italy
- Spain
- Russia
- Rest of Europe
- Asia Pacific
- China
- Japan
- South Korea
- India
- Australia
- New Zealand
- Rest of Asia Pacific
- Middle East
- United Arab Emirates
- Saudi Arabia
- Turkey
- Rest of Middle East
- Africa
- South Africa
- Nigeria
- Kenya
- Rest of Africa
- North America
Data Sources, Market Sizing, and Validation
Desk Research
Desk work starts with mapping the demand pool and the operating vessel population that can realistically buy maritime satcom services, then layering connectivity adoption and spend patterns onto that base. To keep inputs grounded, we refer to public vessel and port indicators, trade flows, and safety requirements, since these signals usually move before satcom spending does.
Key public sources used for structure and checks include publications and datasets from bodies such as the International Telecommunication Union, the International Maritime Organization, UNCTAD maritime transport statistics, AIS based public vessel movement summaries, and national communications regulators where licensing rules are published. We also review company filings and investor presentations, association websites, and trusted press coverage to understand product positioning and pricing direction. Where specific hardware flow signals are needed, we then use paid subscriptions for company financials and intelligence, patent databases, and shipment level import export views. These examples are not exhaustive, and many other sources are used to collect data, validate assumptions, and clarify open questions during the work.
Primary Interviews and Surveys
Primary work is used to pressure test the desk model, especially around adoption timing, average monthly spend, and how often vessels upgrade terminals or bandwidth plans. We interview a mix of satellite operators, maritime service integrators, ship owners, and offshore and passenger vessel stakeholders across major regions, so pricing and utilization assumptions are not driven by one geography alone.
Distribution of primary research fieldwork respondents
| Company type | Respondent position | Region |
|---|---|---|
| Top tier: 31% | CXOs: 12% | APAC: 44% |
| Mid tier: 54% | Functional/Unit leaders: 35% | EMEA: 34% |
| Smaller Players: 15% | Managers: 53% | Americas: 22% |
Market-Sizing & Forecasting
Sizing is built mainly from a top-down approach where the global installed vessel base and sea time activity are translated into a realistic addressable connectivity pool, then converted into revenue using service mix and spend assumptions. Once this structure is in place, we check it with selective bottom-up approximations, including sampled price per month by vessel class, channel checks on terminal replacement cycles, and a light roll up of supplier and integrator revenues when disclosures allow.
Inputs that matter a lot for this market include the active fleet by vessel type, bandwidth demand growth tied to crew welfare and operational data use, the split of MSS versus VSAT style deployments, the shift toward Ka band and multi-orbit packages, and typical contract lengths that delay price resets. When data is missing for smaller fleets or private operators, gaps are handled with proxy indicators such as regional vessel counts, typical fitment rates, and interview led ranges, which are then narrowed during review. Forecasts are prepared using scenario analysis, since capacity additions, pricing pressure, and adoption of new orbit options can shift outcomes quickly. The scenarios are anchored to expert expectations for bandwidth pricing and uptake.
Data Validation & Update Cycle
Outputs are validated through triangulation between the model, public fleet and maritime activity indicators, and the pricing and adoption ranges heard in interviews. If a region or vessel group shows an outlier jump, the underlying drivers are rechecked, and respondents are re-contacted when the variance cannot be explained by known events such as regulation changes or capacity launches.
Before sign-off, the work goes through multi-step analyst reviews that focus on unit consistency, currency conversions, and year-over-year reasonableness against independent signals. Reports are refreshed annually, and interim updates are made when material events occur, after which a final pre-delivery pass is completed so clients receive the most current view.
Mordor Intelligence's Maritime Satellite Communication Market Size Measured Against Other Published Estimates
Published market values for maritime satcom do not always match. The differences usually trace back to how firms draw the service scope and which revenue streams are counted as part of connectivity, and timing also matters because some estimates use older bandwidth price points while others assume faster price drops or quicker adoption of higher-throughput plans.
The main gap comes from whether only connectivity services are counted, or whether ship-borne terminals and managed value-added services are included too. Mordor Intelligence treats the market as a combined revenue pool of hardware, airtime, and managed services tied to maritime satellite links. Differences can also show up when one publisher anchors to a 2023 or 2024 base year, applies a different currency conversion timing, or uses a more aggressive assumption for Ka band uptake across merchant and passenger fleets.
Benchmark comparison
| Source | Market Size | Gaps in Research Methodology |
|---|---|---|
| Mordor Intelligence | USD 8.16 B (2026) | |
| Global Consultancy A | USD 4.74 B (2025) | Uses a services-forward framing and a different base year, which can undercount terminal hardware revenue and some managed service fees that sit between satellite operators and end users. |
| Industry Publisher B | USD 5.90 B (2023) | Anchors the total to a 2023 base and does not make the included revenue stack as explicit, so pricing progression and the split between MSS and VSAT style deployments can shift the total. |
Looking at the spread, the biggest practical takeaway is that scope and timing choices drive most of the difference, not a single math step. By keeping inputs tied to fleet activity, adoption, and repeatable pricing logic, the final number remains traceable to clear levers that can be reviewed and updated as market conditions change.


Key Questions Answered in the Report
What is the current value of the maritime satellite communication market?
The market stands at USD 8.16 billion in 2026 and is forecast to reach USD 15.43 billion by 2031.
How fast is the maritime satellite communication market expected to grow?
Aggregate revenue is projected to advance at a 13.58% CAGR from 2026 to 2031, with LEO and managed-service segments outpacing the mean.
Which segment is growing the quickest?
Passenger vessels, especially cruise lines, are expanding connectivity spend at a 16.72% CAGR as travelers demand high-speed Wi-Fi.
Why are flat-panel antennas important?
Electronically steered flat panels enable multi-orbit tracking, weigh less than gimbaled dishes, and unlock Ka-Band throughput suited to modern cloud applications.
What regulatory rules are pushing SATCOM adoption?
IMO carbon-intensity reporting, ILO crew-welfare mandates, and USCG cyber-risk management rules all require secure, high-availability satellite links.
Page last updated on:


 Your data is secure and never sold or shared.


