Manhole Covers Market Size and Share
Market Overview
| Study Period | 2021 - 2031 |
|---|---|
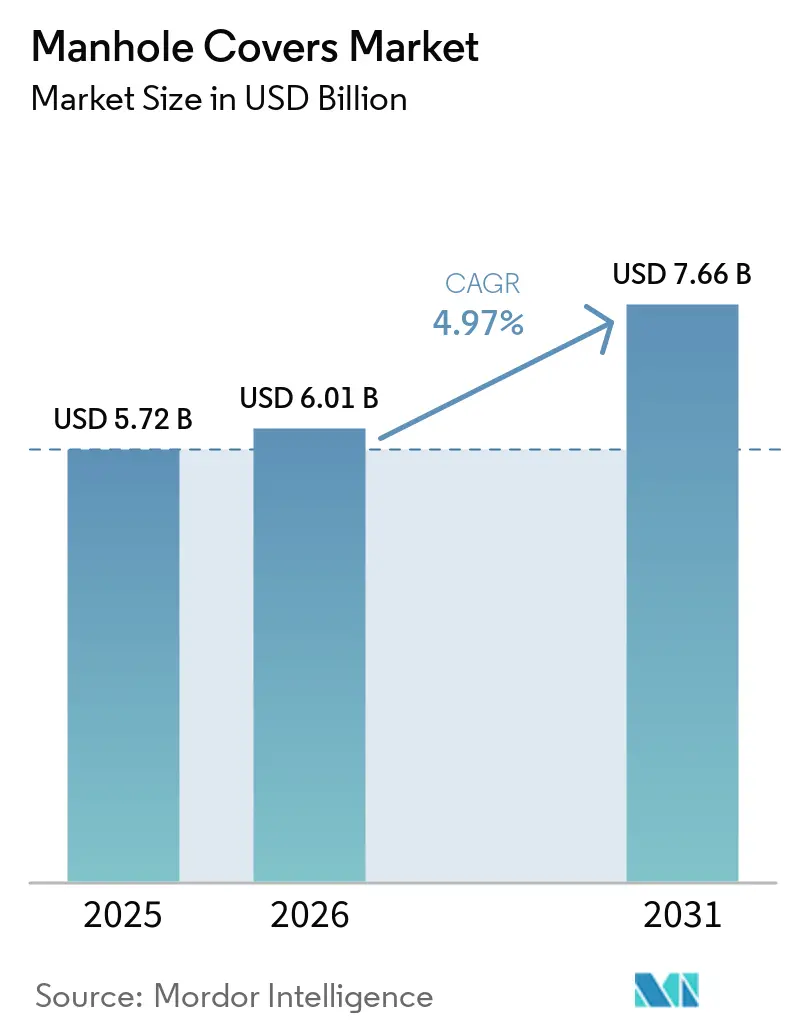
| Market Size (2026) | USD 6.01 Billion |
| Market Size (2031) | USD 7.66 Billion |
| Growth Rate (2026 - 2031) | 4.97% CAGR |
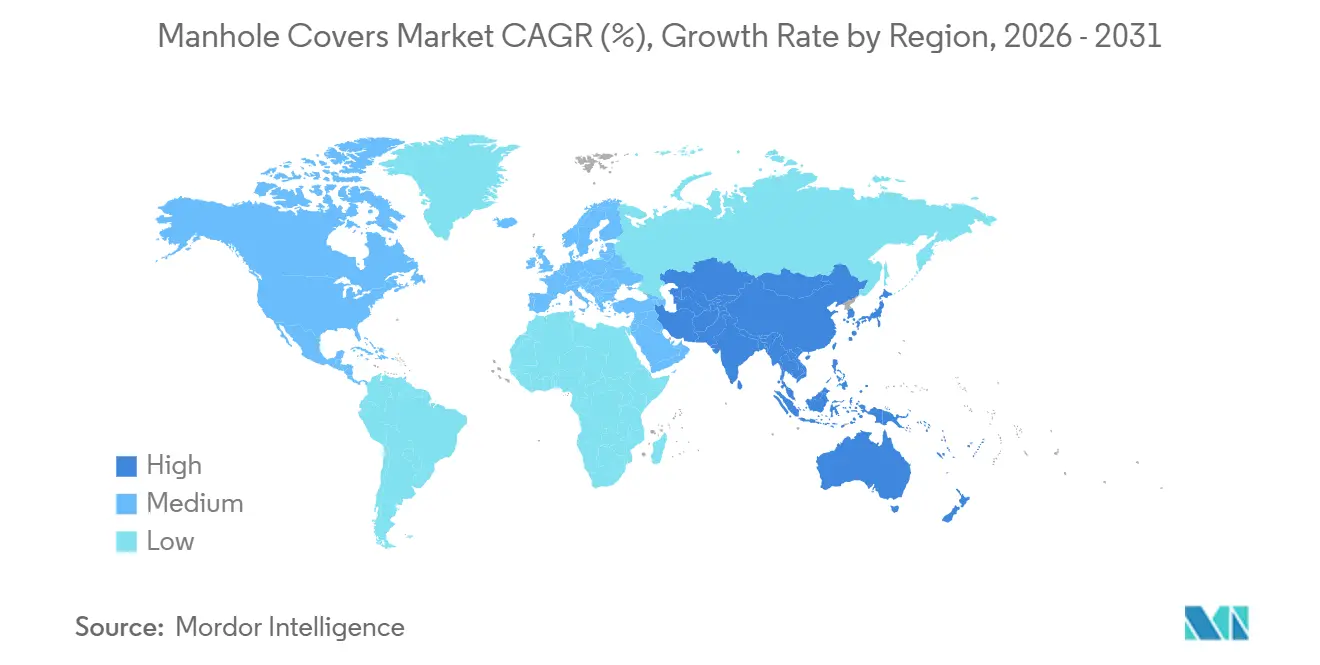
| Fastest Growing Market | Asia Pacific |
| Largest Market | Europe |
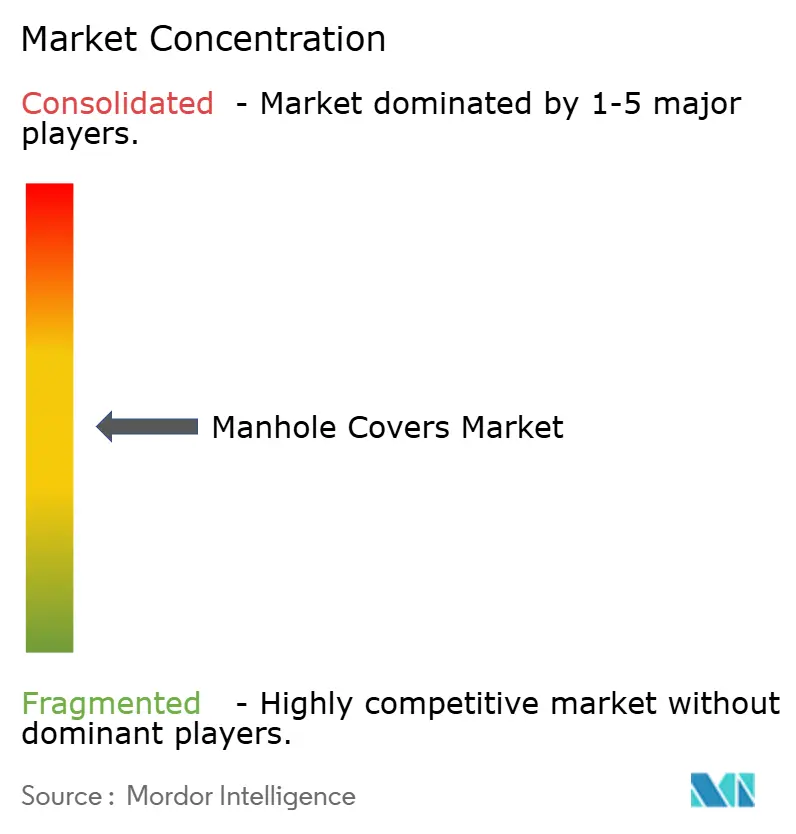
| Market Concentration | Medium |
Major Players *Disclaimer: Major Players sorted in no particular order Image © Mordor Intelligence. Reuse requires attribution under CC BY 4.0. | |
Manhole Covers Market Analysis by Mordor Intelligence
The Manhole Covers Market size is expected to increase from USD 5.72 billion in 2025 to USD 6.01 billion in 2026 and reach USD 7.66 billion by 2031, growing at a CAGR of 4.97% over 2026-2031. Municipal budgets are shifting from simple replacement cycles to digitized asset management. Procurement officers are increasingly focusing on sensor compatibility, composite anti-theft features, and lifecycle labor savings rather than traditional foundry relationships. The dominance of cast iron is waning as composite and polymer-concrete options gain popularity, particularly among telecom utilities that require RF-transparent lids for 5G deployment. Smart-city mandates in Europe and East Asia are driving demand for sensor-embedded lids that can predict flooding, gas buildup, and unauthorized access. Additionally, volatile ductile-iron scrap prices, ranging from USD 1,800 to USD 2,200 per ton in 2025, are squeezing margins and encouraging municipalities to consider fixed-price composite alternatives. Competitive intensity remains high, with small regional foundries underbidding certified suppliers in India and Southeast Asia. However, North American consolidation, such as Charlotte Pipe’s 2026 acquisition of Neenah Foundry, indicates a move toward economies of scale and compliance with standards.
Key Report Takeaways
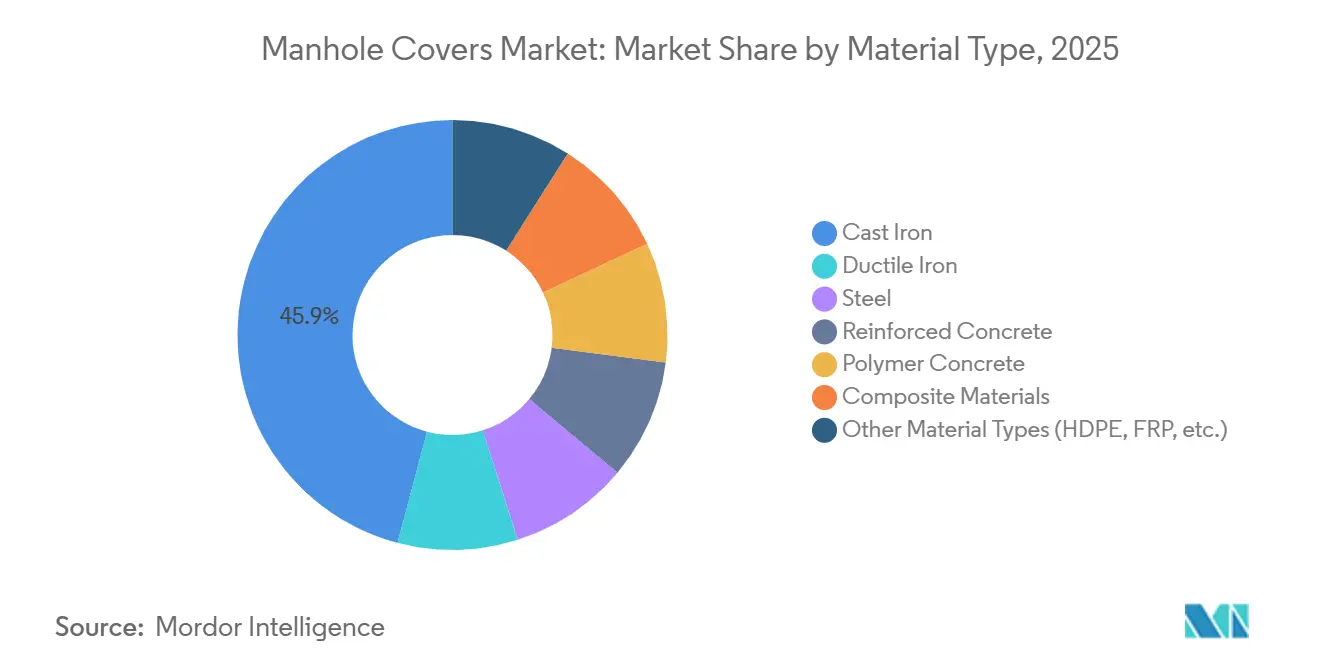
- By material type, cast iron led with 45.89% of the manhole covers market share in 2025, whereas composite materials are forecast to expand at a 5.88% CAGR through 2031.
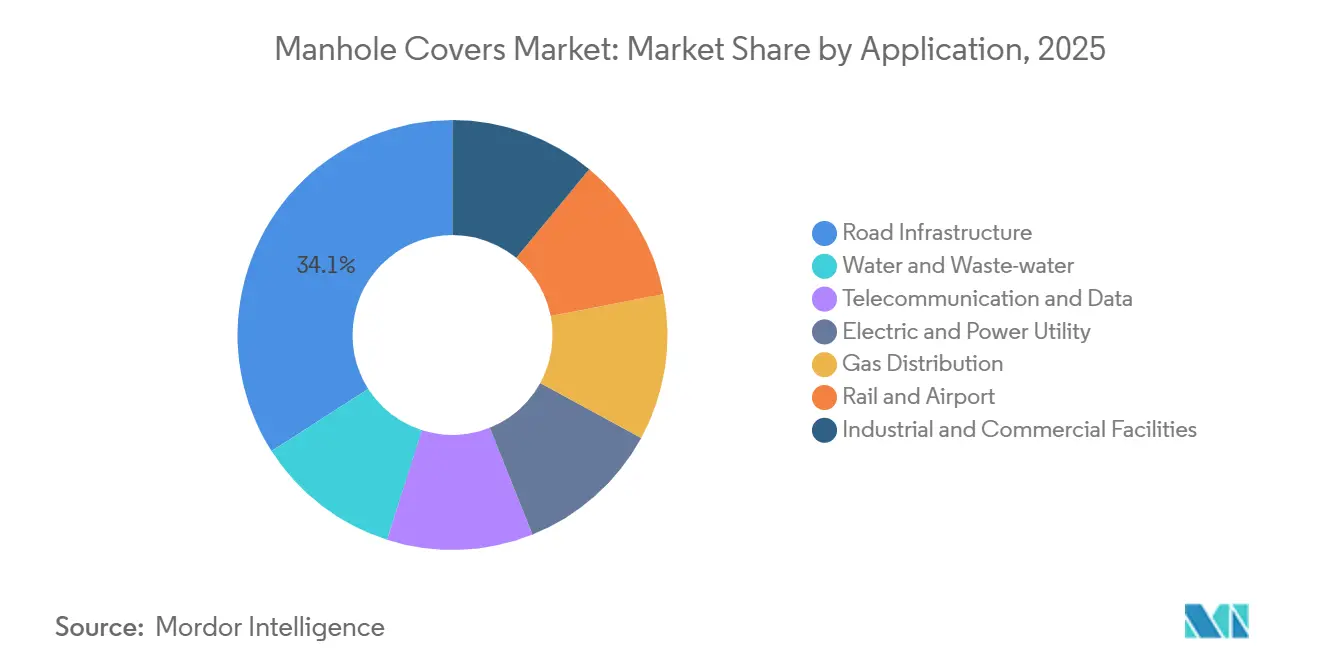
- By application, road infrastructure held 34.08% of the manhole covers market share in 2025, while telecommunication and data are projected to rise at a 6.01% CAGR through 2031.
- By geography, Europe captured 40.38% of the manhole covers market share in 2025, while Asia-Pacific is expected to register the fastest 5.73% CAGR through 2031.
Note: Market size and forecast figures in this report are generated using Mordor Intelligence’s proprietary estimation framework, updated with the latest available data and insights as of January 2026.
Global Manhole Covers Market Trends and Insights
Drivers Impact Analysis*
| Driver | (~) % Impact on CAGR Forecast | Geographic Relevance | Impact Timeline |
|---|---|---|---|
| Urbanization-linked megaproject pipelines | +1.2% | APAC core (China, India, ASEAN), spill-over to Middle-East | Medium term (2-4 years) |
| Smart-city mandates for real-time asset monitoring | +0.9% | Global, with early adoption in North America, Europe, East Asia | Short term (≤ 2 years) |
| Shift toward composite/lightweight anti-theft covers | +1.1% | North America, Europe, urban India | Medium term (2-4 years) |
| Growth in underground fiber and 5G densification | +1.3% | Global, concentrated in APAC, North America | Short term (≤ 2 years) |
| Mandated anti-odor bio-filter covers in high-density cities | +0.5% | East Asia (Japan, South Korea, Singapore), select European metros | Long term (≥ 4 years) |
| Source: Mordor Intelligence | |||
Urbanization-Linked Megaproject Pipelines
Asia-Pacific infrastructure spending reached USD 1.7 trillion in 2025, embedding large-scale manhole procurement across road, rail, and utility projects[1]Asian Development Bank, “Meeting Asia’s Infrastructure Needs,” adb.org. China’s production capacity is expected to rise to 17.65 million units by 2030, surpassing domestic demand and intensifying price competition in ASEAN and the Middle-East. India’s Smart Cities Mission allocated INR 48,000 crore (USD 5.8 billion), but 60% of tenders are still awarded to unorganized foundries that undercut certified suppliers. This fragmented sourcing delays IoT-ready upgrades and contributes to high theft rates; for example, Mumbai reported 791 cover thefts in 2023 despite grill retrofits costing USD 50-100 per site. Excess production in China is likely to cap regional average selling prices (ASPs) through 2029.
Smart-City Mandates for Real-Time Asset Monitoring
Pilot failures in Mumbai, where 40% of sensor units installed in 2021 malfunctioned within six months, highlight integration challenges when legacy cast-iron lids are reused. Fibrelite’s FL60RF composite lids eliminate the need for external antenna mounts and reduce installation costs by 30%. Guangzhou Bangxun’s NB-IoT lids, priced at USD 110-165 in bulk, support tilt and gas detection data streaming to city dashboards. Cities deploying sensor-ready covers have reduced emergency callouts by 25-35%. However, the presence of 50-70 million legacy lids in North America and Europe creates a gradual replacement cycle, with procurement phasing in smart lids during scheduled resurfacing to manage capital expenditures.
Shift Toward Composite/Lightweight Anti-theft Covers
Composite lids, weighing 15-25 kg, reduce installation labor by 20% and eliminate scrap value, thereby deterring theft. EN 124:2015 certification has validated composites for loads up to the F900 class, enabling Fibrelite to supply 625 meters of trench covers for a UK power station in 2024. Neenah’s InfraLock security lids, priced at USD 150-200 per unit, retrofit legacy frames but are cost-effective only in areas where annual theft exceeds 5%. In the United States, AASHTO M306’s preference for ductile iron limits composite adoption in highways, confining their use to pedestrian zones. Municipalities with manual handling weight restrictions are adopting composites to comply with OSHA ergonomics regulations.
Growth in Underground Fiber and 5G Densification
Telecom and data applications are projected to grow at a 6.01% CAGR, outpacing other segments, as 5G nodes require fiber splice vaults every 200-500 meters. Cast-iron lids reduce RF signals by up to 25 dB, prompting AT&T to procure 1,200 RF-transparent composite lids for New York subway tunnels in 2024. Fiber utilities replace lids every 8-12 years, half the lifecycle of road covers, creating recurring revenue opportunities for suppliers with modular designs. Companies like McWane and Saint-Gobain PAM have yet to leverage their highway-scale operations in the telecom niche, leaving the market open to composite specialists. In the long term, 6G experimentation may necessitate even lower signal loss, further driving the shift toward advanced materials.
Restraints Impact Analysis*
| Restraint | (~) % Impact on CAGR Forecast | Geographic Relevance | Impact Timeline |
|---|---|---|---|
| Volatile ductile-iron scrap prices squeezing margins | -0.8% | Global, acute in North America, Europe | Short term (≤ 2 years) |
| Unorganized small foundries limiting standardization | -0.6% | India, Southeast Asia, parts of Middle-East | Medium term (2-4 years) |
| Micro-plastic leach regulations curbing polymer-concrete use | -0.4% | Europe, early regulatory signals in North America | Long term (≥ 4 years) |
| Source: Mordor Intelligence | |||
Volatile Ductile-Iron Scrap Prices Squeezing Margins
Scrap prices fluctuated between USD 1,800 and USD 2,200 per ton in 2025, reducing foundry EBITDA by approximately 18%. McWane’s USD 80 million upgrade in Oskaloosa, which includes melt-efficiency furnaces and long-term scrap contracts, aims to mitigate raw material risks but will not fully address the issue until at least 2027. Smaller foundries, lacking hedging mechanisms, pass price spikes to municipalities with a six-month lag, prompting buyers to explore composites with stable resin pricing. In India, the use of low-grade scrap leads to premature lid failures, but cost considerations continue to dominate municipal tender decisions, leaving safety concerns unresolved.
Unorganized Small Foundries Limiting Standardization
Approximately 50-60% of tenders in India and Southeast Asia are awarded to uncertified foundries that bypass ISO 1083 testing, reducing lid lifespan by 25% over a decade. The Bureau of Indian Standards is drafting mandatory certification requirements, but implementation could take 3-5 years[2]Bureau of Indian Standards, “Draft Mandatory Certification for Manhole Covers,” bis.gov.in. Until enforcement improves, price competition will hinder organized suppliers and delay IoT innovation.
*Our forecasts treat driver/restraint impacts as directional, not additive. The impact forecasts reflect baseline growth, mix effects, and variable interactions.
Segment Analysis
By Material Type: Composites Challenge Cast Iron Dominance
Composite materials are projected to grow at a CAGR of 5.88% through 2031, while cast iron accounted for 45.89% of revenue in 2025. Ductile iron remains essential for F900 traffic loads, and McWane’s Oskaloosa expansion positions the company to meet North American highway demands through 2030. Steel variants are utilized in rail and airfield applications but require galvanization, which increases costs by 20-25%. Reinforced concrete is a cost-effective option for water utilities but is prone to cracking under freeze-thaw conditions, leading desert municipalities to adopt polymer-concrete inserts that double the lifespan.
Composite materials, priced at USD 300-800, are approximately twice as expensive as cast iron but offer advantages such as theft prevention, reduced ergonomic risks, and compatibility with sensors. Fibrelite’s RF-transparent products commanded a 40% premium in 2025 because telecom buyers prioritized signal integrity. Polymer-concrete variants resist acids but face regulatory challenges under EU leach rules, prompting suppliers to diversify into fiber-reinforced plastics. Material strategies are diverging: one supply chain focuses on weight-bearing ductile iron for heavy traffic, while another targets theft-prone, sensor-integrated urban areas, limiting competition between the two segments.


By Application: Telecom and Data Segment Outpaces Legacy Road Infrastructure
Road infrastructure accounted for 34.08% of revenue in 2025, yet telecom and data applications are expected to grow at a CAGR of 6.01% through 2031. In the United States, water and wastewater upgrades span 800,000 miles of aging sewers, contributing significant demand, though budget cycles spread this demand over a decade. Electric utility lids now incorporate temperature probes to monitor underground cables, expanding their functionality beyond mechanical protection. Gas networks are transitioning to composites to mitigate sparking risks, while rail and airport applications pay premiums for custom vibration-tolerant lids.
Telecom buyers replace RF-transparent lids every 8-12 years, creating recurring revenue and expanding the market size within this niche. In contrast, municipal road lids follow replacement cycles of 20-30 years unless theft accelerates the timeline. Performance, rather than material, is becoming the primary specification driver, with solution providers bundling sensors, analytics, and training to challenge the traditional dominance of foundries.
Geography Analysis
Europe accounted for 40.38% of the manhole covers market share in 2025, underpinned by EN 124:2015, which harmonizes load classes A15-F900. Germany, the UK, France, and Italy represent the majority of regional volume, and NORDIC utilities favor composites for freeze-thaw durability. Spain’s Barcelona and Madrid pilots integrate LoRaWAN lids, yet decision rights lie with regional councils, slowing standard adoption. Russia relies on joint ventures to supply ductile-iron lids domestically, but sanctions have stunted technology upgrades.
Asia-Pacific will post the fastest 5.73% CAGR through 2031, propelled by China’s capacity jump to 17.65 million units by 2030, which overhangs prices across ASEAN. India’s non-standard tender rules allow unorganized shops, yet Smart Cities Mission funds still provide volume, making the region primarily price-led. Japan and South Korea enforce odor-filter mandates, producing a high-margin replacement cycle every 18-24 months. Belt-and-Road projects in Indonesia and Vietnam expand transport corridors but specify low-cost cast iron, so composite inroads stay niche.
North America faces a USD 176 billion wastewater backlog, and manhole upgrades fold into that capex. Charlotte Pipe’s 2026 Neenah takeover consolidates cast-iron output, aiming for scale against margin volatility. Gilbert, Arizona’s polymer-concrete rollout proves that documented lifecycle savings override upfront cost objections, but AASHTO M306 still guards highway segments for ductile iron. Mexico leans on industrial builds tied to near-shoring, while Brazil and Argentina stay price sensitive, adopting composites only in theft hot-spots. Middle-East megacities like NEOM issue large but lumpy tenders; thus, supplier forecasts hinge on a handful of giga-projects.

Competitive Landscape
The market is moderately concentrated. Charlotte Pipe’s acquisition of Neenah Foundry pools more than USD 500 million in sales and 2,000 staff, giving leverage on scrap contracts and ASTM compliance. McWane’s Oskaloosa expansion doubles ductile-iron capacity and installs automated molding to sharpen cost curves, yet company filings admit composites threaten medium-term margins.
Solution-oriented players like Fibrelite and Polieco Group differentiate via RF-transparent composites, locking mechanisms, and data APIs that justify 30-50% premiums. AT&T’s 2024 order for 1,200 smart lids validates the tech path. Chinese challenger Guangzhou Bangxun embeds NB-IoT at half Western price points but faces U.S. export-control headwinds. Standard enforcement divides the battlefield: EN 124 and AASHTO-M306 compliance gatekeeps heavy-traffic segments, while the still-nascent micro-plastic rulebook could reshuffle polymer-concrete leadership by 2028.
Suppliers target white spaces: sensor-ready lids for urban surveillance, lightweight lids for EV-charging bays, and bio-filter lids for dense metros. Those that integrate cloud analytics or offer service contracts will pull ahead once smart-city funding scales in 2027-2029.
Manhole Covers Industry Leaders
EJ Group, Inc.
Neenah Foundry
Crescent Foundry
Fibrelite Composites Ltd.
Saint-Gobain PAM
- *Disclaimer: Major Players sorted in no particular order

Recent Industry Developments
- November 2025: Charlotte Pipe and Foundry Company, together with Neenah Foundry, announced the acquisition of Bingham & Taylor, a family-owned manufacturer specializing in underground infrastructure access solutions for water and gas utility customers across North America. This acquisition is expected to strengthen their position in the manhole covers market by expanding their product offerings and customer base.
- August 2025: Clow Valve, a division of McWane, LLC, inaugurated its USD 80 million foundry expansion in Oskaloosa, Iowa. This expansion enhanced the company's production capabilities, including components like manhole covers, which are essential in infrastructure development.


Global Manhole Covers Market Report Scope
Manhole covers are robust, removable plates, usually round or square, designed to seal access points to underground utility, sewage, or drainage systems. Constructed from durable materials such as cast iron, ductile iron, or fiberglass-reinforced plastic (FRP), they prevent unauthorized access, ensure safety, and withstand heavy traffic loads while adhering to standards like EN 124.
The Manhole Covers Market is segmented into material type, application, and geography. By material type, the market is segmented into cast iron, ductile iron, steel, reinforced concrete, polymer concrete, composite materials, and other material types (HDPE, FRP, etc.). By application, the market is segmented into road infrastructure, water and waste-water, telecommunication and data, electric and power utility, gas distribution, rail and airport, and industrial and commercial facilities. The report also covers the market size and forecasts for manhole covers in 17 countries across major regions. For each segment, the market sizing and forecasts have been done on the basis of value (USD).
| Cast Iron |
| Ductile Iron |
| Steel |
| Reinforced Concrete |
| Polymer Concrete |
| Composite Materials |
| Other Material Types (HDPE, FRP, etc.) |
| Road Infrastructure |
| Water and Waste-water |
| Telecommunication and Data |
| Electric and Power Utility |
| Gas Distribution |
| Rail and Airport |
| Industrial and Commercial Facilities |
| Asia-Pacific | China |
| India | |
| Japan | |
| South Korea | |
| ASEAN Countries | |
| Rest of Asia-Pacific | |
| North America | United States |
| Canada | |
| Mexico | |
| Europe | Germany |
| United Kingdom | |
| France | |
| Italy | |
| Spain | |
| Russia | |
| NORDIC Countries | |
| Rest of Europe | |
| South America | Brazil |
| Argentina | |
| Rest of South America | |
| Middle-East and Africa | Saudi Arabia |
| South Africa | |
| Rest of Middle-East and Africa |
| By Material Type | Cast Iron | |
| Ductile Iron | ||
| Steel | ||
| Reinforced Concrete | ||
| Polymer Concrete | ||
| Composite Materials | ||
| Other Material Types (HDPE, FRP, etc.) | ||
| By Application | Road Infrastructure | |
| Water and Waste-water | ||
| Telecommunication and Data | ||
| Electric and Power Utility | ||
| Gas Distribution | ||
| Rail and Airport | ||
| Industrial and Commercial Facilities | ||
| By Geography | Asia-Pacific | China |
| India | ||
| Japan | ||
| South Korea | ||
| ASEAN Countries | ||
| Rest of Asia-Pacific | ||
| North America | United States | |
| Canada | ||
| Mexico | ||
| Europe | Germany | |
| United Kingdom | ||
| France | ||
| Italy | ||
| Spain | ||
| Russia | ||
| NORDIC Countries | ||
| Rest of Europe | ||
| South America | Brazil | |
| Argentina | ||
| Rest of South America | ||
| Middle-East and Africa | Saudi Arabia | |
| South Africa | ||
| Rest of Middle-East and Africa | ||


Key Questions Answered in the Report
What is the size of the manhole covers market?
The manhole covers market stands at USD 6.01 billion in 2026 and is forecast to reach USD 7.66 billion by 2031.
Which material type is growing fastest through 2031?
Composite materials are projected to grow at a 5.88% CAGR through 2031 because they deter theft and support 5G signal transparency.
Why are telecom utilities investing in new manhole covers?
5G densification needs RF-transparent access points every few hundred meters, and cast-iron lids attenuate signals, so utilities specify composites even at premium prices.
What is Europe’s competitive advantage in this sector?
The EN 124:2015 standard harmonizes load classes A15-F900, fostering high adoption of composite and sensor-ready lids, which helped Europe to capture 40.38% of the 2025 demand.
Page last updated on:


