
Managed IT Sustainability Reporting and Carbon Management Services Market Size and Share
Market Overview
| Study Period | 2021 - 2032 |
|---|---|
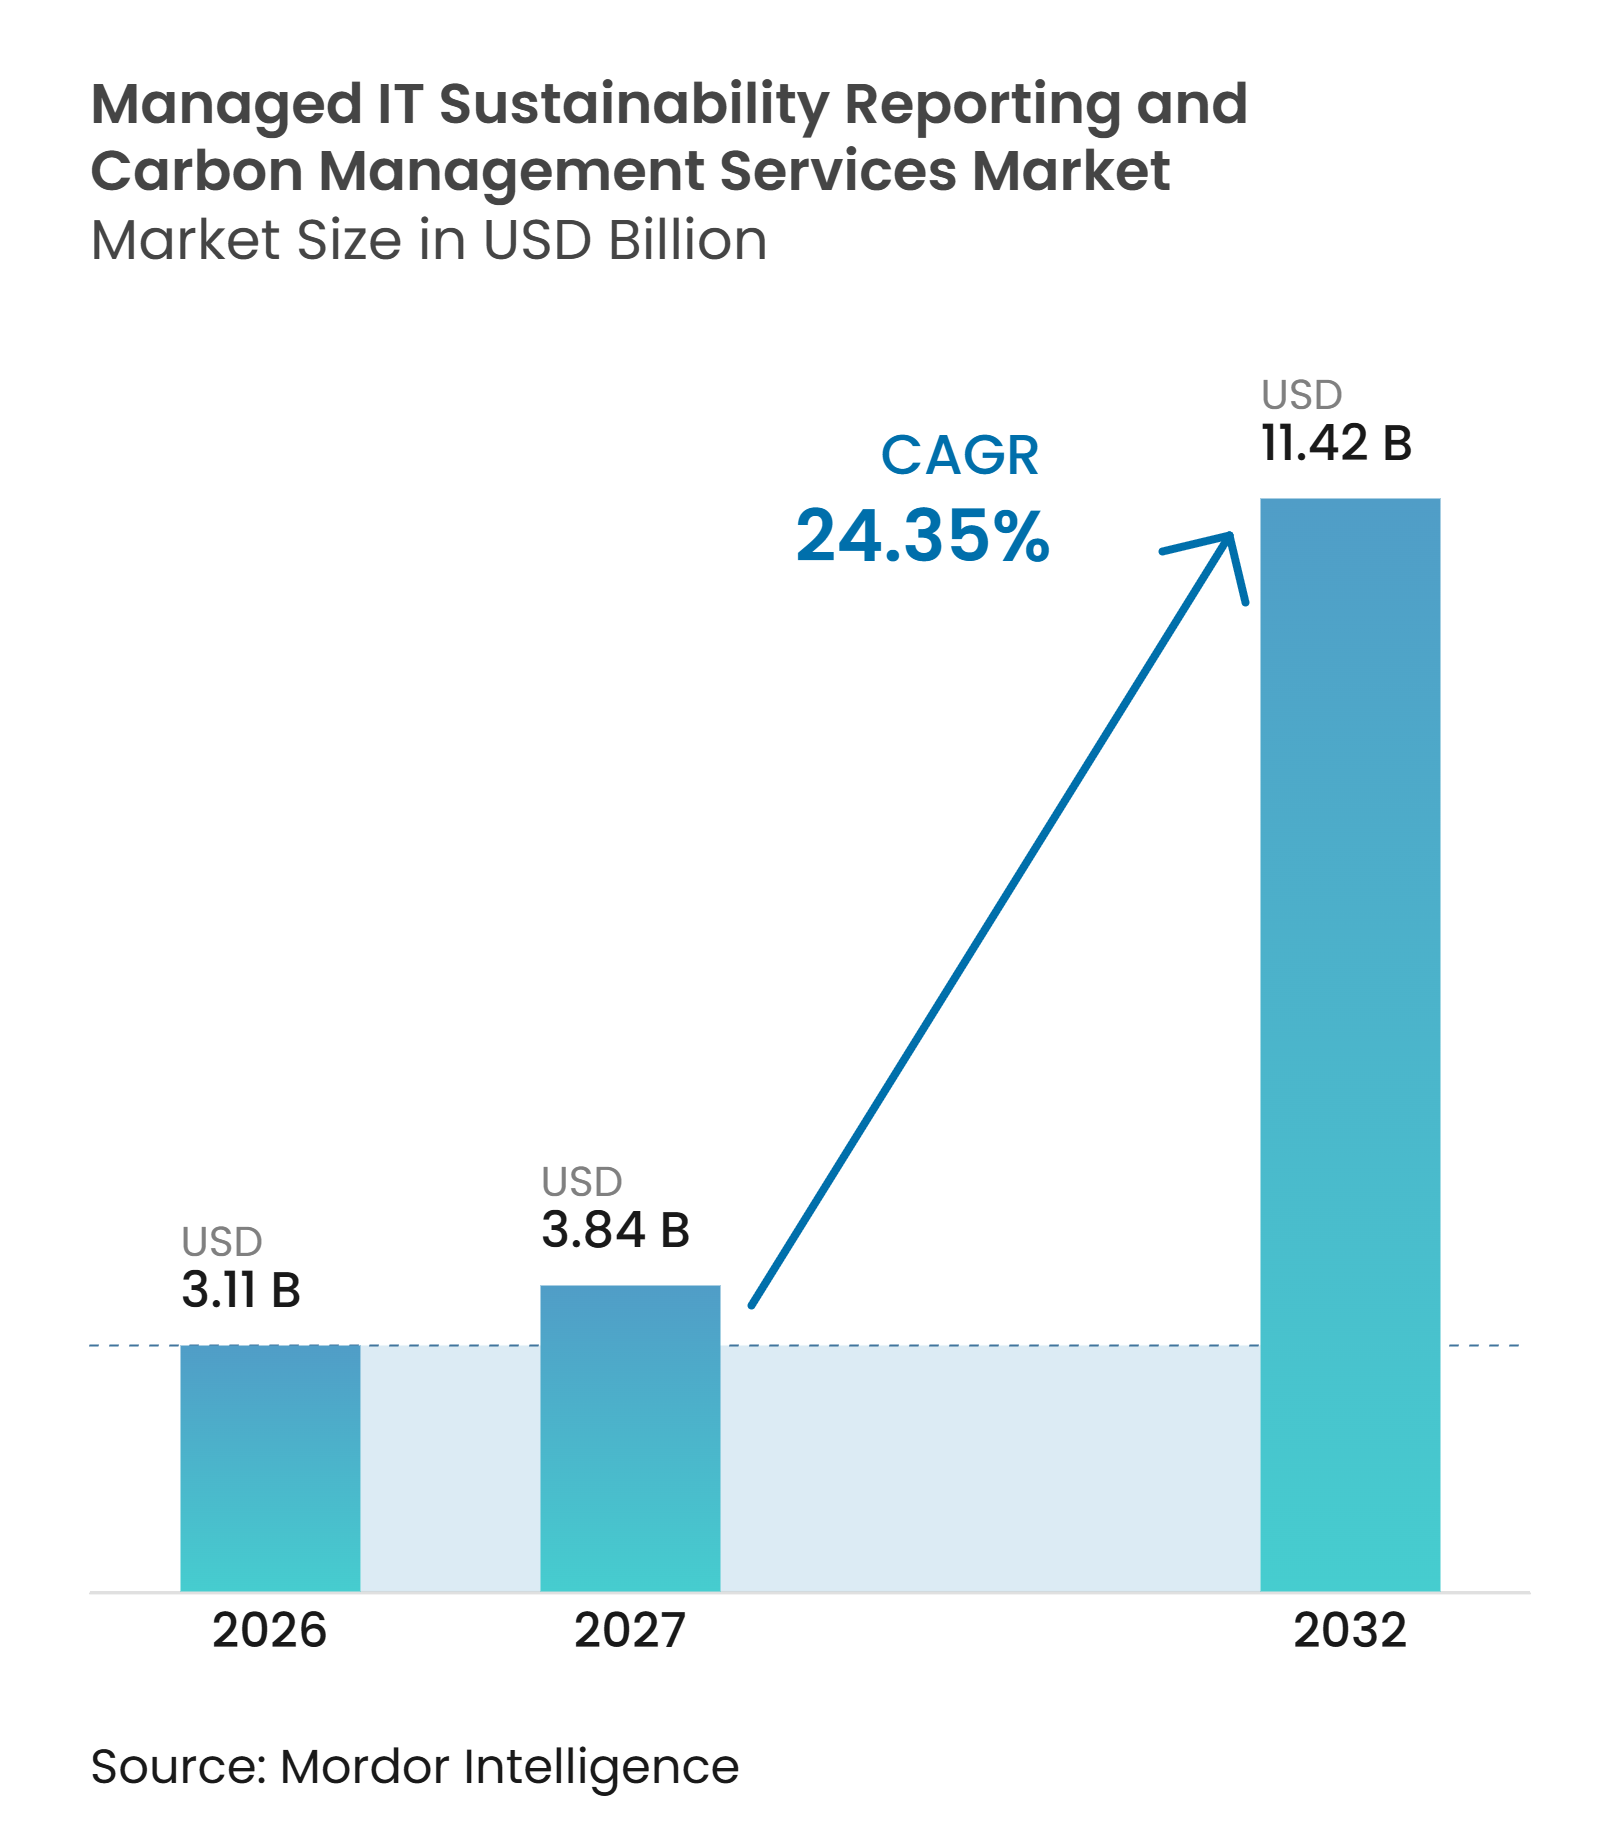
| Market Size (2027) | USD 3.84 Billion |
| Market Size (2032) | USD 11.42 Billion |
| Growth Rate (2027 - 2032) | 24.35 % |
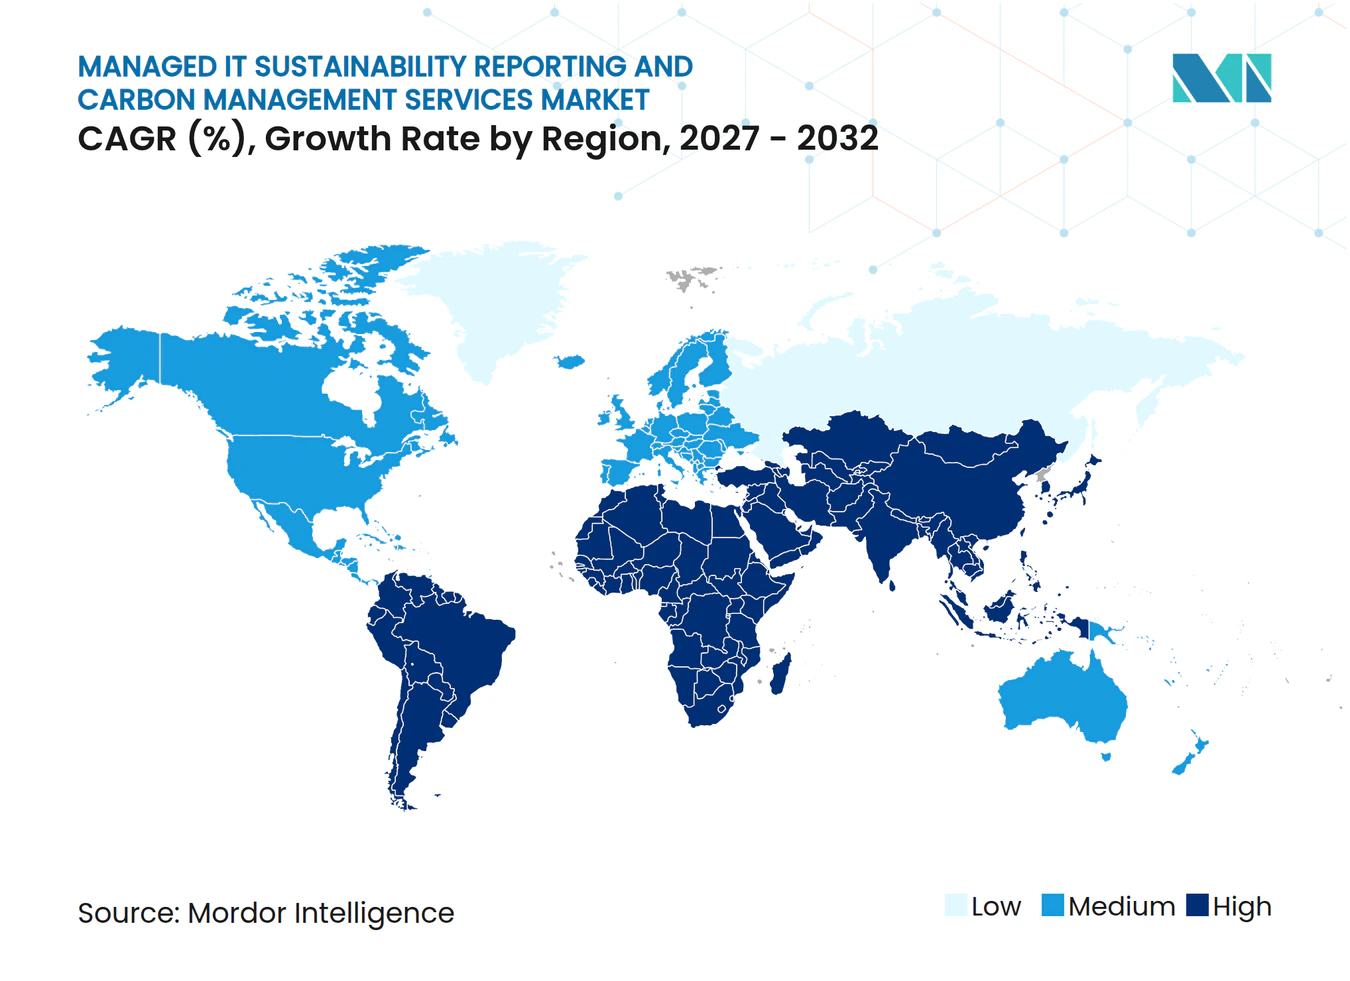
| Fastest Growing Market | Asia-Pacific |
| Largest Market | North America |
| Market Concentration | Low |
Major Players *Disclaimer: Major Players sorted in no particular order Image © Mordor Intelligence. Reuse requires attribution under CC BY 4.0. | |
Managed IT Sustainability Reporting and Carbon Management Services Market Analysis by Mordor Intelligence
The managed IT sustainability reporting and carbon management services market size is projected to expand from USD 3.11 billion in 2026 to USD 3.84 billion in 2027, and to USD 11.42 billion by 2032, registering a CAGR of 24.35% between 2027 and 2032. Mandatory disclosure requirements in California and the European Union are making auditable emissions data a regular operating requirement for many large organizations. The managed IT sustainability reporting and carbon management services market is also shifting from annual reporting work toward continuous data collection across finance, procurement, facilities, and supplier systems. Artificial intelligence is reducing manual data handling, but it raises the importance of traceable records and consistent calculation methods. Providers that combine reporting support, data management, and assurance-ready workflows can address a broader range of client needs. The managed IT sustainability reporting and carbon management services market, therefore, has room to expand even where national rules differ, because multinational companies must meet obligations across more than 1 jurisdiction.
Key Report Takeaways
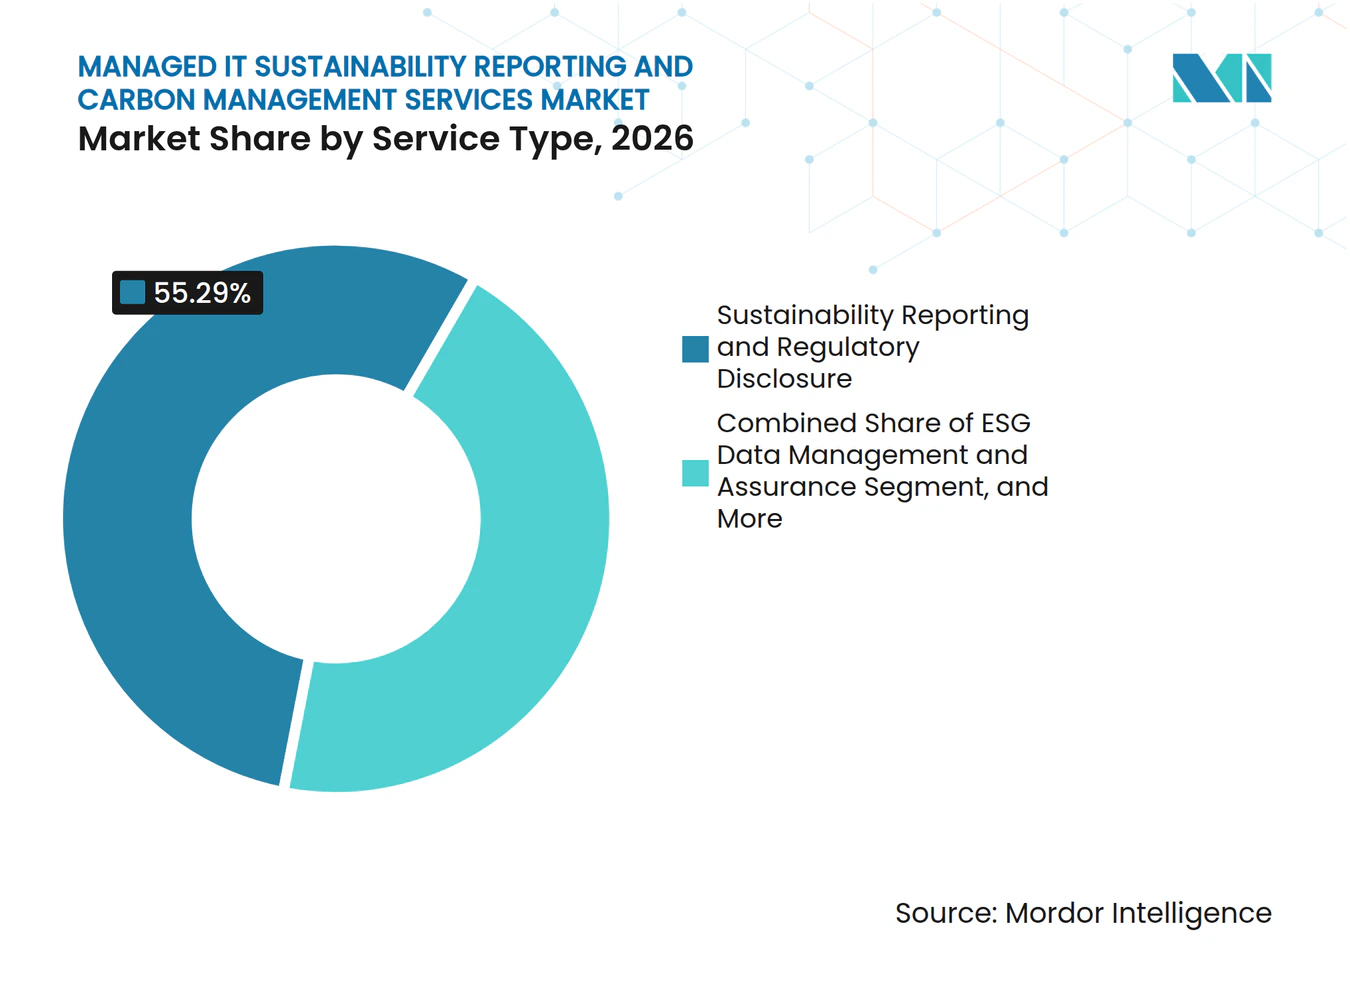
- By service type, Sustainability Reporting and Regulatory Disclosure held 55.29% of the managed IT sustainability reporting and carbon management services market share in 2026, while ESG Data Management and Assurance is projected to expand at a 25.31% CAGR through 2032.
- By deployment mode, on-premises held 67.19% of the managed IT sustainability reporting and carbon management services market in 2026, while cloud deployment is projected to expand at a 25.68% CAGR through 2032.
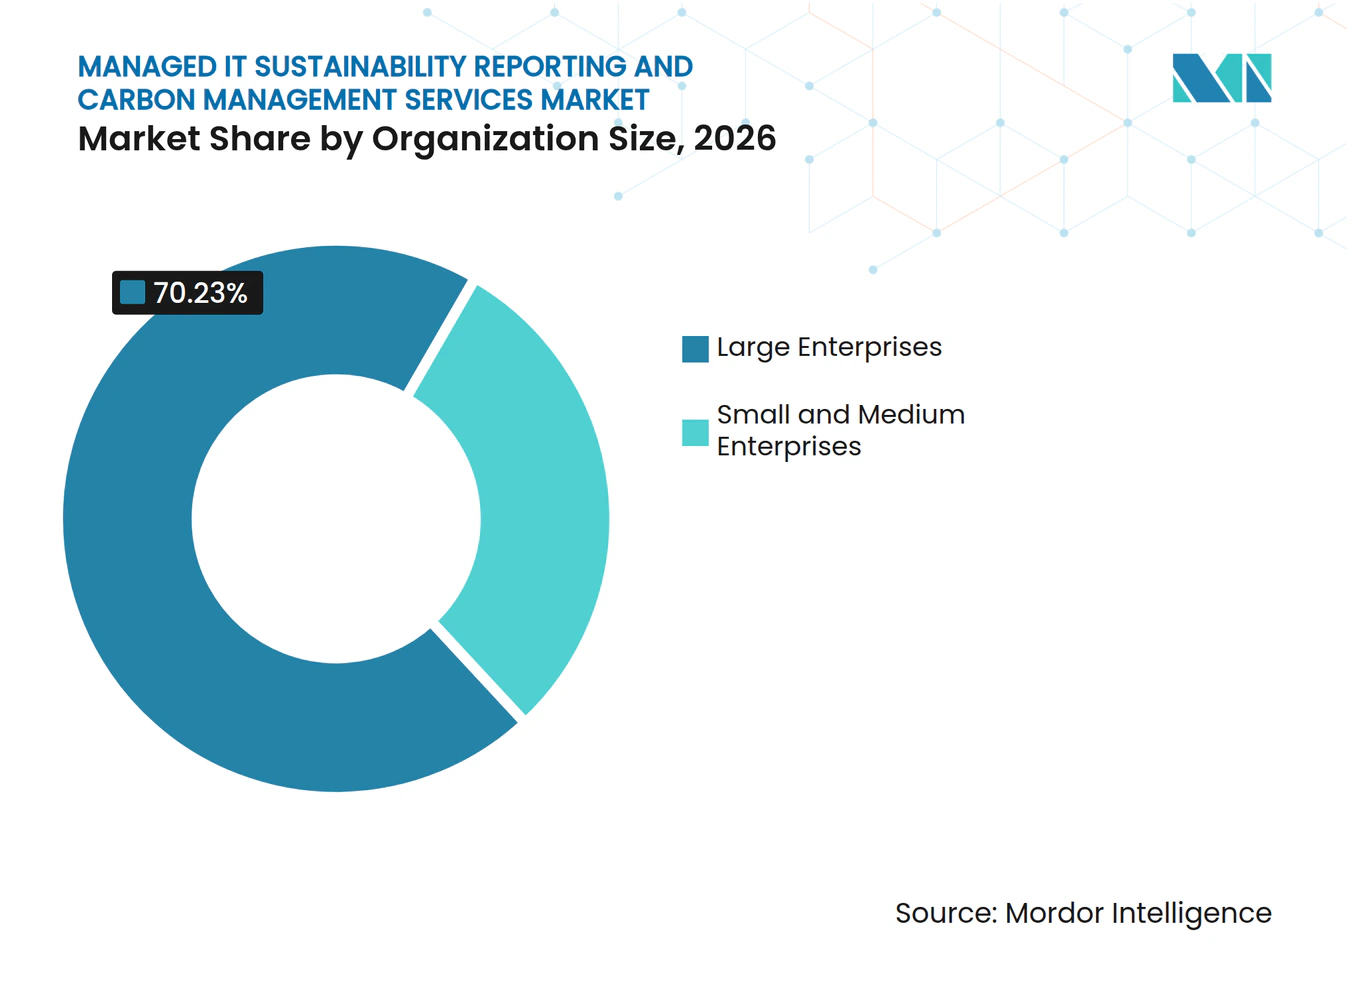
- By organization size, large enterprises held 70.23% of the managed IT sustainability reporting and carbon management services market in 2026, while small and medium enterprises are projected to expand at a 25.91% CAGR through 2032.
- By end-user industry, industrial manufacturing held 28.44% of the managed IT sustainability reporting and carbon management services market in 2026, while government and public administration is projected to expand at a 24.77% CAGR through 2032.
- By geography, North America held 36.81% of the market in 2026, while Asia-Pacific is projected to expand at a 25.05% CAGR through 2032.
Note: Market numbers in this report are based on Mordor Intelligence's proprietary estimation framework, which combines nine months of actuals with Q4 projections for base year 2026.
Global Managed IT Sustainability Reporting and Carbon Management Services Market Trends and Insights
Drivers Impact Analysis*
| Driver | (~) % Impact on CAGR Forecast | Geographic Relevance | Impact Timeline |
|---|---|---|---|
| Mandatory Climate Disclosure and Assurance Requirements | +7.5% | Global, highest intensity in the European Union and California, with spillover to Australia, Singapore, Japan, and South Korea | Short term (≤ 2 years) |
| Enterprise Net-Zero Commitments and Board-Level Accountability | +5.2% | Global, with the deepest concentration in North America and Western Europe | Medium term (2-4 years) |
| AI-Enabled Emissions Data Automation and Anomaly Detection | +4.8% | Global, with early adoption in North America and DACH and accelerating use in core Asia-Pacific countries | Short term (≤ 2 years) |
| Hyperscale Cloud and Data Center Decarbonization Investment | +3.9% | North America and the European Union, with expanding activity in Singapore, Tokyo, and Mumbai | Medium term (2-4 years) |
| Embedded Carbon Data Requirements in IT Asset Procurement and Disposition | +2.4% | European Union and North America, particularly France and Germany | Medium term (2-4 years) |
| Audit-Ready Scope 3 Data and Supplier Engagement Workflows | +2.1% | Global, with manufacturing centers in Germany, Japan, and South Korea leading adoption | Long term (≥ 4 years) |
| Source: Mordor Intelligence | |||
Mandatory Climate Disclosure and Assurance Requirements
Mandatory reporting rules create a dependable source of demand for the managed IT sustainability reporting and carbon management services market. The European Union's Corporate Sustainability Reporting Directive has moved large public-interest entities into mandatory reporting for the fiscal year 2024, while other in-scope companies follow under the revised timetable. California SB 253 requires qualifying companies that do business in the state to disclose Scope 1 and Scope 2 emissions in 2026, followed by Scope 3 emissions in 2027. The withdrawal of a federal rule does not remove state obligations or reporting duties for companies with operations subject to European rules. Organizations need systems that preserve source records, calculation logic, and review trails through the reporting process. This requirement supports recurring work in data collection, validation, reporting, and assurance preparation.
Enterprise Net-Zero Commitments and Board-Level Accountability
Board oversight is turning corporate emissions commitments into longer-term technology and service programs. Microsoft reported that it matched 100% of its electricity consumption with renewable energy in 2025, showing how large technology buyers connect climate goals to capital and operating decisions.[1] Companies seeking to meet value-chain targets need reliable supplier data as well as their own direct emissions records. That need brings procurement, finance, and sustainability teams into the same data environment. It also gives the managed IT sustainability reporting and carbon management services market demand beyond a single annual disclosure assignment. Providers can support clients through target tracking, supplier engagement, management reporting, and disclosure preparation.
AI-Enabled Emissions Data Automation and Anomaly Detection
Artificial intelligence is changing how organizations collect and assess emissions data. IFS introduced IFS Zero in May 2026 with tools for data mapping, validation, anomaly identification, and audit-ready reporting. ASUENE introduced an AI agent in March 2026 that reads invoice emails, identifies relevant files, and calculates greenhouse gas emissions without manual data entry. These functions can reduce repetitive work where utility bills, invoices, and supplier records arrive in different formats. They also make data lineage more important because a report must remain explainable to management, auditors, and regulators. The managed IT sustainability reporting and carbon management services market benefits when technology providers pair automated workflows with controls that can be reviewed.
Hyperscale Cloud and Data Center Decarbonization Investment
Data centers need detailed carbon records because their power use and equipment choices are material to company inventories. ITU-T Recommendation L.1308, published in December 2025, sets lifecycle guidance and performance measures for low-carbon data centers. A 2025 Nature study found that advanced cooling methods can reduce data center greenhouse gas emissions by 15-21% compared with air-cooled baselines. Tracking those operational changes requires activity data that can be connected to reporting frameworks. This work adds a specialized service opportunity within the managed IT sustainability reporting and carbon management services market. It also supports demand for tools that reconcile cloud, facility, and enterprise reporting data.
Restraints Impact Analysis*
| Restraint | (~) % Impact on CAGR Forecast | Geographic Relevance | Impact Timeline |
|---|---|---|---|
| High Upfront Cost of Data Integration and Process Redesign | -3.2% | Global, most acute for mid-market firms in Asia-Pacific and South America and for European Union mid-cap companies entering later reporting phases | Short term (≤ 2 years) |
| Shortage of Sustainability Data Engineering and Carbon Accounting Talent | -1.8% | Global, with severe constraints in North America, the European Union, and Asia-Pacific hyperscaler locations | Medium term (2-4 years) |
| Low Primary-Data Availability Across Multi-Cloud and Supplier Ecosystems | -1.1% | Global, particularly for complex manufacturing and retail supply chains | Medium term (2-4 years) |
| Carbon Methodology Drift Across Emission Factors, Regulatory Rules, and Organizational Boundaries | -0.7% | Global, especially for organizations operating across CSRD, ISSB, and GHG Protocol jurisdictions | Long term (≥ 4 years) |
| Source: Mordor Intelligence | |||
High Upfront Cost of Data Integration and Process Redesign
Initial implementation costs can delay adoption, especially for companies that still depend on manual spreadsheets. The cost arises when organizations connect enterprise resource planning, procurement, facilities, cloud billing, and supplier data. Smaller organizations may need to redesign processes before they can use a reporting platform consistently. The Danish Business Authority's automated sustainability reporting initiative addresses this issue by providing common digital formats and shared infrastructure for small and medium-sized enterprises. Managed service arrangements in the managed IT sustainability reporting and carbon management services market can spread integration expertise across clients, although first-year setup work still affects buying decisions.
Shortage of Sustainability Data Engineering and Carbon Accounting Talent
The managed IT sustainability reporting and carbon management services market depends on staff who understand data systems, emissions accounting, and reporting rules. Many companies have difficulty hiring people who can connect these disciplines. Small and medium enterprises face added pressure because they compete with larger companies for trained staff. The World Economic Forum noted that the cost of external support and the challenge of retaining trained people can prevent smaller firms from maintaining assurance-grade reporting functions. Outsourcing can improve access to specialist skills, but providers must also build sufficient delivery capacity.
*Our forecasts treat driver/restraint impacts as directional, not additive. The impact forecasts reflect baseline growth, mix effects, and variable interactions.
Segment Analysis
By Service Type: Regulatory Disclosure Leads While ESG Data Management Gains Importance
Sustainability Reporting and Regulatory Disclosure held 55.29% of the managed IT sustainability reporting and carbon management services market in 2026. Companies commonly begin with reporting because statutory and investor requirements have fixed deadlines. This service includes the organization of emissions records, framework mapping, report preparation, and support for assurance. IT Carbon Accounting and Emissions Measurement supports the calculations that feed each disclosure. Sustainability Strategy and Transformation supports operating changes that follow when management uses emissions information in business decisions.
ESG Data Management and Assurance is projected to expand at a 25.31% CAGR through 2032. Organizations that have completed an early reporting cycle often find that their data sits across finance, procurement, facilities, cloud, and supplier systems. They need controlled data flows rather than one-time collections at the end of the year. Persefoni reported that its platform had more than 8,000 users in over 100 countries during 2025, with language support expanded for global operations. The managed IT sustainability reporting and carbon management services market is moving toward managed data operations, assurance support, and multi-framework reconciliation. Other service types continue to play a role in IT asset carbon tracking and product-level footprinting.



By Deployment Mode: On-Premises Retains Control Advantages as Cloud Use Expands
On-premises deployment accounted for 67.19% of the managed IT sustainability reporting and carbon management services market in 2026. Large organizations often treat carbon records like financial records because they may be assured and reviewed by regulators. Data residency, legal review, and internal controls are important considerations in DACH markets and financial services. A controlled environment can also help a company show how it moved from source data to a disclosed result. Existing on-premises systems often support multi-year service contracts for providers.
Cloud deployment is projected to expand at a 25.68% CAGR through 2032. Cloud tools can update emission-factor libraries and connect distributed users with fewer local infrastructure requirements. They are also suitable for small and medium enterprises that prefer subscription spending over a large upfront system investment. The cloud model supports supplier portals for Scope 3 data collection across many locations. Hybrid deployment remains relevant when companies retain on-site financial-system links but use cloud services for supplier engagement.
By Organization Size: Large Enterprises Lead While Small and Medium Enterprises Accelerate
Large enterprises accounted for 70.23% of the managed IT sustainability reporting and carbon management services market in 2026. These organizations operate across multiple business units, jurisdictions, and supply chains. They face major disclosure obligations and often have formal climate targets that need board oversight. Their reporting programs require ongoing management of data, calculations, evidence, and approvals. The scale of these needs supports higher-value managed service engagements.
Small and medium enterprises are projected to expand at a 25.91% CAGR through 2032. Their demand is increasingly shaped by requests from large customers that need supplier emissions data for Scope 3 reporting. Sage reported in 2025 that 8% of small and medium enterprises invested in formal sustainability reporting, while 62% identified complexity as a primary obstacle. Standardized data formats and managed tools can lower the administrative burden for smaller suppliers. The Danish automated reporting initiative also illustrates a public effort to simplify data sharing for this group in the managed IT sustainability reporting and carbon management services market.

By End-User Industry: Manufacturing Anchors Demand While Public Administration Expands
Industrial manufacturing held 28.44% of the managed IT sustainability reporting and carbon management services market in 2026. Manufacturers must manage direct operational data as well as upstream and downstream supply chain information. European import requirements and customer requests create added demand for cradle-to-gate carbon documentation. BFSI uses these services for financial emissions and governance needs. IT and telecommunications needs reflect direct data center emissions, while retail and e-commerce companies need supplier data across broad product ranges.
Government and public administration is projected to expand at a 24.77% CAGR through 2032. The United Kingdom's 2025-26 guidance requires central government bodies that produce annual reports and accounts to make TCFD-aligned disclosures, including reporting on Scope 1 and Scope 2 emissions.[2] The Department for Energy Security and Net Zero issued public-sector emissions measurement guidance in October 2026. Public mandates can affect procurement practices when agencies ask suppliers for comparable sustainability information. Healthcare, life sciences, education, and research organizations broaden the client base for the managed IT sustainability reporting and carbon management services market as reporting expectations reach more institutions.
Geography Analysis
North America held 36.81% of the managed IT sustainability reporting and carbon management services market share in 2026. The United States combines changing federal rules with California's separate statutory disclosure requirements, while Canada and Mexico add further reporting and compliance considerations for organizations operating across the region. California SB 253 applies to qualifying large companies that do business in the state and sets phased requirements for Scope 1, Scope 2, and Scope 3 reporting. United States companies with European operations also need to consider their exposure to CSRD reporting.
Europe is the second-largest region in the managed IT sustainability reporting and carbon management services market. The Corporate Sustainability Reporting Directive and European Sustainability Reporting Standards make auditable environmental data a central requirement for many companies. Germany, France, the United Kingdom, and the Netherlands have a mature demand for reporting and data management tools. NETZSCH Group reported in September 2025 that it had completed its first CSRD-compliant sustainability report, including a double materiality analysis, EU Taxonomy reporting, and initial capture of Scope 3 emissions. This level of work shows why organizations need technology, system integration, and specialized service support.
Asia-Pacific is projected to expand at a 25.05% CAGR through 2032. Japan, Singapore, Thailand, and South Korea are introducing or strengthening expectations for emissions disclosure. In September 2025, SMC and NTT Data began offering free access to the C-Turtle greenhouse gas visualization platform to about 600 domestic Japanese suppliers.[3] The program uses supplier-specific primary data to improve Scope 3 calculations. China has the largest installed base in the region, while India is developing under its Business Responsibility and Sustainability Reporting requirements.
Competitive Landscape
Market Concentration
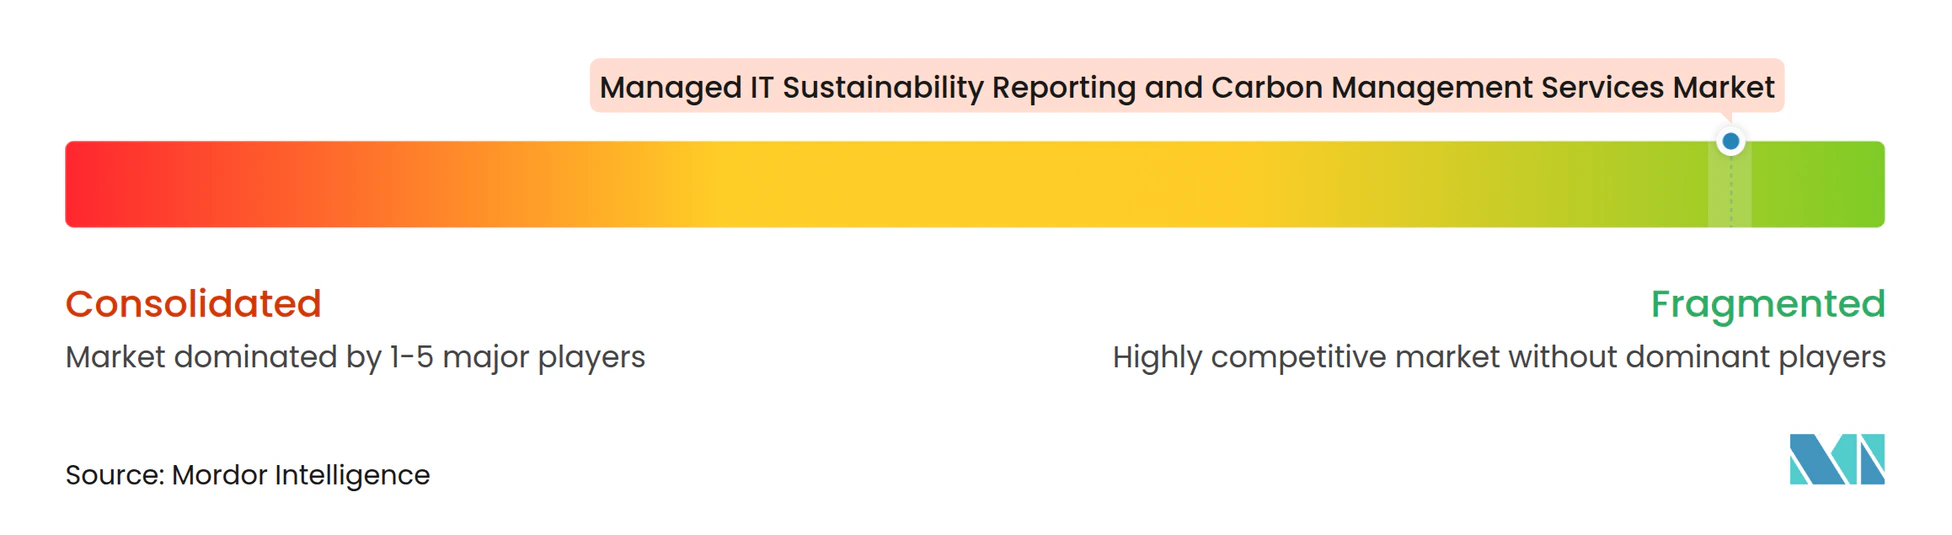
The managed IT sustainability reporting and carbon management services market has more than 100 active providers across carbon accounting, ESG, EHS, supply-chain analytics, and enterprise software. No individual provider has the concentration described for a dominant market structure. Pure-play platforms compete on emissions methodology, Scope 3 coverage, automation, and assurance-ready records. Larger software vendors compete through integration with operational risk, safety, procurement, and enterprise resource planning systems. This mix gives buyers a choice between specialized capability and wider software coverage.
Providers are strengthening their positions through data partnerships and integrations. EcoVadis added Carbmee as a strategic Carbon Data Network partner in April 2026, following integrations with Sweep, Normative, and Watershed. The network is intended to replace spend-based Scope 3 estimates with supplier-specific emissions data. In September 2025, Sphera and Evonik launched a TÜV-certified process for automated life cycle assessments in the chemical sector. Sphera stated that the process can complete assessments within days, where manual work had required weeks.
Standards alignment and supplier data access are becoming more important in competitive decisions. Sweep became an official ISSB licensee in September 2025, enabling it to provide interoperable sustainability data under IFRS S1 and S2.[4] Large enterprise resource planning vendors can create price pressure in standard Scope 1 and Scope 2 reporting. Specialists can respond through assurance support, complex Scope 3 workflows, and multi-framework governance. Government programs, IT asset carbon tracking, and real-time carbon data interfaces remain areas with open demand.
Managed IT Sustainability Reporting and Carbon Management Services Industry Leaders
-
Greenly SAS
-
Watershed Technology, Inc.
-
Persefoni AI, Inc.
-
Sweep SAS
-
Unravel Carbon, Inc.
- *Disclaimer: Major Players sorted in no particular order
Recent Industry Developments
- October 2026: Sweep SAS and CFGI announced a strategic partnership combining Sweep's sustainability data management platform with CFGI's technical accounting, internal controls, and ESG program management expertise, targeting enterprise clients requiring audit-ready non-financial data.
- September 2026: Greenly SAS and Normative AB announced a merger to create what they described as the world's largest climate software provider, combining 4,000 customers across 30 countries and more than 500 million tonnes of CO₂ under management. The combined entity targets ARR growth from EUR 30 million (USD 32.5 million) to EUR 50 million (USD 54.2 million) over 3 years, building a transatlantic platform spanning carbon accounting, LCA, supply-chain emissions, energy management, and multi-framework ESG compliance.
- June 2026: Sweep SAS and HowGood announced a partnership integrating HowGood's database of more than 12 million product carbon footprints across food and agricultural supply chains directly into Sweep's platform, enabling ingredient-level Scope 3 accounting for food and agriculture enterprises without manual data transfer.
- May 2026: Arcadis announced a global partnership with Sweep SAS to combine Sweep's SaaS sustainability data management platform with Arcadis' sustainability advisory and asset management expertise, targeting enterprise clients in the United States with integrated platform deployment and consulting delivery.
Global Managed IT Sustainability Reporting and Carbon Management Services Market Report Scope
The Managed IT Sustainability Reporting and Carbon Management Services Market comprises outsourced services that help organizations measure, manage, report, and optimize sustainability performance and carbon emissions associated with IT operations, digital infrastructure, cloud environments, and technology assets. These services include carbon accounting, emissions measurement, ESG data management, regulatory reporting, assurance support, and sustainability transformation initiatives.
The Managed IT Sustainability Reporting and Carbon Management Services Market Report is Segmented by Service Type (IT Carbon Accounting and Emissions Measurement, Sustainability Reporting and Regulatory Disclosure, ESG Data Management and Assurance, Sustainability Strategy and Transformation, and Other Service Types), Deployment Mode (On-Premises, Cloud, and Hybrid), Organization Size (Large Enterprises, and Small and Medium Enterprises), End-User Industry (Banking, Financial Services, and Insurance [BFSI], Government and Public Administration, Healthcare and Life Sciences, IT and Telecommunication, Industrial Manufacturing, Retail and E-commerce, Education and Research Institutions, and Other End-User Industries), and Geography (North America, South America, Europe, Asia-Pacific, Middle East, and Africa). The Market Forecasts are Provided in Terms of Value (USD).
| IT Carbon Accounting and Emissions Measurement |
| Sustainability Reporting and Regulatory Disclosure |
| ESG Data Management and Assurance |
| Sustainability Strategy and Transformation |
| Other Service Types |
| On-Premises |
| Cloud |
| Hybrid |
| Large Enterprises |
| Small and Medium Enterprises |
| Banking, Financial Services, and Insurance (BFSI) |
| Government and Public Administration |
| Healthcare and Life Sciences |
| IT and Telecommunication |
| Industrial Manufacturing |
| Retail and E-commerce |
| Education and Research Institutions |
| Other End-User Industries |
| North America | United States |
| Canada | |
| Mexico | |
| South America | Brazil |
| Argentina | |
| Rest of South America | |
| Europe | Germany |
| United Kingdom | |
| France | |
| Italy | |
| Russia | |
| Rest of Europe | |
| Asia-Pacific | China |
| Japan | |
| India | |
| South Korea | |
| Rest of Asia-Pacific | |
| Middle East | Saudi Arabia |
| United Arab Emirates | |
| Rest of Middle East | |
| Africa | South Africa |
| Nigeria | |
| Rest of Africa |
| By Service Type | IT Carbon Accounting and Emissions Measurement | |
| Sustainability Reporting and Regulatory Disclosure | ||
| ESG Data Management and Assurance | ||
| Sustainability Strategy and Transformation | ||
| Other Service Types | ||
| By Deployment Mode | On-Premises | |
| Cloud | ||
| Hybrid | ||
| By Organization Size | Large Enterprises | |
| Small and Medium Enterprises | ||
| By End-User Industry | Banking, Financial Services, and Insurance (BFSI) | |
| Government and Public Administration | ||
| Healthcare and Life Sciences | ||
| IT and Telecommunication | ||
| Industrial Manufacturing | ||
| Retail and E-commerce | ||
| Education and Research Institutions | ||
| Other End-User Industries | ||
| By Geography | North America | United States |
| Canada | ||
| Mexico | ||
| South America | Brazil | |
| Argentina | ||
| Rest of South America | ||
| Europe | Germany | |
| United Kingdom | ||
| France | ||
| Italy | ||
| Russia | ||
| Rest of Europe | ||
| Asia-Pacific | China | |
| Japan | ||
| India | ||
| South Korea | ||
| Rest of Asia-Pacific | ||
| Middle East | Saudi Arabia | |
| United Arab Emirates | ||
| Rest of Middle East | ||
| Africa | South Africa | |
| Nigeria | ||
| Rest of Africa | ||
Key Questions Answered in the Report
What is the size of the managed IT sustainability reporting and carbon management services market?
The market is projected to be USD 3.84 billion in 2027 and USD 11.42 billion by 2032, with a 24.35% CAGR over 2027-2032. Reporting, data management, and assurance support account for the core service need.
What is driving demand for carbon management services?
Mandatory disclosure rules, enterprise climate commitments, and the need for audit-ready Scope 3 data are central demand factors. Multinational companies also need consistent records across different reporting frameworks.
Which service type leads managed sustainability reporting demand?
Sustainability Reporting and Regulatory Disclosure led with a 55.29% share in 2026, while ESG Data Management and Assurance has the highest projected CAGR at 25.31%. The latter addresses recurring data-quality and assurance requirements.
Why are small and medium enterprises adopting carbon reporting tools?
Large customers increasingly request supplier emissions data, while managed tools and common data formats can reduce administrative complexity. Procurement requirements are a key reason for supplier adoption.
Which region is expected to expand fastest through 2032?
Asia-Pacific is projected to expand at a 25.05% CAGR through 2032, supported by emerging reporting rules and supply-chain data programs. Japan's supplier platform deployments illustrate this operational shift.
How are AI tools used in sustainability reporting?
AI tools can extract invoice and utility data, identify anomalies, and support the preparation of traceable emissions records. Their value depends on review controls and clear data lineage.