Market Overview
| Study Period | 2020 - 2031 |
|---|---|
| Forecast Data Period | 2026 - 2031 |
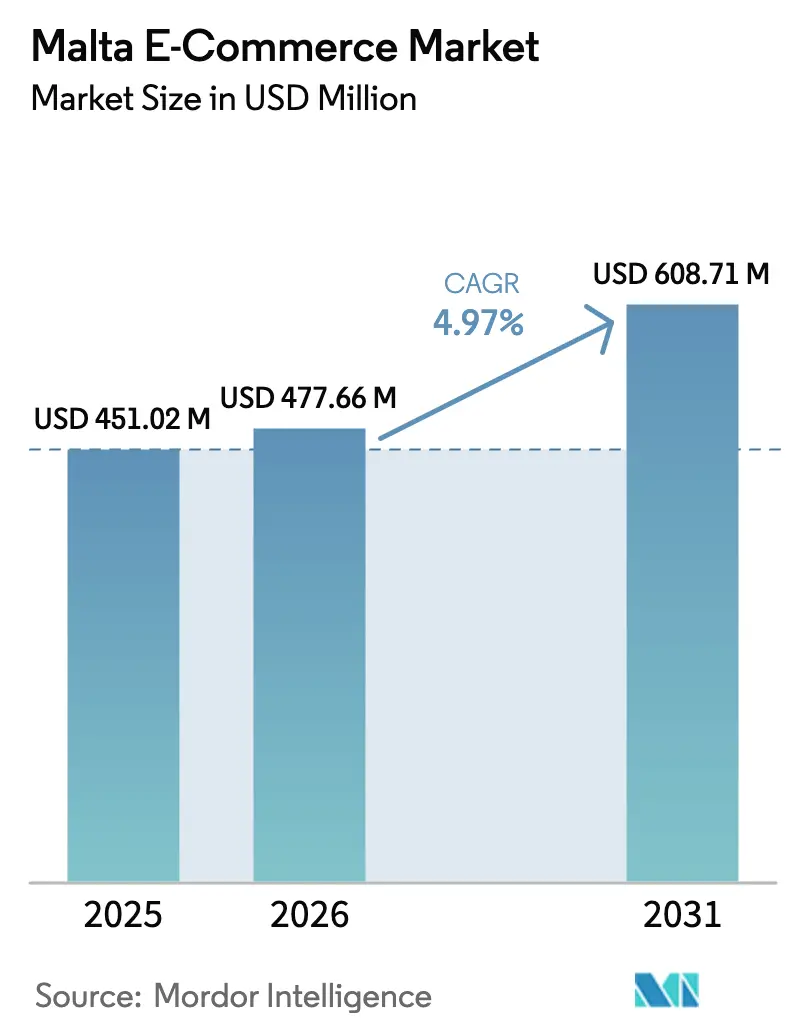
| Base Year Market Size (2025) | USD 451.02 Million |
| Market Size (2026) | USD 477.66 Million |
| Market Size (2031) | USD 608.71 Million |
| Growth Rate (2026 - 2031) | 4.97% CAGR |
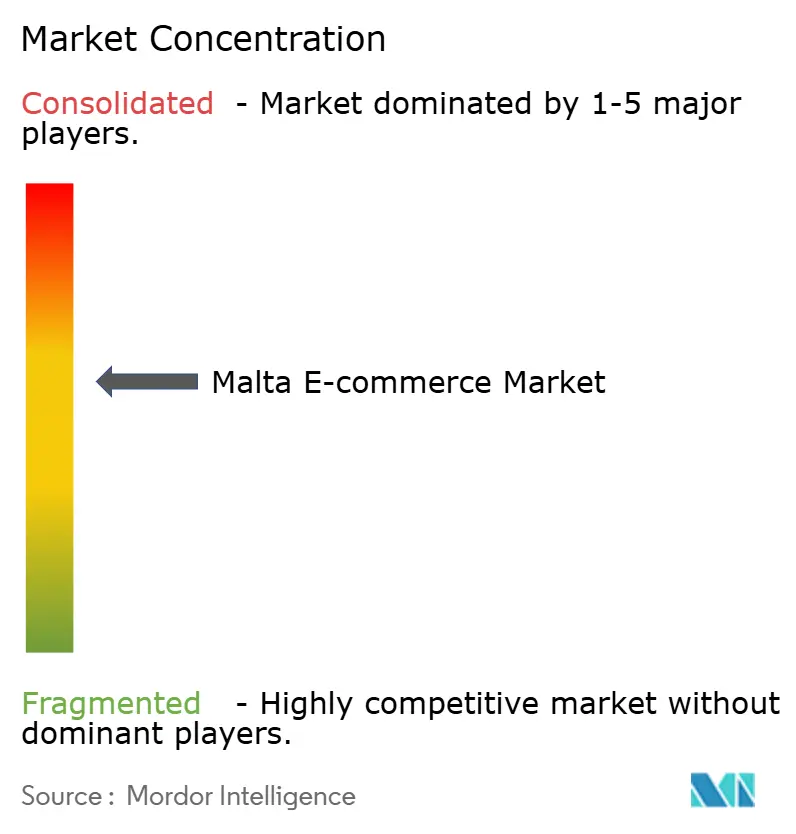
| Market Concentration | Medium |
Major Players *Disclaimer: Major Players sorted in no particular order Image © Mordor Intelligence. Reuse requires attribution under CC BY 4.0. | |
Malta E-Commerce Market Analysis by Mordor Intelligence
The Malta e-commerce market size is expected to grow from USD 451.02 million in 2025 to USD 477.66 million in 2026 and is forecast to reach USD 608.71 million by 2031 at 4.97% CAGR over 2026-2031. Robust fibre-to-the-home coverage, 100% 5G population reach, and English-language fluency collectively broaden the addressable base for the Malta e-commerce market. Cross-border sales already represent 38% of total spend, helped by streamlined value-added-tax filing under the National e-Commerce Strategy. Persistent cash-on-delivery habits, warehouse shortages, and high island surcharges temper the speed of monetization, yet instant-payment adoption and buy-now-pay-later (BNPL) penetration are lifting conversion rates. Moderate competitive intensity keeps pricing rational, while merchant interest in platform-as-a-service tools accelerates storefront launches and omnichannel experimentation.
Key Report Takeaways
- By business model, B2C transactions commanded 84.34% of the Malta e-commerce market in 2025, whereas B2B is advancing at a 6.57% CAGR through 2031.
- By device type, smartphones generated 69.42% of the Malta e-commerce market in 2025 and are on track for a 5.13% CAGR to 2031.
- By payment method, digital wallets captured 37.68% of the Malta e-commerce market in 2025, while BNPL is set for the fastest growth at 7.23% CAGR.
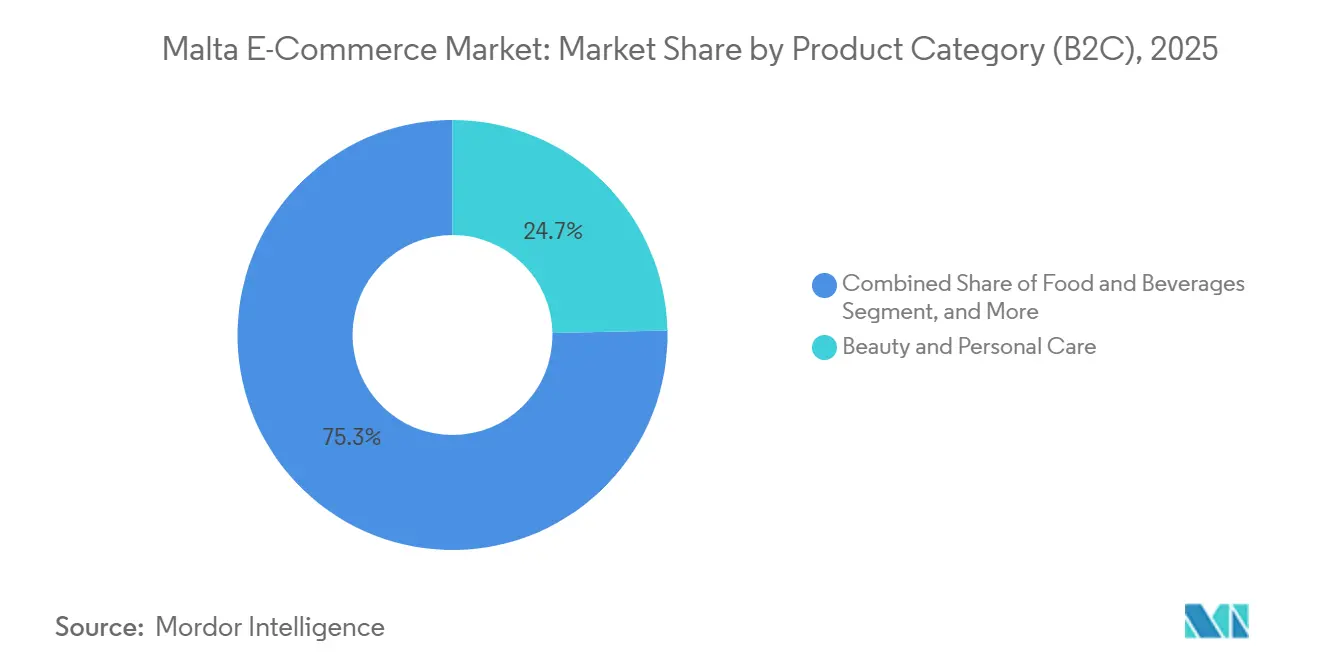
- By product category, beauty and personal care led with 24.67% of the Malta e-commerce market in 2025, whereas food and beverages are forecast to expand at a 6.28% CAGR to 2031.
Note: Market size and forecast figures in this report are generated using Mordor Intelligence’s proprietary estimation framework, updated with the latest available data and insights as of January 2026.
Malta E-Commerce Market Trends and Insights
Drivers Impact Analysis*
| Driver | (~) % Impact on CAGR Forecast | Geographic Relevance | Impact Timeline |
|---|---|---|---|
| Nationwide Fibre Broadband Coverage Reaching 95% of Households | +1.2% | National, early gains in Sliema, St. Julian's, Valletta urban core | Medium term (2-4 years) |
| National e-Commerce Strategy 2024-2030 Offering VAT Incentives to SMEs | +0.9% | National, strongest uptake in Birkirkara, Mosta SME clusters | Medium term (2-4 years) |
| Strong Expat and Digital-Nomad Population Boosting Cross-Border Basket Values | +1.1% | National, concentrated in Sliema, St. Julian's, Gzira | Short term (≤ 2 years) |
| High English Proficiency Enabling Adoption of International Platforms | +0.8% | Global relevance for cross-border inflows; national for platform choice | Long term (≥ 4 years) |
| PSD2-Driven Instant Payments Increasing Shopper Trust | +0.7% | EU-wide, with Malta benefiting from Central Bank soft launch December 2024 | Medium term (2-4 years) |
| e-ID and e-Signature Adoption Facilitating Seamless Onboarding | +0.5% | National, supporting digital identity verification for fintech and marketplaces | Long term (≥ 4 years) |
| Source: Mordor Intelligence | |||
Nationwide Fibre Broadband Coverage Reaching 95% of Households
GO plc finished its EUR 100 million (USD 113 million) build-out in May 2025, passing 371,000 homes. Universal gigabit access enables merchants to add video consultations and augmented-reality previews, features that require 12-18 months of backend integration before revenue impact materializes.[1]European Commission, “Digital Economy and Society Index (DESI),” ec.europa.eu Fibre also supports click-and-collect networks that cut last-mile costs by 30% for electronics retailers such as Scan Malta, while open-access regulation prevents monopoly pricing on consumer broadband.[2]Malta Communications Authority, “National e-Commerce Strategy 2024-2030,” mca.org.mt
National e-Commerce Strategy 2024-2030 Offering VAT Incentives to SMEs
Quarterly rather than monthly VAT filing for micro-enterprises eases compliance by 40 hours annually and shrinks refund lead-times to 45 days. EUR 2.5 million (USD 2.8 million) in grants had assisted 320 merchants by September 2025, lifting export revenue potential for artisans and software firms. Alignment with the EU Import One-Stop Shop threshold at EUR 150 (USD 170) further eliminates paperwork for inventory sourced from Asia.
Strong Expat and Digital-Nomad Population Boosting Cross-Border Basket Values
About 8,000-10,000 permit-holding remote workers resided in Malta by end-2025.[3]Malta Digital Innovation Authority, “Digital Nomad Programme Statistics,” digitalmalta.org.mt Their average online basket hit EUR 180 (USD 203) versus EUR 95 (USD 107) for local residents, skewing toward fashion, electronics, and subscription services. Nomad demand has also lifted B2B procurement of coworking equipment and specialty foods, adding roughly USD 13 million to 2025 gross merchandise value.
PSD2-Driven Instant Payments Increasing Shopper Trust
The Central Bank mandated instant-euro clearing in January 2025, making funds irrevocable within 10 seconds.[4]Central Bank of Malta, “Instant Payments Rollout Announcement,” centralbankmalta.org Merchants now release orders on the same day, compressing delivery cycles from 48 hours to 12 hours for domestic shipments. Instant settlement also underpins BNPL lender liquidity, lowering merchant discount rates by 140 basis points.
Restraints Impact Analysis*
| Restraint | (~) % Impact on CAGR Forecast | Geographic Relevance | Impact Timeline |
|---|---|---|---|
| Limited Domestic Warehouse Space Driving Reliance on Overseas Fulfilment | -1.3% | National, spillover to Sicily and Southern Italy logistics hubs | Medium term (2-4 years) |
| Persistent Cash-on-Delivery Preference | -0.9% | National, strongest in rural Gozo and southern Malta villages | Long term (≥ 4 years) |
| Rising Card-Not-Present Fraud Incidents | -0.6% | National, with cross-border fraud vectors from EU and third countries | Short term (≤ 2 years) |
| High Cross-Border Shipping Costs for Small Parcels | -0.8% | National for inbound; EU-wide for outbound Maltese merchant exports | Medium term (2-4 years) |
| Source: Mordor Intelligence | |||
Limited domestic warehouse space driving reliance on overseas fulfilment
Malta maintains only 180,000 m² of modern warehouse stock, forcing 60% of parcels to route through Sicily, which adds island surcharges of EUR 27.50 (USD 31) and 1-2 days to transit. Height restrictions cap buildings at 12 meters, slicing cubic efficiency by 40%, while lease rates of EUR 120-150 per m² (USD 136-170 per m²) are double those in Southern Italy. A 4,000 m² expansion by EuroBridge in March 2025 reached 70% utilization in four months, confirming the shortage.
Persistent cash-on-delivery preference
Cash-on-delivery represented 22% of 2025 orders against 8% European average, with rural Gozo hitting 40%. Couriers levy EUR 2.50-3.50 (USD 2.8-4.0) per COD parcel, inflating fulfillment costs by up to 12% for low-value goods. Return rates rise to 28% under COD, versus 18% for prepaid orders, eroding merchant margins.
*Our forecasts treat driver/restraint impacts as directional, not additive. The impact forecasts reflect baseline growth, mix effects, and variable interactions.
Segment Analysis
By Business Model: Digitization Accelerates Wholesale Activity
B2C held 84.34% of 2025 value, yet the B2B slice is climbing fastest at 6.57% CAGR as SMEs adopt procurement platforms and exploit VAT simplification. The Malta e-commerce market size for B2B transactions is projected to jump from USD 74 million in 2026 to nearly USD 103 million by 2031, helped by average order values of USD 1,200 and the archipelago’s role as a re-export node to North Africa.
Pandemic-era workflow changes entrenched online sourcing: 76.5% of SMEs now place at least one digital order monthly, up from 48% in 2019. Re-order automation and embedded trade credit deepen buyer lock-in, sustaining higher gross margins than consumer retail. B2C growth shows early saturation at 4.3% CAGR because the population base is only 542,000 and cross-border platforms already capture 45% of outbound spend.


By Device Type (B2C): Smartphones Consolidate Lead
Mobile devices generated 69.42% of checkouts in 2025, with the mobile share of the Malta e-commerce market size expected to crest at 75% by 2031. Full 5G coverage and one-tap wallets accelerate conversion, while desktop and laptop remains relevant for high-ticket electronics and business purchases, holding significant share with a gentler 4.6% CAGR.
English-language fluency eliminates localization costs, enabling Amazon and Zalando mobile apps to gain traction without Maltese translation. Progressive-web-app adoption further narrows the performance gap, and Apple Pay, as well as Google Pay, now handle 45% of mobile transactions. Tablets and other devices together remain a niche portion of transactions.
By Payment Method (B2C): BNPL Gains but Wallets Stay Dominant
Digital wallets held a 37.68% share in 2025, underpinned by SEPA instant-payment rails and PSD2 open-banking APIs. Credit and debit cards followed at 34.2%, while BNPL expanded from a 9.8% share in 2025 toward a projected 14% by 2031, equating to a 7.23% CAGR.
Klarna reported 85 million users worldwide in 2024, with its European operations accounting for 62% of revenue. Instant settlement has lowered merchant discount rates to 3.2% for BNPL versus 1.8% for instant credit transfers, yet higher basket sizes and conversion-rate improvements justify the premium. Other methods, including bank transfers and COD, total 18.32% value share; COD’s transaction share is higher, but the average ticket is lower.
By Product Category (B2C): Food Delivery Closes the Gap
Beauty and personal care led 2025 spend at 24.67% thanks to low return rates and repeat frequency, but food and beverages are pacing fastest at 6.28% CAGR as Wolt and Deliveroo extend 30-minute grocery options. By 2031, food could approach a 20% slice of the Malta e-commerce market share, aided by high mobile-order density in urban corridors. L’Oréal realized EUR 12.1 billion (USD 13.7 billion) online revenue globally in 2024, showcasing beauty’s e-commerce maturity.
Consumer electronics held 16.3% share, fashion and apparel 18.9%, furniture and home 12.1%, and the remainder 9.4% in 2025. All secondary categories are growing between 4.2% and 5.1% due to rising BNPL penetration and improved cross-border logistics.

Geography Analysis
Malta's 316-square-kilometer geography creates unique e-commerce dynamics. The Northern Harbour District, comprising Sliema, St. Julian's, and Valletta, generates 48 percent of transaction volume despite housing 22 percent of the population. This is driven by higher disposable incomes (EUR 32,000 median annually versus EUR 24,000 nationally), dense commercial infrastructure, and a concentration of 8,000 to 10,000 digital nomads and expats. GO plc's May 2025 completion of nationwide fibre-to-the-home rollout, covering 371,000 homes with 94 percent conversion, bridged the urban-rural broadband gap. However, e-shopper penetration remains higher in urban areas (92 percent) compared to rural Gozo and southern villages (68 percent), due to older demographics and lower payment-card ownership. Cash-on-delivery is more prevalent in rural areas, accounting for 35 to 40 percent of transactions versus 22 percent nationally, adding handling costs of EUR 2.50 to EUR 3.50 per transaction.
Cross-border e-commerce dominates Malta's market, with platforms like Amazon, eBay, and Zalando estimated to account for 45 percent of market value in 2025. Investments such as Amazon's EUR 15.7 billion in European fulfillment centers and SHEIN's distribution hub in Poland have reduced delivery times, eroding domestic merchants' convenience advantage. Cross-border penetration rose from 29 percent in 2019 to an estimated 38 percent in 2025, with projections of 42 to 45 percent by 2031. Maltese merchants face challenges in outbound sales due to MaltaPost's suspension of U.S. parcel services in 2025 and APG Europe's EUR 27.50 surcharge on inbound parcels under EUR 550, creating pricing disadvantages.
Despite leading the EU in e-government service maturity, Malta's domestic e-commerce market remains fragmented, with 15 to 20 small pure-plays holding 18 percent market share in groceries and consumer electronics. The National e-Commerce Strategy 2024-2030 introduced a EUR 2.5 million E-commerce Grant Scheme, disbursing 320 grants by September 2025 to enhance merchant competitiveness. However, this pales in comparison to international investments like Zalando's EUR 1.2 billion logistics automation. Maltese merchants increasingly adopt platform-as-a-service models, leveraging tools like Stripe, Adyen, and Meta Ads to reduce time-to-market for new products from 6 months to 4 weeks, though customer acquisition costs rise to EUR 18 per new customer. Regional disparities persist, with Gozo's ferry-dependent logistics adding 90 to 120 minutes to delivery cycles and EUR 8 to EUR 12 per-parcel surcharges, limiting same-day fulfillment capabilities.
Competitive Landscape
The five largest players held a significant share in 2025, with Amazon leading the market, reflecting a moderately concentrated structure. International giants leverage scale logistics and AI merchandising, as demonstrated by Zalando Assistant’s launch in 2024. Domestic specialists focus on grocery through rapid fulfillment partnerships: Maltasupermarket.com connected to Wolt’s API in March 2025, enhancing order frequency significantly.
SHEIN opened a large Polish hub in 2024, reducing Malta delivery times and capturing a notable portion of fashion spend within a year. Local challengers are exploring vertical niches in marine equipment, gaming peripherals, but face challenges in funding dedicated warehouses due to high lease costs. Platform-as-a-service adoption is increasing: Shopify reported substantial global revenue in early 2024, with Europe emerging as a key growth area. The critical strategic question remains whether domestic firms can achieve parcel density to justify proprietary infrastructure or will continue relying on third-party logistics.
Malta E-Commerce Industry Leaders
YellowBit IT Solutions
Shein
Amazon.com Inc.
Zalando SE
Apple Inc.
- *Disclaimer: Major Players sorted in no particular order

Recent Industry Developments
- January 2026: Central Bank of Malta confirmed full real-time clearing for corporate instant payments, expanding the scheme beyond retail users.
- March 2025: EuroBridge Malta opened a 4,000 m² warehouse at Tal-Ħlas, tripling capacity to alleviate parcel backlogs.
- January 2025: Nationwide instant-euro payments rule came into force, allowing same-day fulfillment for prepaid orders.
- December 2024: Zalando rolled out Zalando Assistant, a generative-AI shopping tool integrated with its European logistics backbone.


Research Methodology Framework and Report Scope
Market Definitions and Key Coverage
Our study defines the Malta e-commerce market, according to Mordor Intelligence, as the total value of goods and services ordered and paid for online through web or mobile interfaces under both business-to-consumer and business-to-business models.
Scope exclusion: Pure online travel agencies, bill-payment portals, and peer-to-peer classified listings fall outside this scope.
Segmentation Overview
- By Business Model
- B2C
- B2B
- By Device Type (B2C)
- Smartphone / Mobile
- Desktop and Laptop
- Other Device Types
- By Payment Method (B2C)
- Credit and Debit Cards
- Digital Wallets
- BNPL
- Other Payment Methods
- By Product Category (B2C)
- Beauty and Personal Care
- Consumer Electronics
- Fashion and Apparel
- Food and Beverages
- Furniture and Home
- Toys, DIY and Media
- Other Product Categories
Detailed Research Methodology and Data Validation
Primary Research
We interviewed marketplace operators, payment processors, and SME merchants in Valletta, Sliema, and Gozo, and surveyed frequent online shoppers. These discussions helped our team verify average basket sizes, smartphone conversion rates, and return behavior, closing gaps left by desk research.
Desk Research
We began with publicly available data from the National Statistics Office, Eurostat e-commerce turnover tables, the Central Bank of Malta's card-not-present reports, the European Commission's Digital Economy and Society Index, and Ecommerce Europe country fact-sheets, which together establish demand pools and cross-border intensity. Mordor analysts layered insights from DataReportal traffic metrics, parliamentary budget papers, and MaltaPost shipping volumes to trace logistical capacity. Paid resources such as D&B Hoovers and Dow Jones Factiva provided merchant-level revenues and news events that explain quarterly swings. The sources cited are illustrative; many additional publications were reviewed for data validation and clarification.
A second pass connected patent filings on last-mile solutions, local VAT circulars, and company filings, thereby revealing how infrastructure, taxation, and consumer behavior move in tandem.
Market-Sizing & Forecasting
A top-down share-of-wallet model starts with household consumption and applies online penetration, then is cross-checked against card and digital-wallet transaction totals. Sampled merchant revenue roll-ups act as a bottom-up reasonableness check before totals are finalized. Inputs include smartphone share of orders, average order value, cross-border purchase ratio, BNPL uptake, internet-user growth, and VAT-inclusive pricing shifts. A multivariate regression forecast projects values to 2030; where merchant samples are thin, three-year moving averages anchored to Central Bank series are applied and later validated through expert calls.
Data Validation & Update Cycle
Outputs face three analyst reviews; variance triggers re-checks. Models refresh every year, with interim updates after material events such as VAT rule changes. Before release, we run a fresh desktop scan so clients receive the latest view.
Why Our Malta E-commerce Baseline Commands Reliability
Published estimates often diverge because providers adopt different spend buckets, currency bases, and refresh cadences. Mordor's disciplined scoping and yearly refresh reduce those gaps.
Key gap drivers include some publishers adding utility bill payments, others omitting micro-merchants, and several relying on untested linear growth from early-year data.
Benchmark comparison
| Market Size | Anonymized source | Primary gap driver |
|---|---|---|
| USD 453.78 m (2025) | Mordor Intelligence | - |
| USD 397 m (2024) | Regional Consultancy A | Excludes mobile-only micro-merchants |
| EUR 2.4 bn (2023) | Trade Journal B | Bundles all online payments, including utilities and travel |
| EUR 500 m (2022) | Global Consultancy A | Applies straight-line growth, no primary validation |
These contrasts show that Mordor's scoped, multi-input approach delivers a balanced, transparent baseline that decision-makers can replicate and trust.


Key Questions Answered in the Report
How fast is online retail revenue in Malta expected to grow between 2026 and 2031?
The Malta e-commerce market is forecast to expand from USD 477.66 million in 2026 to USD 608.71 million by 2031, equating to a 4.97% CAGR.
Which device type dominates online purchases among Maltese shoppers?
Smartphones account for 69.42% of 2025 transactions and are projected to exceed 75% of activity by 2031.
What is driving the surge in B2B online transactions?
Simplified VAT rules, grant funding, and SMEs' migration to digital procurement platforms are propelling B2B spending at a 6.57% CAGR.
Why do many Maltese consumers still favor cash-on-delivery?
Legacy trust issues, older demographics in Gozo, and limited card ownership keep COD at 22% of orders despite higher costs and returns.
How will instant euro payments affect local merchants?
Real-time settlement cuts order-to-delivery cycles to 12 hours for domestic shipments and reduces payment risk, boosting shopper trust and merchant liquidity.
Page last updated on:


